| Param | Original file | Final file |
|---|---|---|
| Filename | modeM0/AS1C07_001T10_9000005856_43150cztM0_level2.fits | modeM0/AS1C07_001T10_9000005856_43150cztM0_level2_quad_clean.evt |
| Size (bytes) | 357,295,680 | 91,100,160 |
| Size | 340.7 MB | 86.9 MB |
| Events in quadrant A | 3,897,621 | 597,417 |
| Events in quadrant B | 2,488,485 | 622,656 |
| Events in quadrant C | 3,502,784 | 590,325 |
| Events in quadrant D | 2,893,259 | 549,816 |
| Mode M9 | |||
|---|---|---|---|
| Quadrant | BADHDUFLAG | Total packets | Discarded packets |
| A | 0 | 31 | 0 |
| B | 0 | 31 | 0 |
| C | 0 | 31 | 0 |
| D | 0 | 31 | 0 |
| Mode SS | |||
|---|---|---|---|
| Quadrant | BADHDUFLAG | Total packets | Discarded packets |
| A | 0 | 116 | 0 |
| B | 0 | 116 | 0 |
| C | 0 | 116 | 0 |
| D | 0 | 116 | 0 |
| Mode M0 | |||
|---|---|---|---|
| Quadrant | BADHDUFLAG | Total packets | Discarded packets |
| A | 0 | 15572 | 2 |
| B | 0 | 11590 | 2 |
| C | 0 | 14240 | 2 |
| D | 0 | 12919 | 2 |
| Quadrant | Total seconds | Saturated seconds | Saturation percentage |
|---|---|---|---|
| A | 5702 | 94 | 1.648544% |
| B | 5703 | 2 | 0.035069% |
| C | 5703 | 32 | 0.561108% |
| D | 5703 | 75 | 1.315097% |
Noise dominated data is calculated using 1-second bins in cleaned event files. If a bin has >2000 counts, and if more than 50% of those come from <1% of pixels, then it is considered to be noise-dominated and hence unusable.
| Quadrant | # 1 sec bins | Bins with >0 counts | Bins with >2000 counts | High rate bins dominated by noise | Noise dominated (total time) | Noise dominated (detector-on time) | Marked lightcurve |
|---|---|---|---|---|---|---|---|
| A | 8778 | 5703 | 53 | 53 | 0.60% | 0.93% | 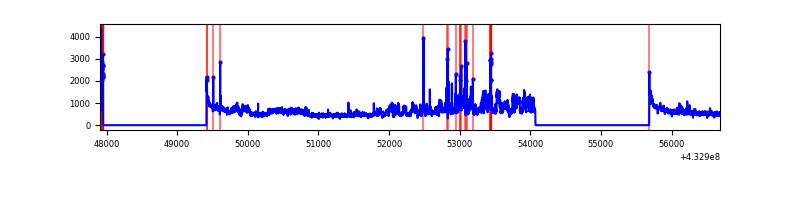 |
| B | 8779 | 5705 | 0 | 0 | 0.00% | 0.00% | 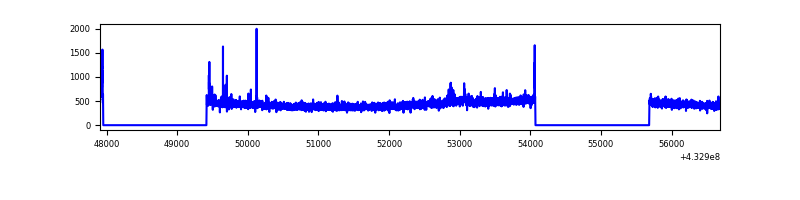 |
| C | 8779 | 5705 | 22 | 22 | 0.25% | 0.39% | 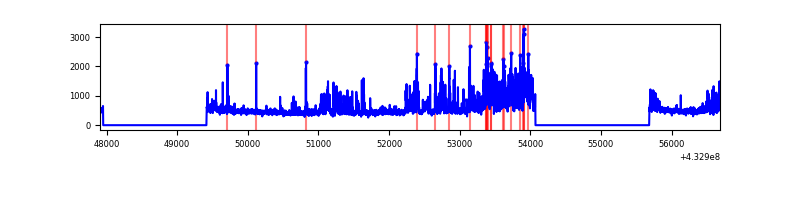 |
| D | 8779 | 5705 | 72 | 72 | 0.82% | 1.26% | 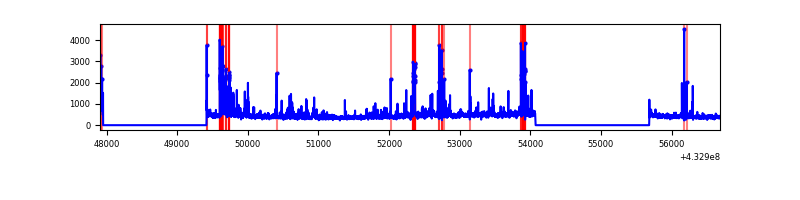 |
Top three noisy pixels from each quadrant. If the there are fewer than three noisy pixels in the level2.evt file, extra rows are filled as -1
| Pixel properties | Quadrant properties | ||||||
|---|---|---|---|---|---|---|---|
| Quadrant | DetID | PixID | Counts | Sigma | Mean | Median | Sigma |
| A | 15 | 222 | 738122 | 5962.79 | 598 | 587 | 123.7 |
| A | 10 | 83 | 612135 | 4944.22 | 598 | 587 | 123.7 |
| A | 15 | 237 | 201484 | 1624.2 | 598 | 587 | 123.7 |
| B | 0 | 229 | 69637 | 594.47 | 600 | 582 | 116.2 |
| B | 5 | 255 | 23478 | 197.1 | 600 | 582 | 116.2 |
| B | 0 | 186 | 20228 | 169.13 | 600 | 582 | 116.2 |
| C | 14 | 254 | 927218 | 6802.15 | 584 | 586 | 136.2 |
| C | 15 | 214 | 257094 | 1882.96 | 584 | 586 | 136.2 |
| C | 0 | 239 | 30548 | 219.94 | 584 | 586 | 136.2 |
| D | 1 | 52 | 484813 | 3351.36 | 585 | 566 | 144.5 |
| D | 1 | 47 | 60898 | 417.54 | 585 | 566 | 144.5 |
| D | 5 | 32 | 40503 | 276.39 | 585 | 566 | 144.5 |
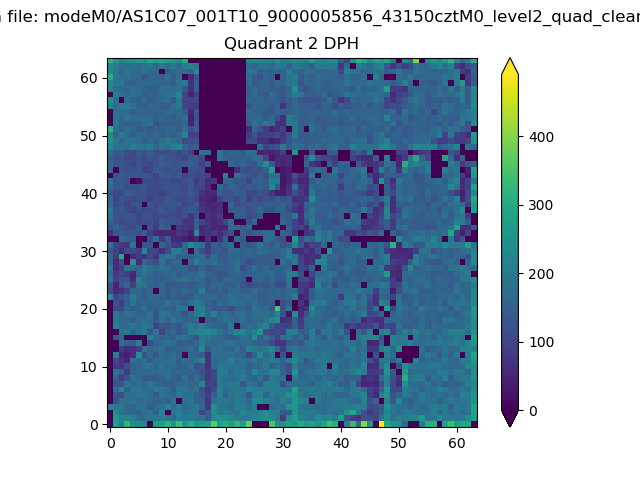
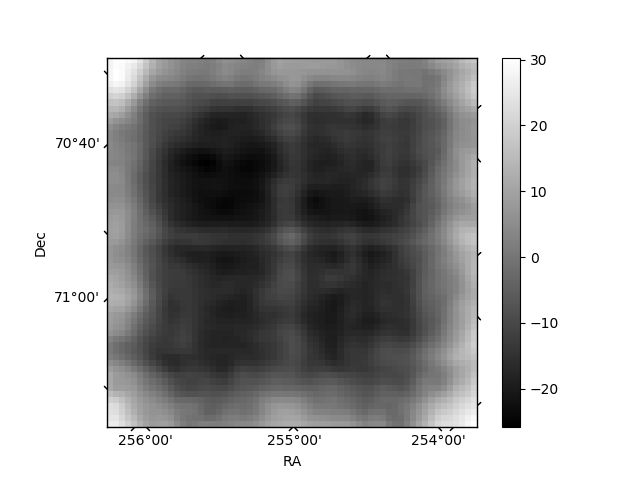
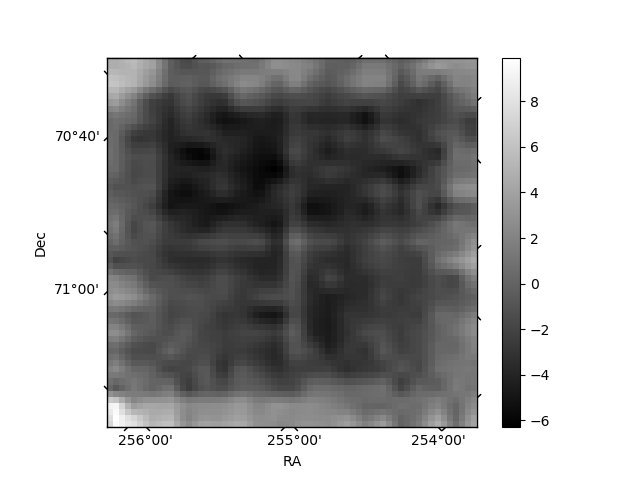
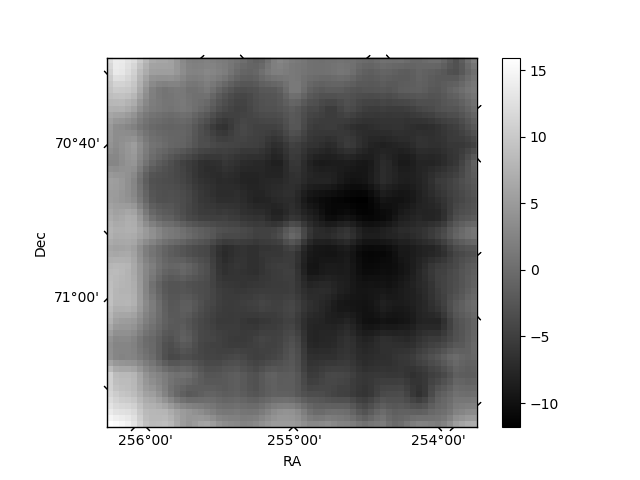
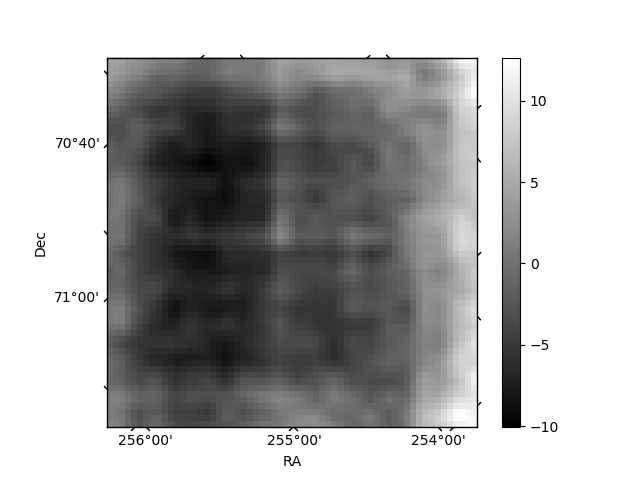
Histogram calculated using DETX and DETY for each event in the final _common_clean file
| Quadrant A | 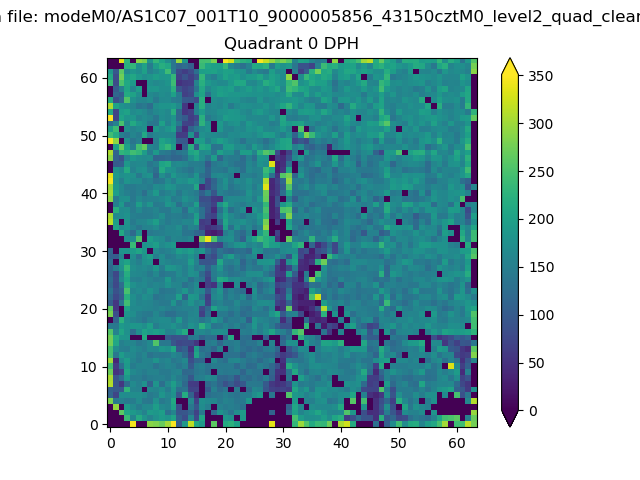 |
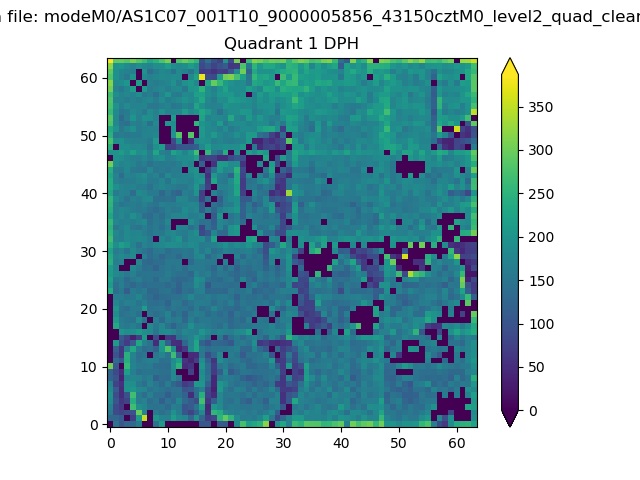 |
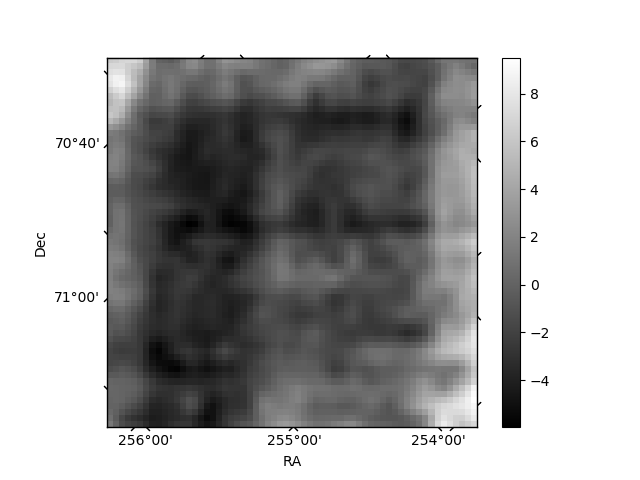
Quadrant B |
|---|---|---|---|
| Quadrant D | 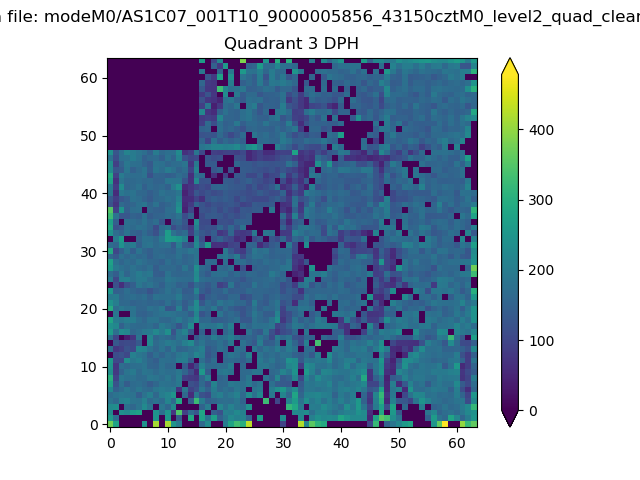 |
 |
Quadrant C |
| Plot type | Count rate plots | Images |
|---|---|---|
| Comparison with Poisson distribution Blue bars denote a histogram of data divided into 1 sec bins. Red curve is a Poisson curve with rate = median count rate of data. |
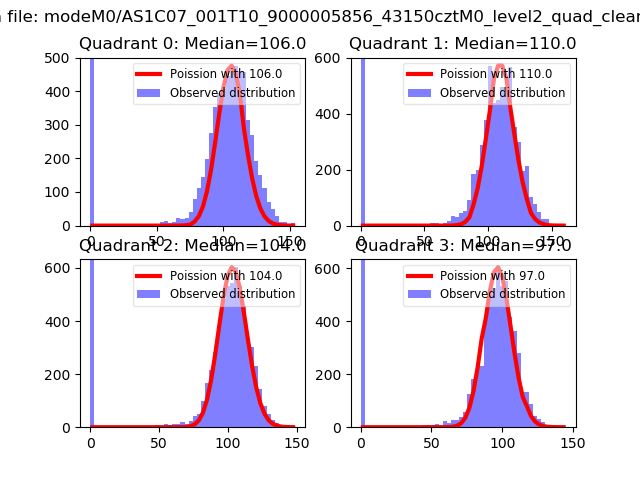 |
 |
| Quadrant-wise count rates Data is divided into 100 sec bins |
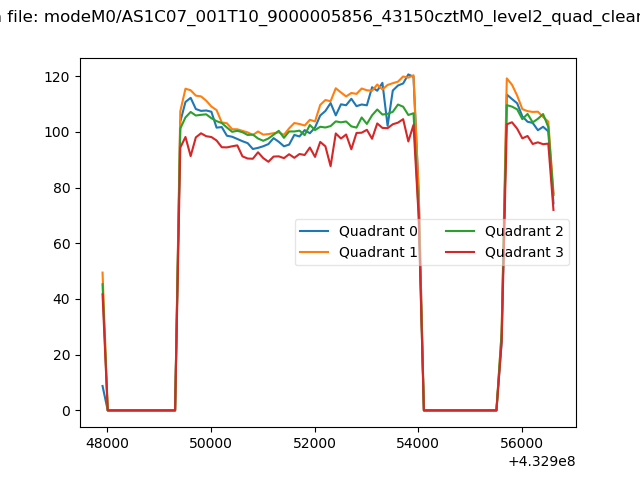 |
|
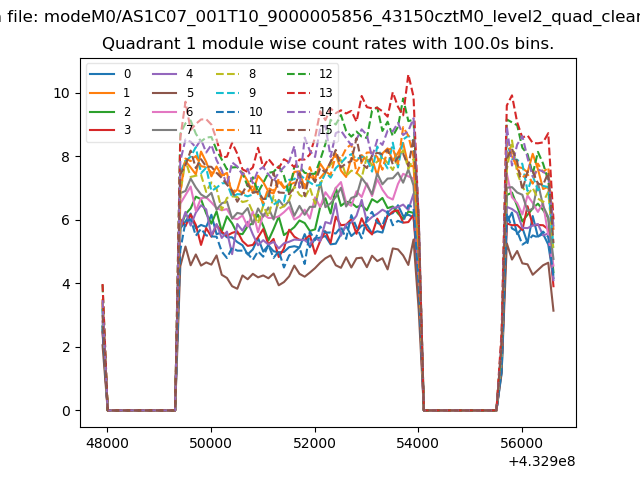
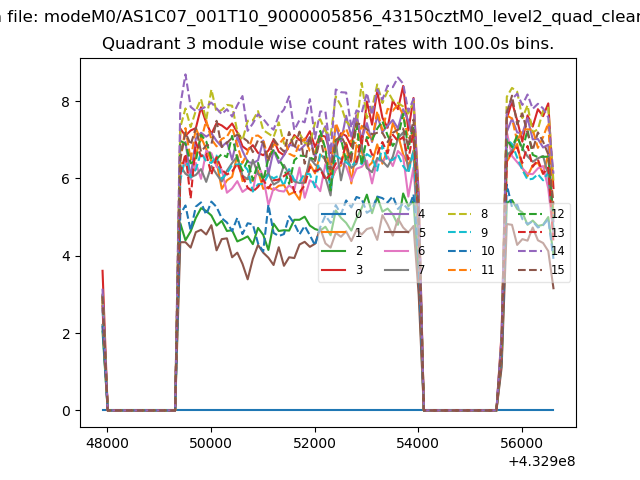
| Module-wise count rates for Quadrant A Data is divided into 100 sec bins |
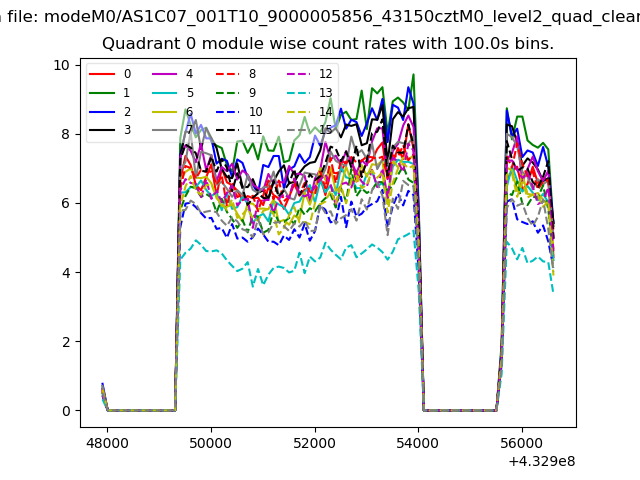 |
 |
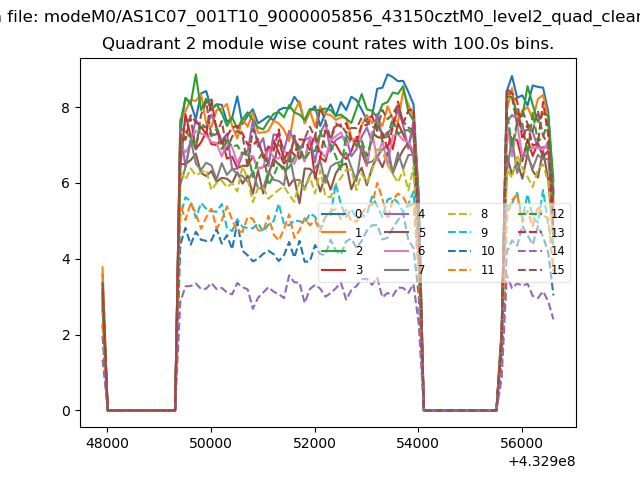
| Module-wise count rates for Quadrant B Data is divided into 100 sec bins |
 |
 |
| Module-wise count rates for Quadrant C Data is divided into 100 sec bins |
 |
 |
| Module-wise count rates for Quadrant D Data is divided into 100 sec bins |
 |
 |
| Parameter | Plot |
|---|---|
| CZT HV Monitor | 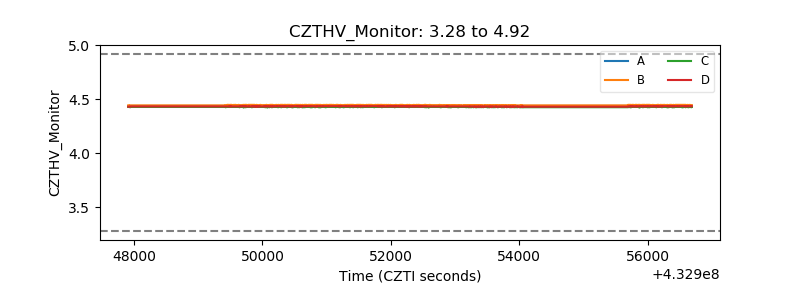 |
| D_VDD | 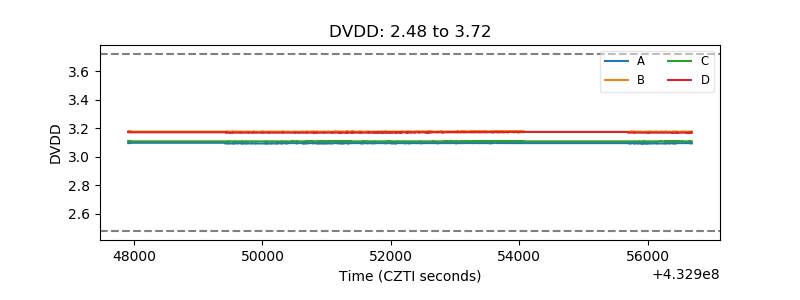 |
| Temperature 1 | 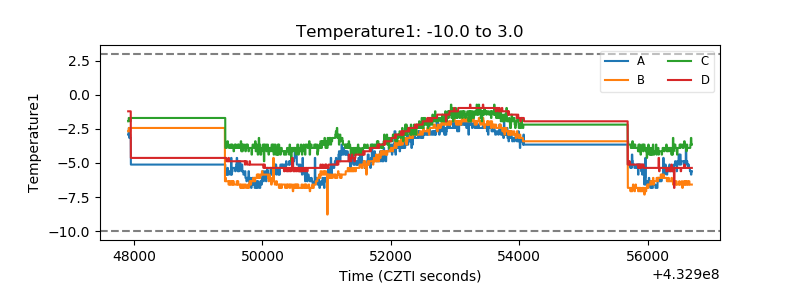 |
| Veto HV Monitor | 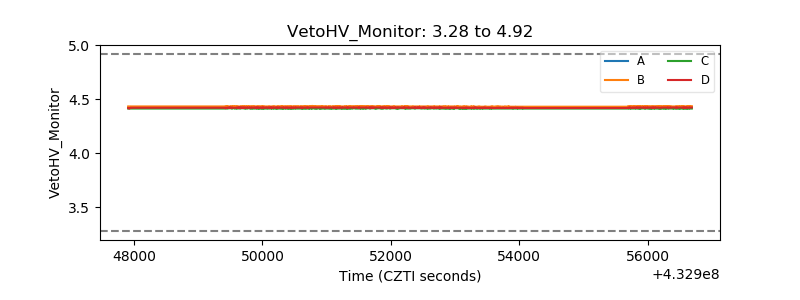 |
| Veto LLD | 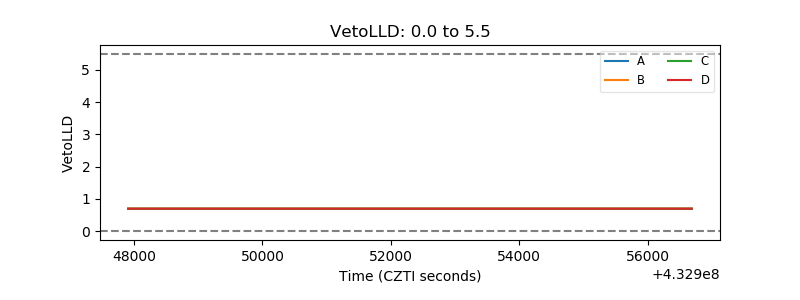 |
| Alpha Counter | 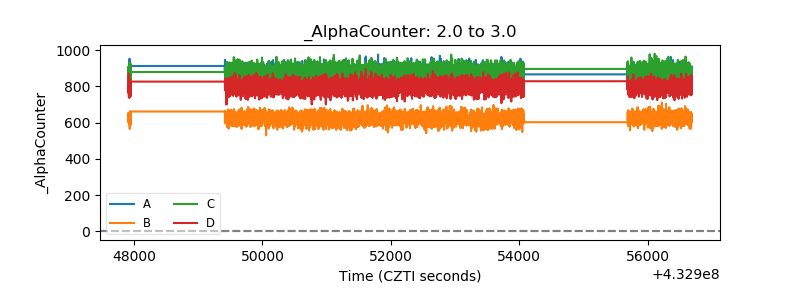 |
| _CPM_Rate | 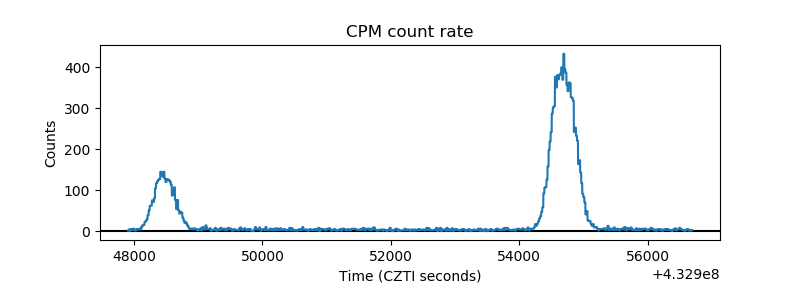 |
| CZT Counter | 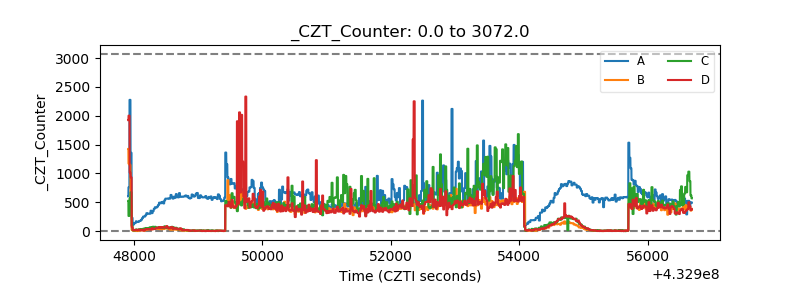 |
| +2.5 Volts monitor | 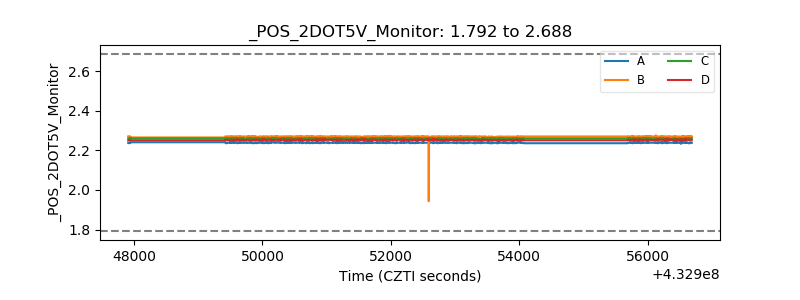 |
| +5 Volts monitor | 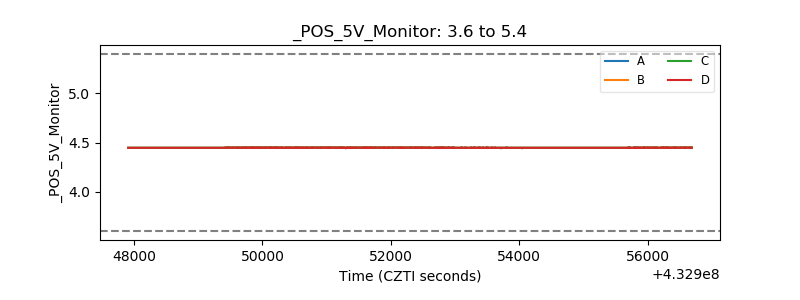 |
| _ROLL_ROT | 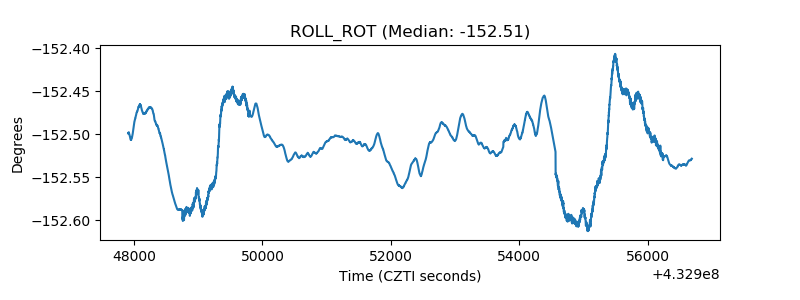 |
| _Roll_DEC | 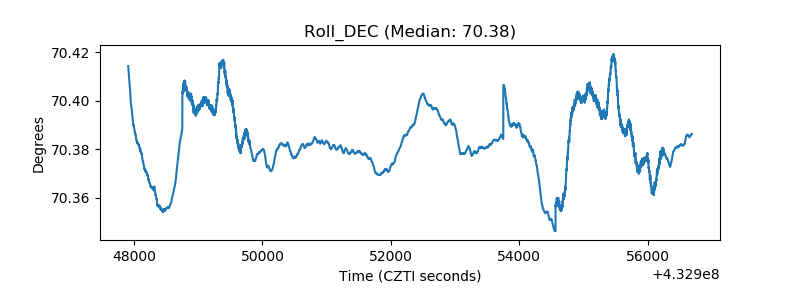 |
| _Roll_RA | 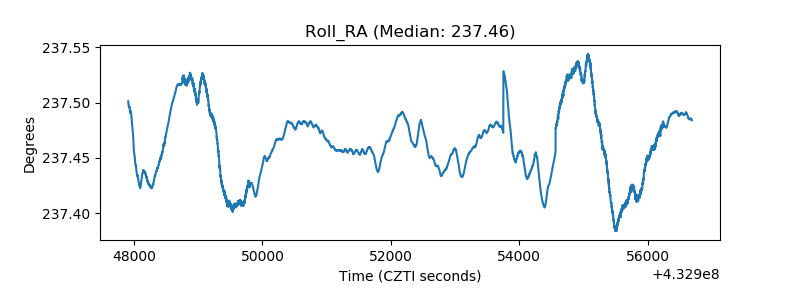 |
| Veto Counter | 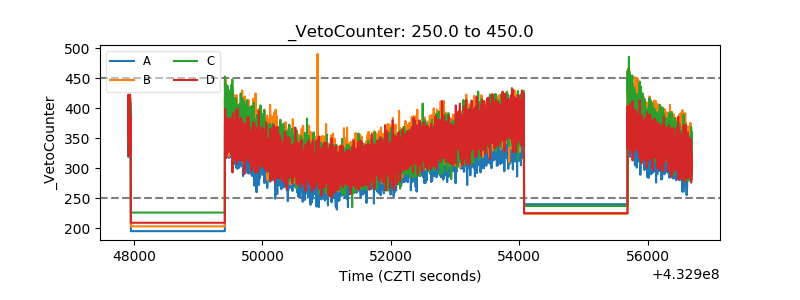 |