| Param | Original file | Final file |
|---|---|---|
| Filename | modeM0/AS1C07_001T10_9000005856_43152cztM0_level2.fits | modeM0/AS1C07_001T10_9000005856_43152cztM0_level2_quad_clean.evt |
| Size (bytes) | 345,127,680 | 91,690,560 |
| Size | 329.1 MB | 87.4 MB |
| Events in quadrant A | 3,786,537 | 603,801 |
| Events in quadrant B | 2,501,741 | 630,416 |
| Events in quadrant C | 3,198,912 | 597,654 |
| Events in quadrant D | 2,845,906 | 547,108 |
| Mode M9 | |||
|---|---|---|---|
| Quadrant | BADHDUFLAG | Total packets | Discarded packets |
| A | 0 | 33 | 0 |
| B | 0 | 33 | 0 |
| C | 0 | 33 | 0 |
| D | 0 | 33 | 0 |
| Mode SS | |||
|---|---|---|---|
| Quadrant | BADHDUFLAG | Total packets | Discarded packets |
| A | 0 | 118 | 0 |
| B | 0 | 118 | 0 |
| C | 0 | 118 | 0 |
| D | 0 | 118 | 0 |
| Mode M0 | |||
|---|---|---|---|
| Quadrant | BADHDUFLAG | Total packets | Discarded packets |
| A | 0 | 14978 | 2 |
| B | 0 | 11578 | 2 |
| C | 0 | 13233 | 2 |
| D | 0 | 12855 | 2 |
| Quadrant | Total seconds | Saturated seconds | Saturation percentage |
|---|---|---|---|
| A | 5680 | 142 | 2.500000% |
| B | 5681 | 6 | 0.105615% |
| C | 5681 | 20 | 0.352051% |
| D | 5681 | 135 | 2.376342% |
Noise dominated data is calculated using 1-second bins in cleaned event files. If a bin has >2000 counts, and if more than 50% of those come from <1% of pixels, then it is considered to be noise-dominated and hence unusable.
| Quadrant | # 1 sec bins | Bins with >0 counts | Bins with >2000 counts | High rate bins dominated by noise | Noise dominated (total time) | Noise dominated (detector-on time) | Marked lightcurve |
|---|---|---|---|---|---|---|---|
| A | 9026 | 5682 | 96 | 96 | 1.06% | 1.69% | 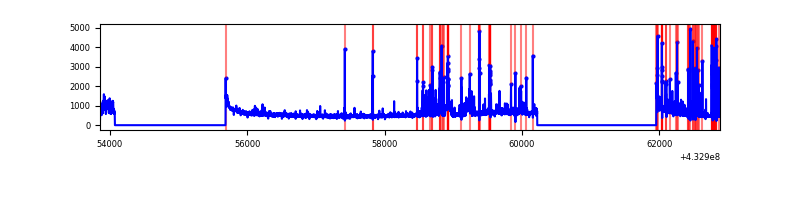 |
| B | 9027 | 5683 | 0 | 0 | 0.00% | 0.00% | 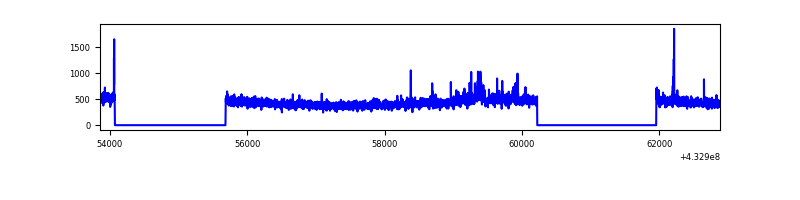 |
| C | 9027 | 5683 | 8 | 8 | 0.09% | 0.14% | 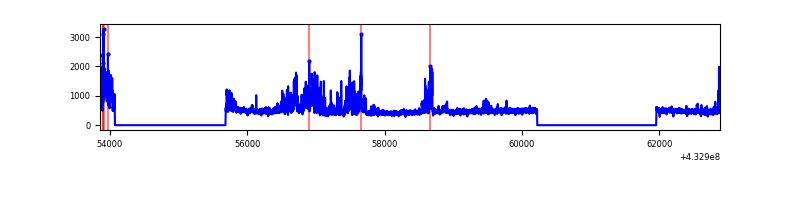 |
| D | 9027 | 5683 | 97 | 97 | 1.07% | 1.71% | 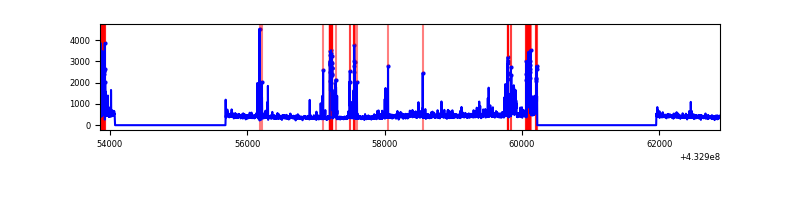 |
Top three noisy pixels from each quadrant. If the there are fewer than three noisy pixels in the level2.evt file, extra rows are filled as -1
| Pixel properties | Quadrant properties | ||||||
|---|---|---|---|---|---|---|---|
| Quadrant | DetID | PixID | Counts | Sigma | Mean | Median | Sigma |
| A | 10 | 83 | 605942 | 4917.08 | 598 | 585 | 123.1 |
| A | 15 | 222 | 578238 | 4692.05 | 598 | 585 | 123.1 |
| A | 15 | 237 | 253872 | 2057.35 | 598 | 585 | 123.1 |
| B | 0 | 186 | 58606 | 499.36 | 601 | 583 | 116.2 |
| B | 0 | 229 | 44821 | 380.72 | 601 | 583 | 116.2 |
| B | 0 | 189 | 16312 | 135.37 | 601 | 583 | 116.2 |
| C | 14 | 254 | 664421 | 4892.0 | 583 | 585 | 135.7 |
| C | 15 | 214 | 255289 | 1876.99 | 583 | 585 | 135.7 |
| C | 13 | 61 | 3864 | 24.16 | 583 | 585 | 135.7 |
| D | 1 | 52 | 227689 | 1614.83 | 580 | 564 | 140.6 |
| D | 13 | 249 | 183295 | 1299.2 | 580 | 564 | 140.6 |
| D | 10 | 118 | 175129 | 1241.14 | 580 | 564 | 140.6 |
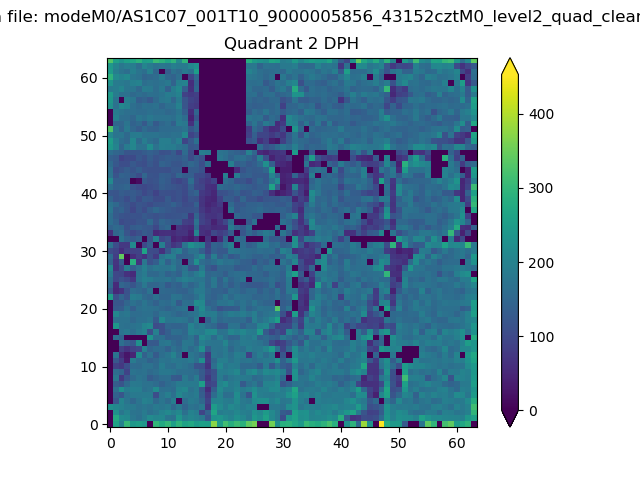
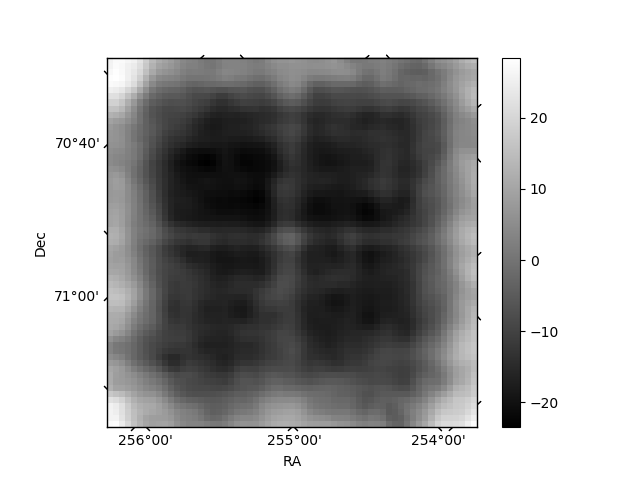
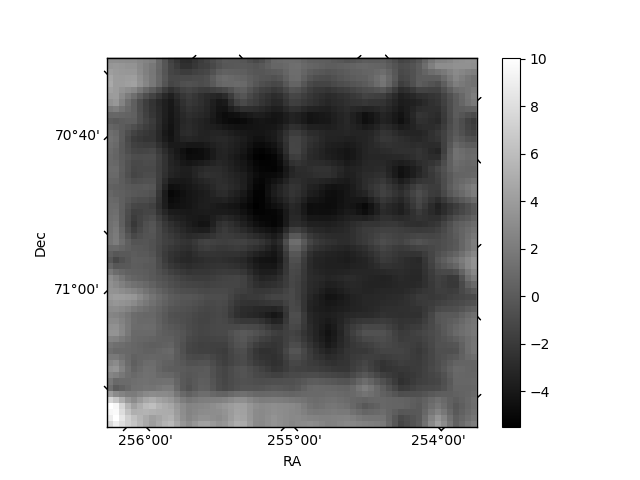
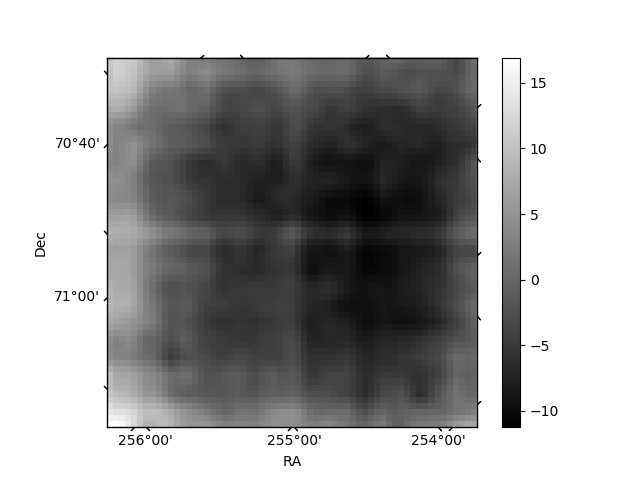
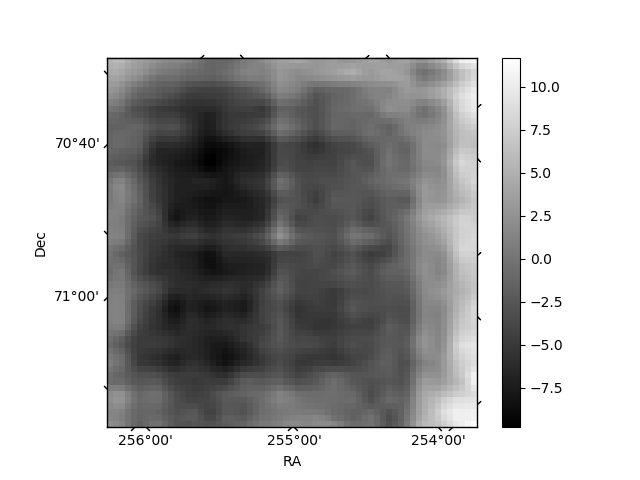
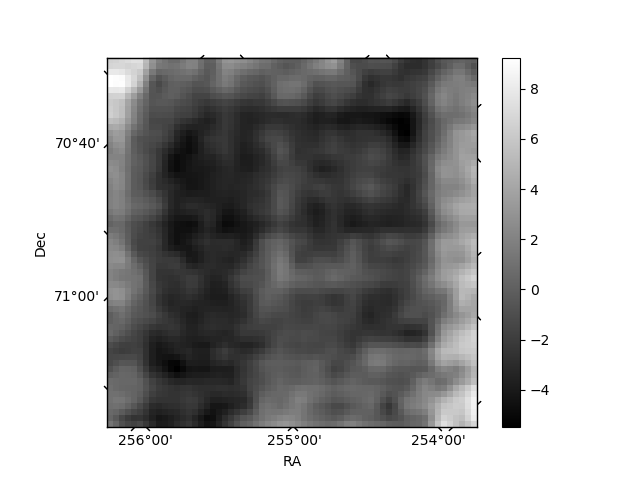
Histogram calculated using DETX and DETY for each event in the final _common_clean file
| Quadrant A | 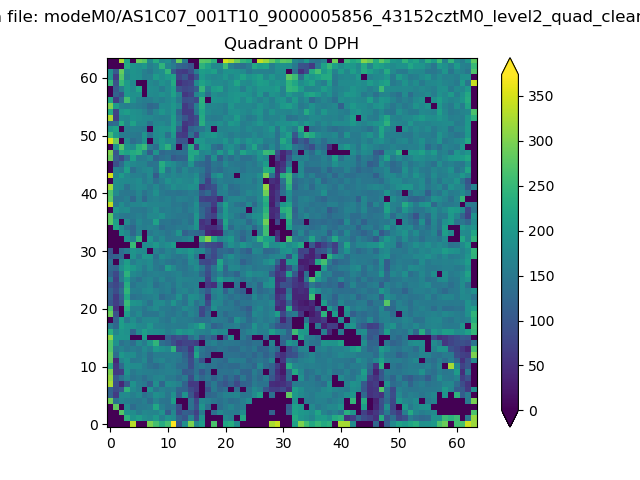 |
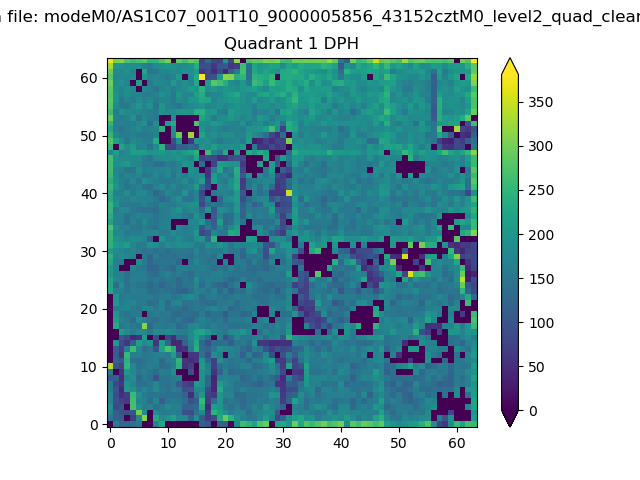 |
Quadrant B |
|---|---|---|---|
| Quadrant D | 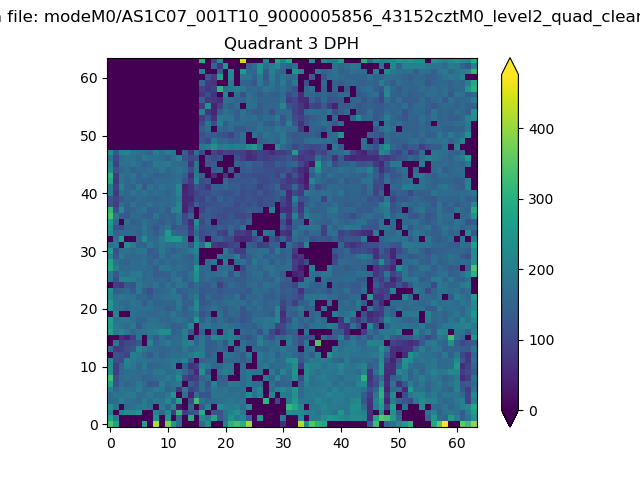 |
 |
Quadrant C |
| Plot type | Count rate plots | Images |
|---|---|---|
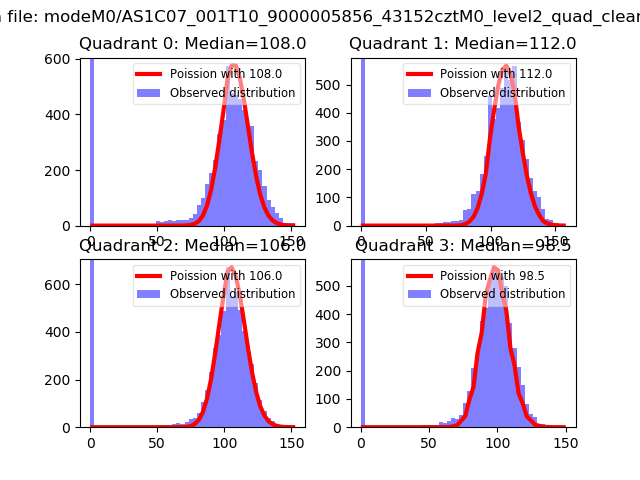
| Comparison with Poisson distribution Blue bars denote a histogram of data divided into 1 sec bins. Red curve is a Poisson curve with rate = median count rate of data. |
 |
 |
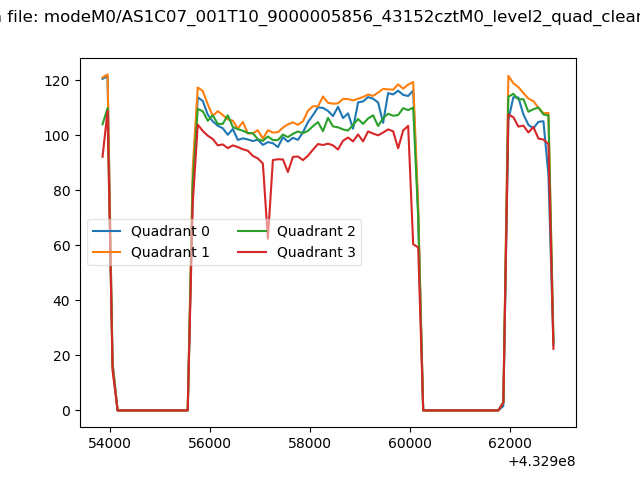
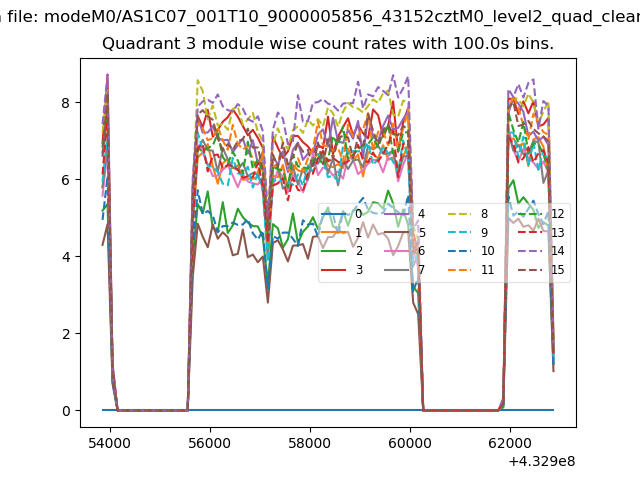
| Quadrant-wise count rates Data is divided into 100 sec bins |
 |
|
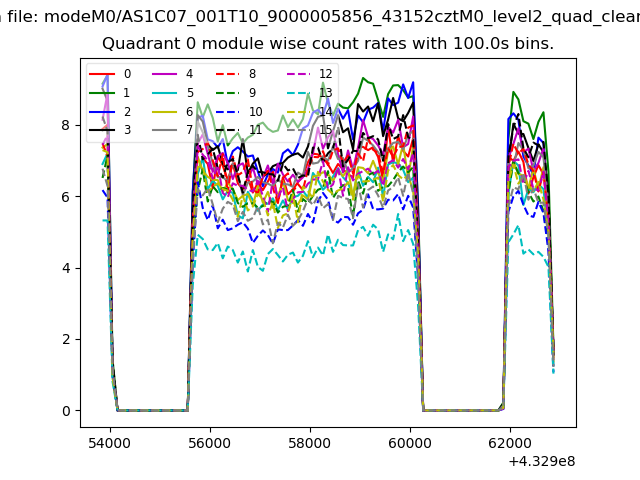
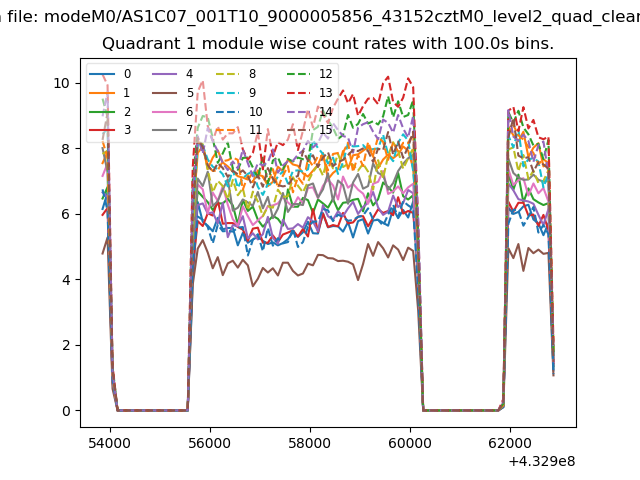
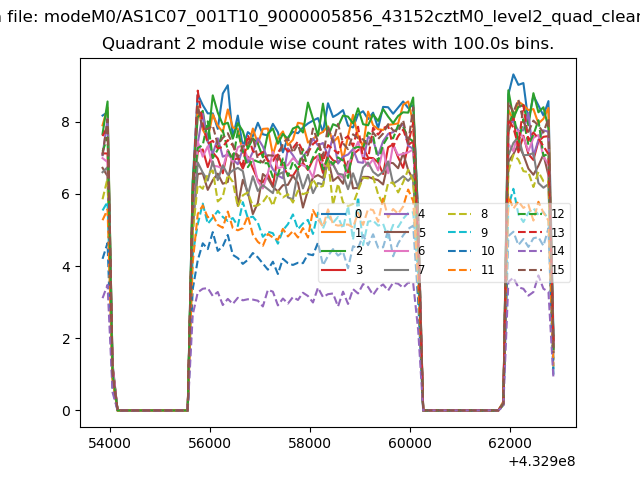
| Module-wise count rates for Quadrant A Data is divided into 100 sec bins |
 |
 |
| Module-wise count rates for Quadrant B Data is divided into 100 sec bins |
 |
 |
| Module-wise count rates for Quadrant C Data is divided into 100 sec bins |
 |
 |
| Module-wise count rates for Quadrant D Data is divided into 100 sec bins |
 |
 |
| Parameter | Plot |
|---|---|
| CZT HV Monitor | 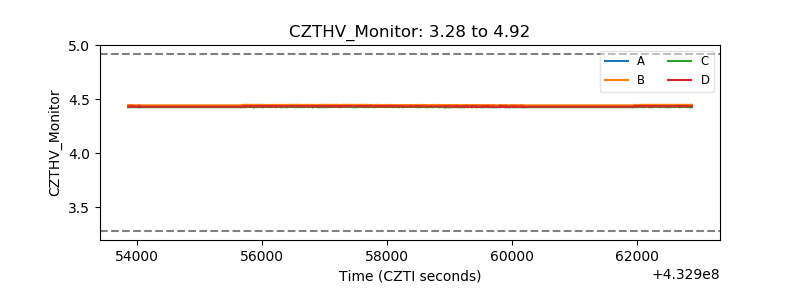 |
| D_VDD | 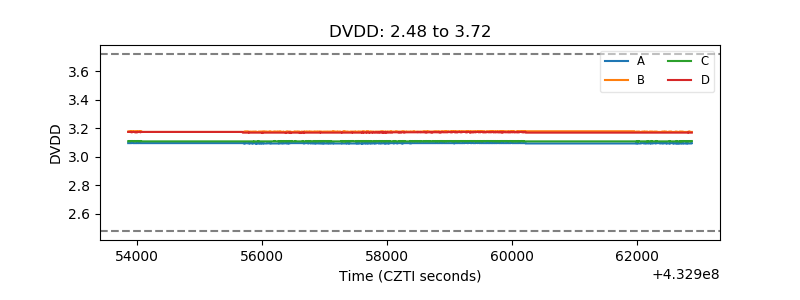 |
| Temperature 1 | 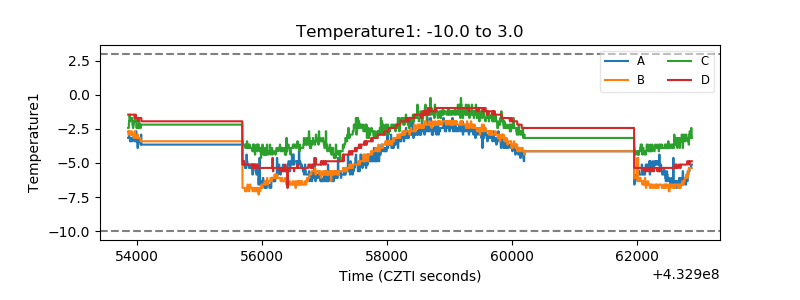 |
| Veto HV Monitor | 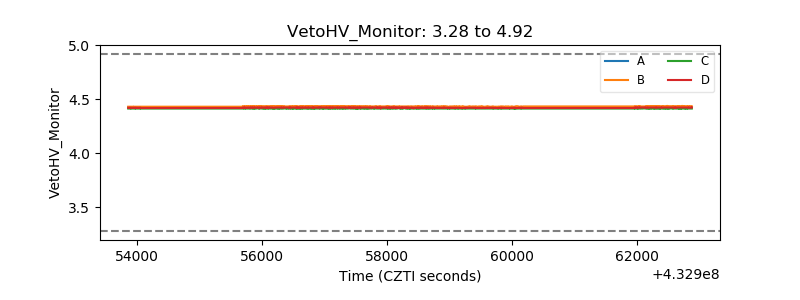 |
| Veto LLD | 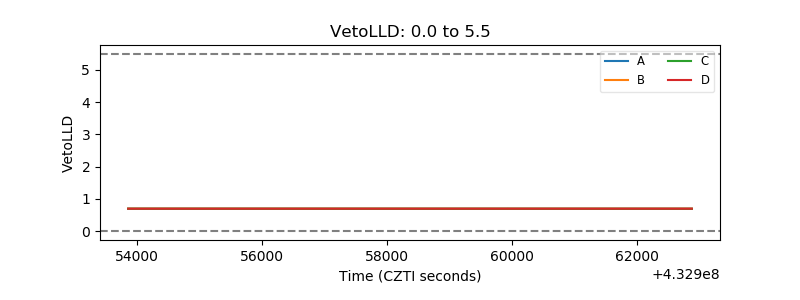 |
| Alpha Counter | 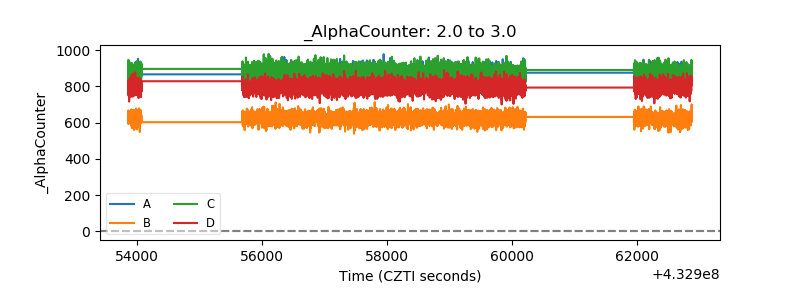 |
| _CPM_Rate | 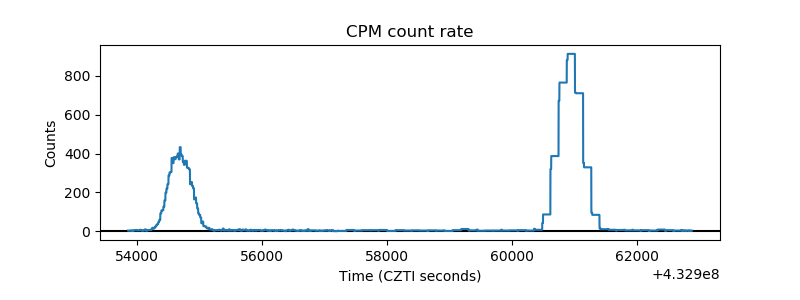 |
| CZT Counter | 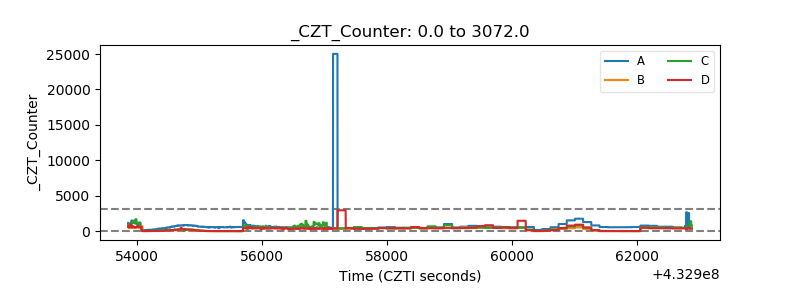 |
| +2.5 Volts monitor | 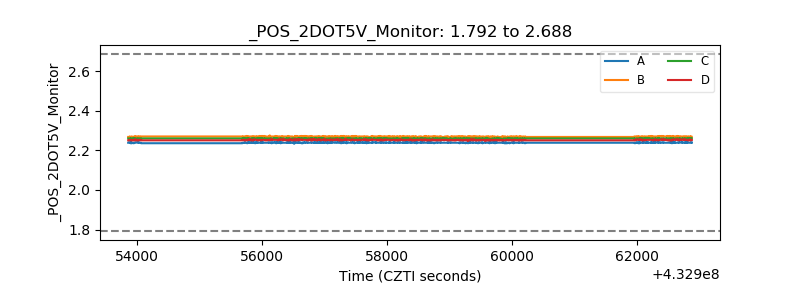 |
| +5 Volts monitor | 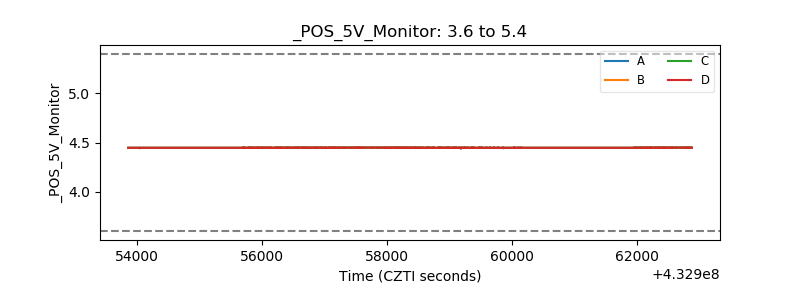 |
| _ROLL_ROT | 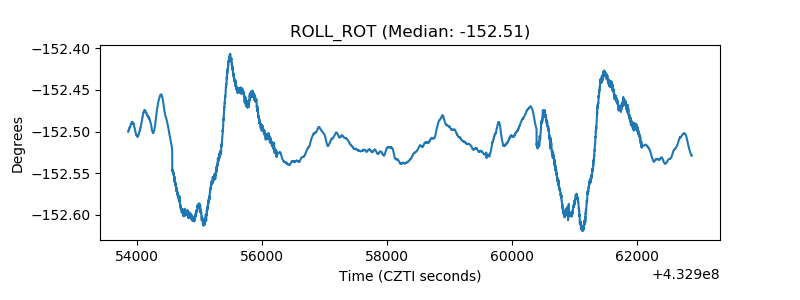 |
| _Roll_DEC | 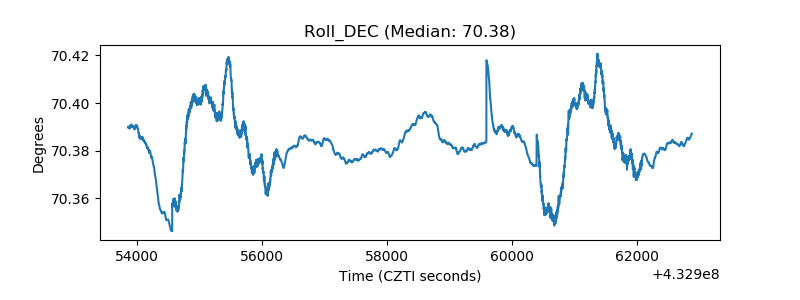 |
| _Roll_RA | 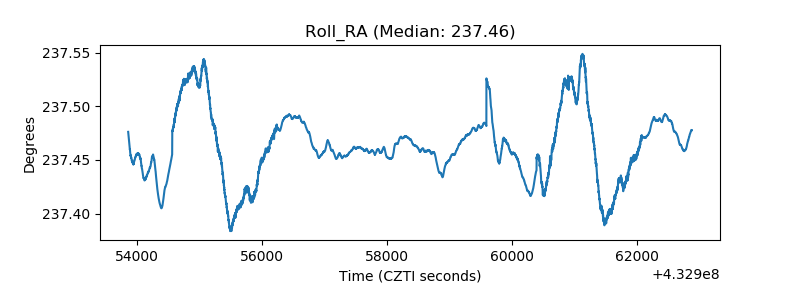 |
| Veto Counter | 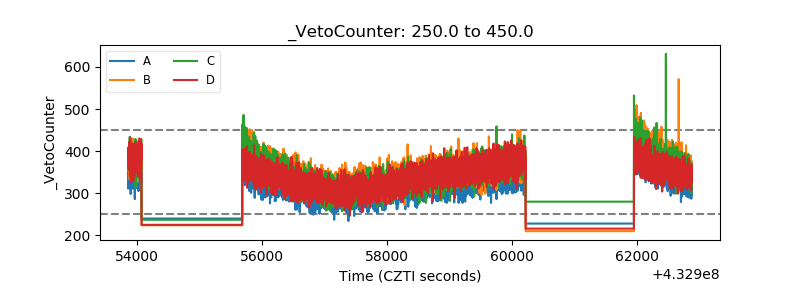 |