| Param | Original file | Final file |
|---|---|---|
| Filename | modeM0/AS1C07_001T10_9000005856_43153cztM0_level2.fits | modeM0/AS1C07_001T10_9000005856_43153cztM0_level2_quad_clean.evt |
| Size (bytes) | 302,152,320 | 87,131,520 |
| Size | 288.2 MB | 83.1 MB |
| Events in quadrant A | 3,554,933 | 571,334 |
| Events in quadrant B | 2,498,657 | 603,988 |
| Events in quadrant C | 2,496,689 | 568,244 |
| Events in quadrant D | 2,225,063 | 526,832 |
| Mode M9 | |||
|---|---|---|---|
| Quadrant | BADHDUFLAG | Total packets | Discarded packets |
| A | 0 | 19 | 0 |
| B | 0 | 20 | 0 |
| C | 0 | 20 | 0 |
| D | 0 | 20 | 0 |
| Mode SS | |||
|---|---|---|---|
| Quadrant | BADHDUFLAG | Total packets | Discarded packets |
| A | 0 | 108 | 0 |
| B | 0 | 108 | 0 |
| C | 0 | 108 | 0 |
| D | 0 | 108 | 0 |
| Mode M0 | |||
|---|---|---|---|
| Quadrant | BADHDUFLAG | Total packets | Discarded packets |
| A | 0 | 13784 | 2 |
| B | 0 | 11110 | 2 |
| C | 0 | 10873 | 2 |
| D | 0 | 10724 | 2 |
| Quadrant | Total seconds | Saturated seconds | Saturation percentage |
|---|---|---|---|
| A | 5249 | 214 | 4.076967% |
| B | 5249 | 17 | 0.323871% |
| C | 5249 | 14 | 0.266717% |
| D | 5249 | 21 | 0.400076% |
Noise dominated data is calculated using 1-second bins in cleaned event files. If a bin has >2000 counts, and if more than 50% of those come from <1% of pixels, then it is considered to be noise-dominated and hence unusable.
| Quadrant | # 1 sec bins | Bins with >0 counts | Bins with >2000 counts | High rate bins dominated by noise | Noise dominated (total time) | Noise dominated (detector-on time) | Marked lightcurve |
|---|---|---|---|---|---|---|---|
| A | 7101 | 5250 | 163 | 163 | 2.30% | 3.10% | 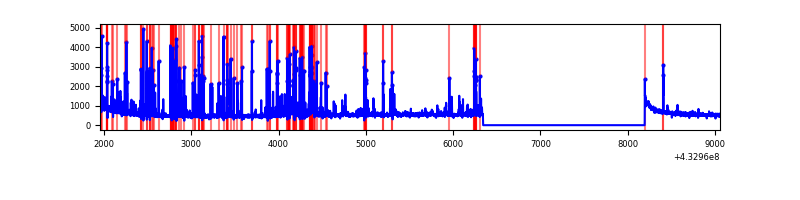 |
| B | 7101 | 5250 | 3 | 3 | 0.04% | 0.06% | 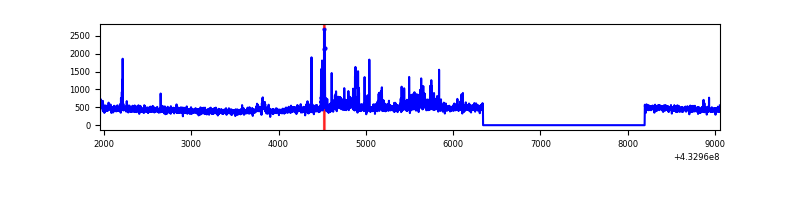 |
| C | 7101 | 5250 | 9 | 9 | 0.13% | 0.17% | 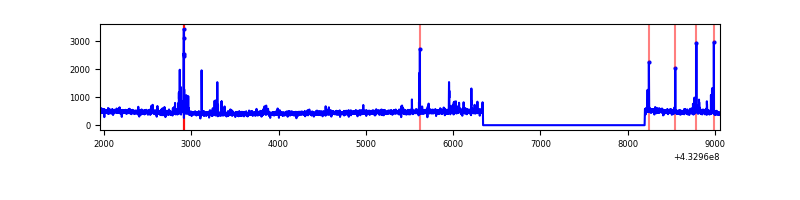 |
| D | 7101 | 5250 | 13 | 13 | 0.18% | 0.25% | 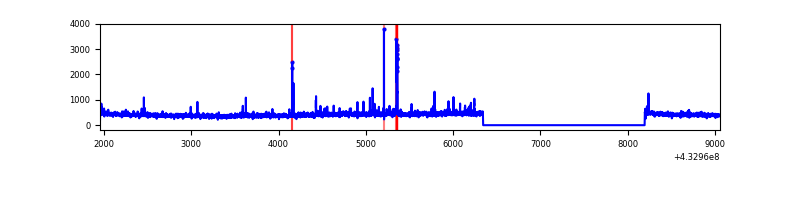 |
Top three noisy pixels from each quadrant. If the there are fewer than three noisy pixels in the level2.evt file, extra rows are filled as -1
| Pixel properties | Quadrant properties | ||||||
|---|---|---|---|---|---|---|---|
| Quadrant | DetID | PixID | Counts | Sigma | Mean | Median | Sigma |
| A | 10 | 83 | 584474 | 5104.72 | 557 | 546 | 114.4 |
| A | 15 | 222 | 471949 | 4121.02 | 557 | 546 | 114.4 |
| A | 15 | 237 | 318241 | 2777.3 | 557 | 546 | 114.4 |
| B | 0 | 229 | 132516 | 1224.85 | 563 | 547 | 107.7 |
| B | 0 | 186 | 38829 | 355.31 | 563 | 547 | 107.7 |
| B | 5 | 172 | 38271 | 350.13 | 563 | 547 | 107.7 |
| C | 15 | 214 | 234033 | 1853.36 | 543 | 546 | 126.0 |
| C | 14 | 254 | 127599 | 1008.51 | 543 | 546 | 126.0 |
| C | 0 | 239 | 9768 | 73.2 | 543 | 546 | 126.0 |
| D | 5 | 171 | 37710 | 280.48 | 547 | 532 | 132.6 |
| D | 1 | 52 | 29892 | 221.5 | 547 | 532 | 132.6 |
| D | 2 | 234 | 26839 | 198.47 | 547 | 532 | 132.6 |
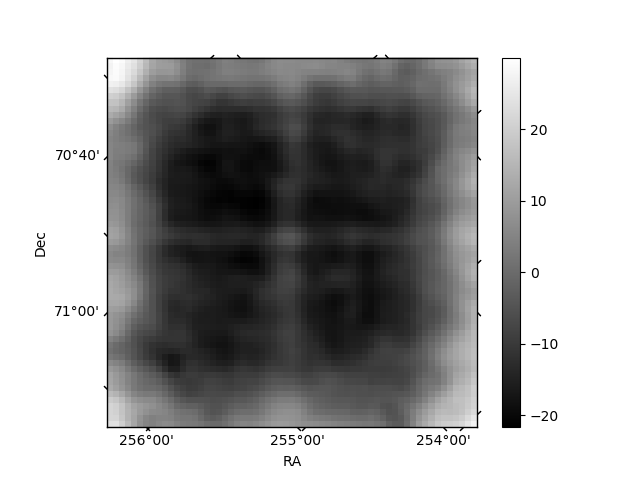
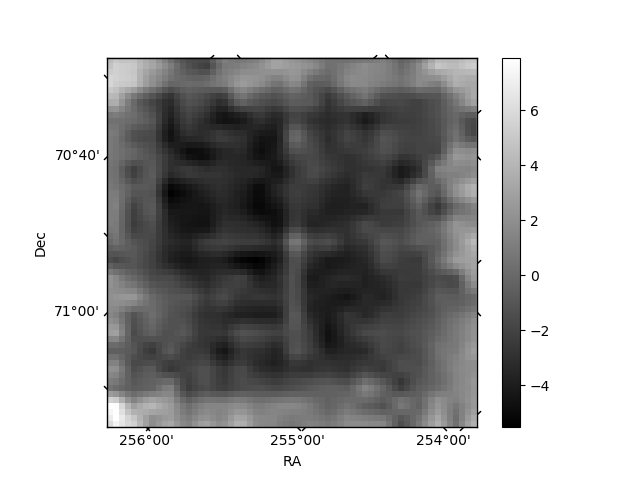
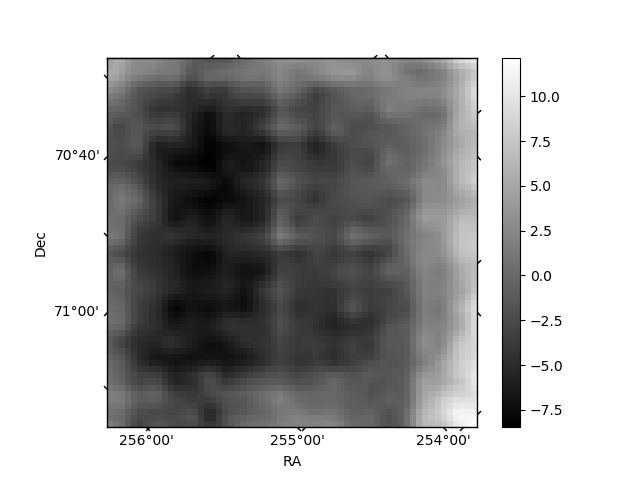
Histogram calculated using DETX and DETY for each event in the final _common_clean file
| Quadrant A | 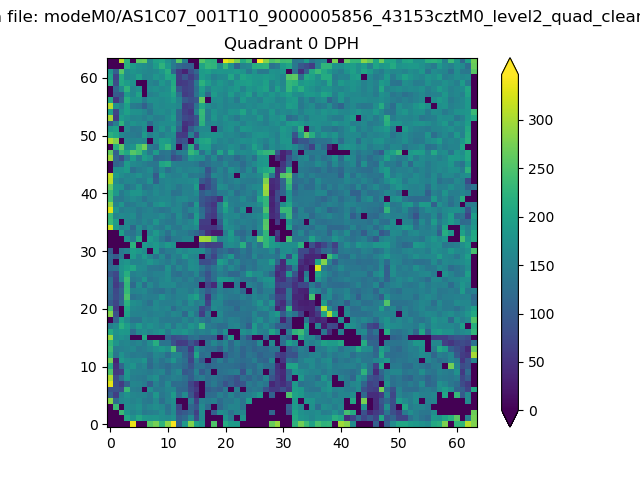 |
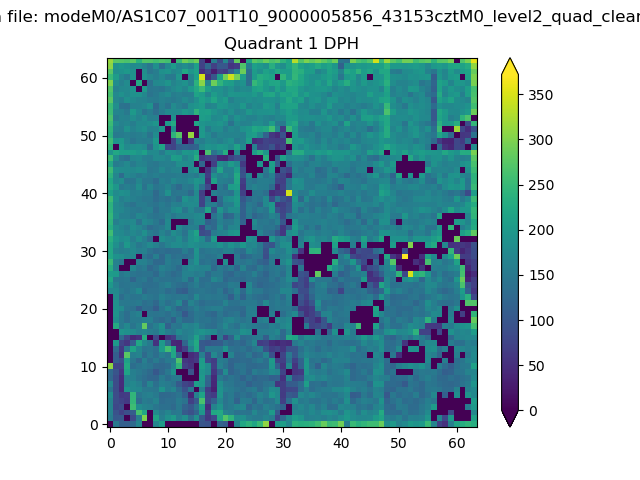 |
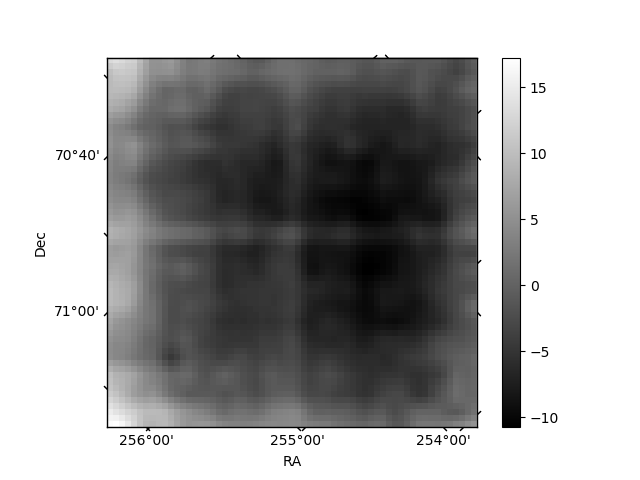
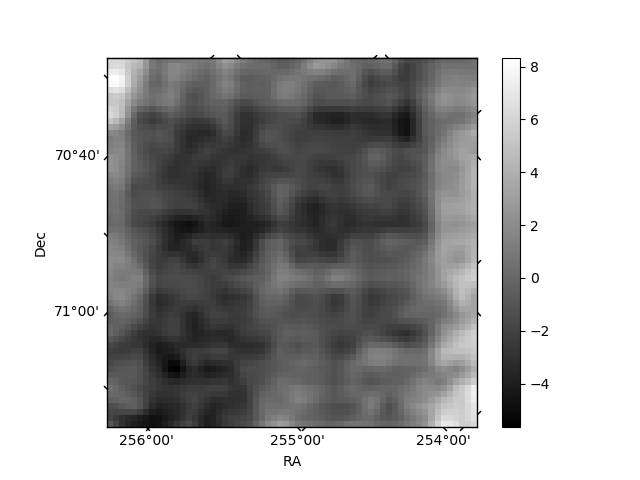
Quadrant B |
|---|---|---|---|
| Quadrant D | 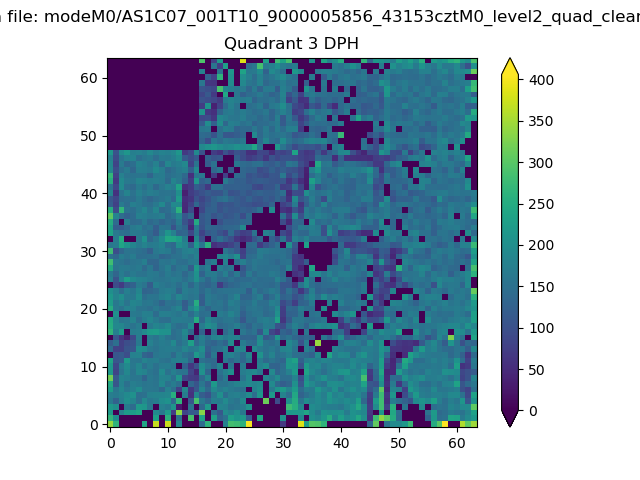 |
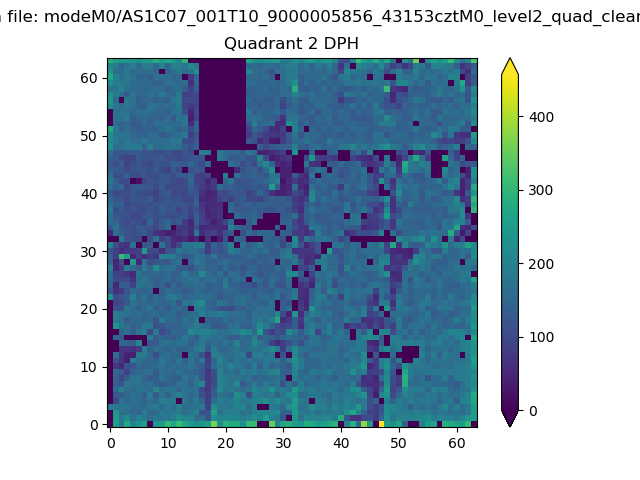 |
Quadrant C |
| Plot type | Count rate plots | Images |
|---|---|---|
| Comparison with Poisson distribution Blue bars denote a histogram of data divided into 1 sec bins. Red curve is a Poisson curve with rate = median count rate of data. |
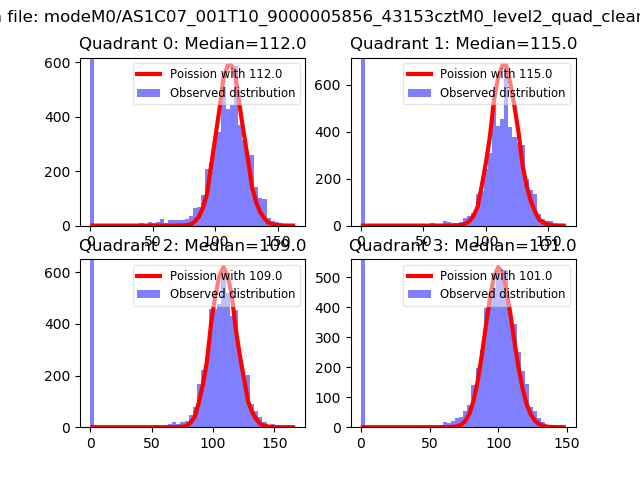 |
 |
| Quadrant-wise count rates Data is divided into 100 sec bins |
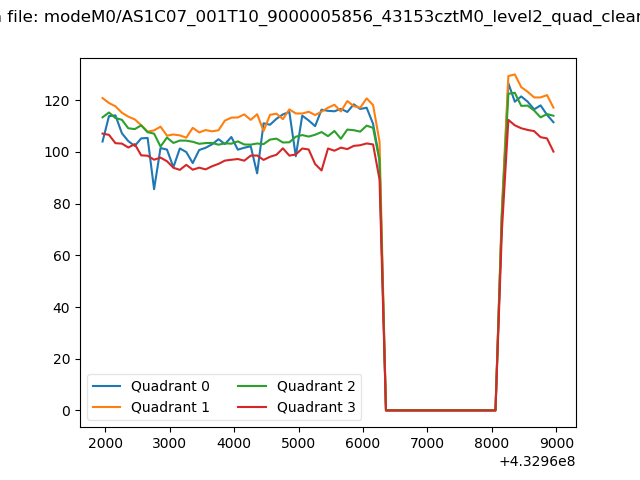 |
|
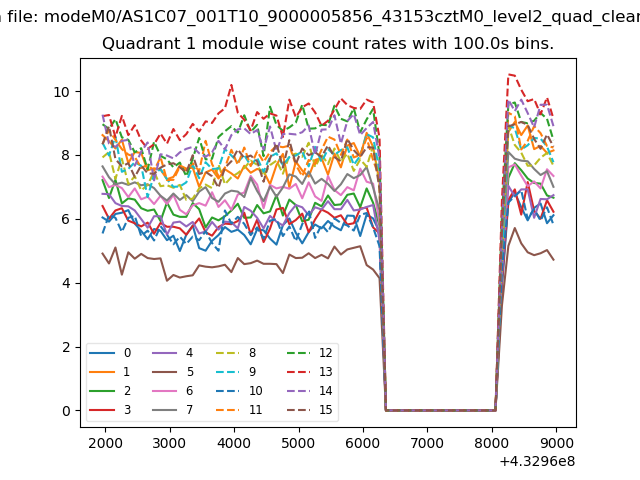
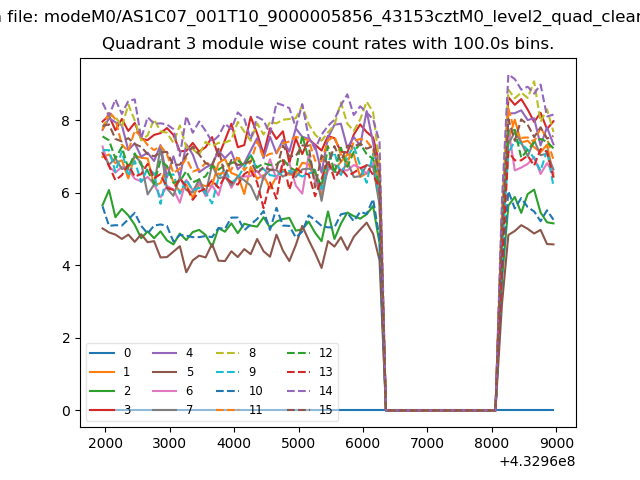
| Module-wise count rates for Quadrant A Data is divided into 100 sec bins |
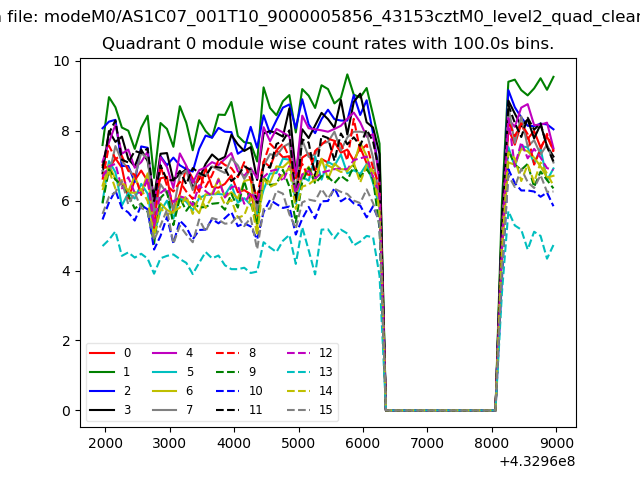 |
 |
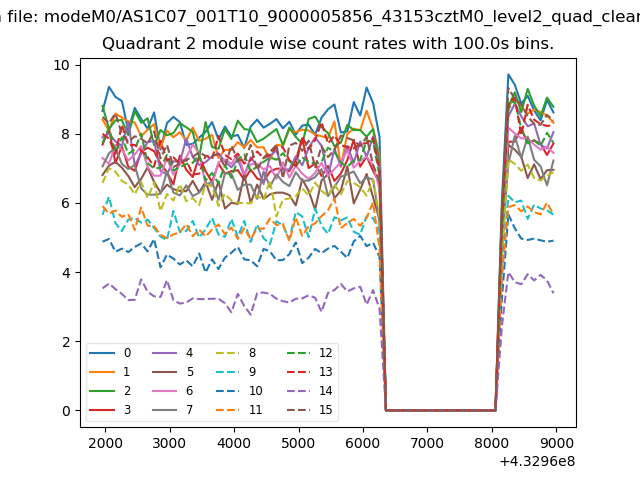
| Module-wise count rates for Quadrant B Data is divided into 100 sec bins |
 |
 |
| Module-wise count rates for Quadrant C Data is divided into 100 sec bins |
 |
 |
| Module-wise count rates for Quadrant D Data is divided into 100 sec bins |
 |
 |
| Parameter | Plot |
|---|---|
| CZT HV Monitor | 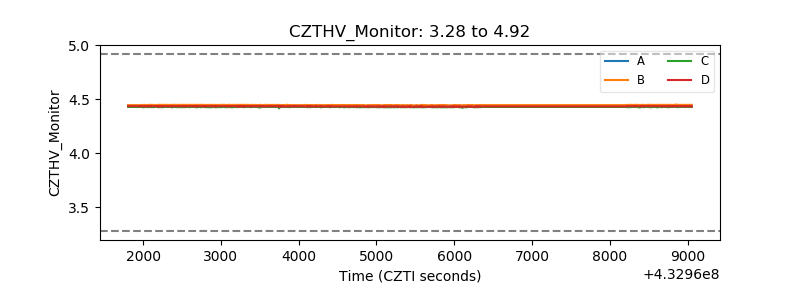 |
| D_VDD | 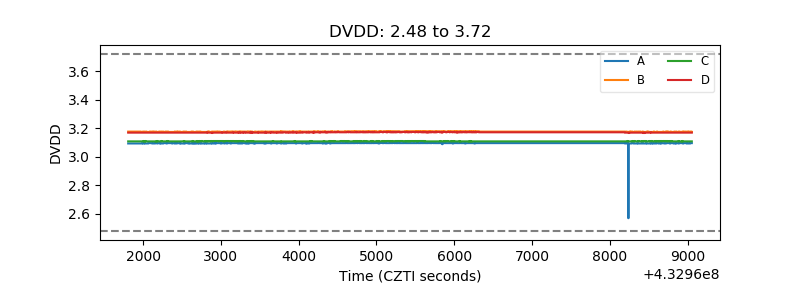 |
| Temperature 1 | 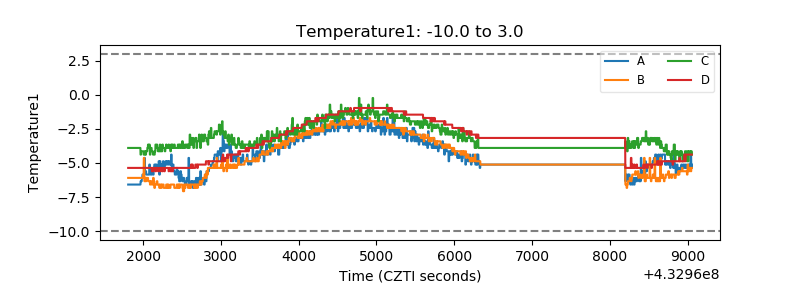 |
| Veto HV Monitor | 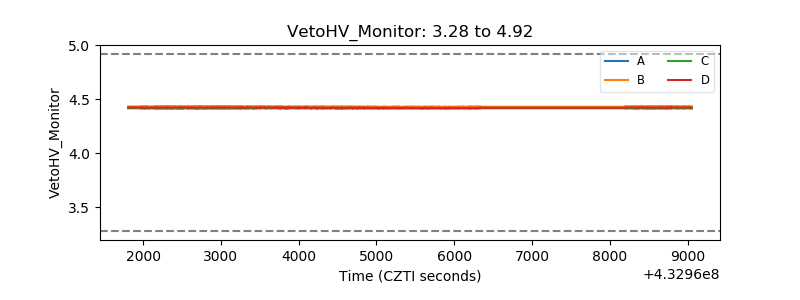 |
| Veto LLD | 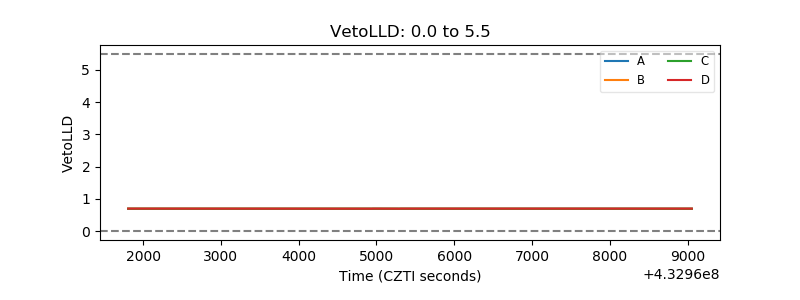 |
| Alpha Counter | 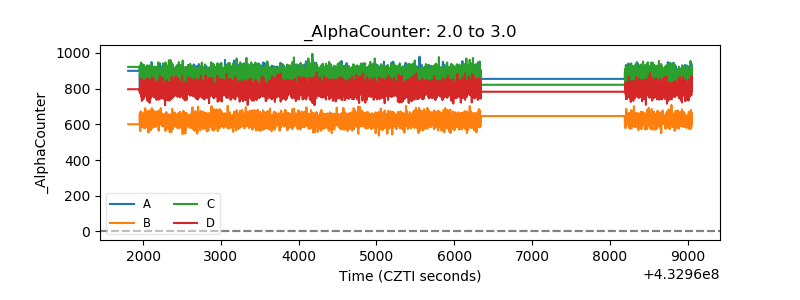 |
| _CPM_Rate | 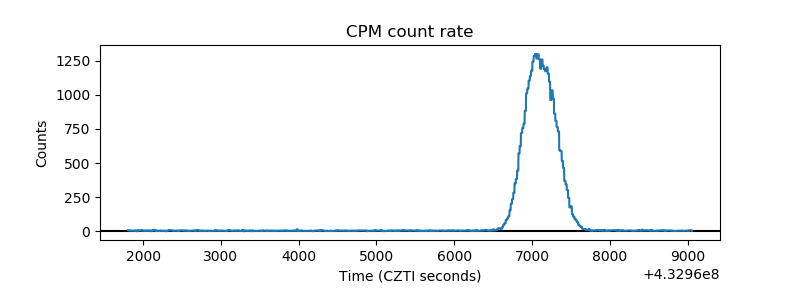 |
| CZT Counter | 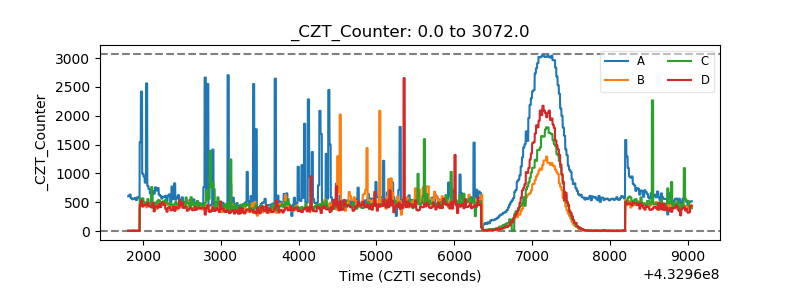 |
| +2.5 Volts monitor | 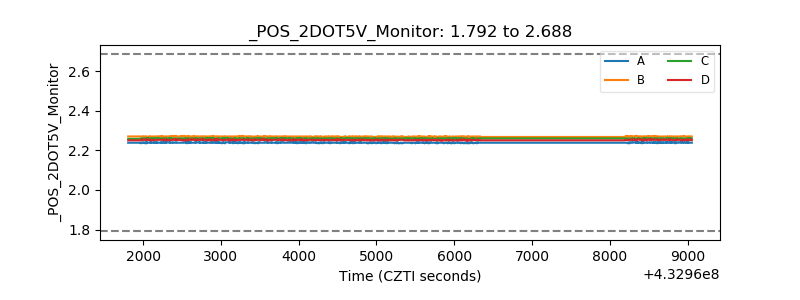 |
| +5 Volts monitor | 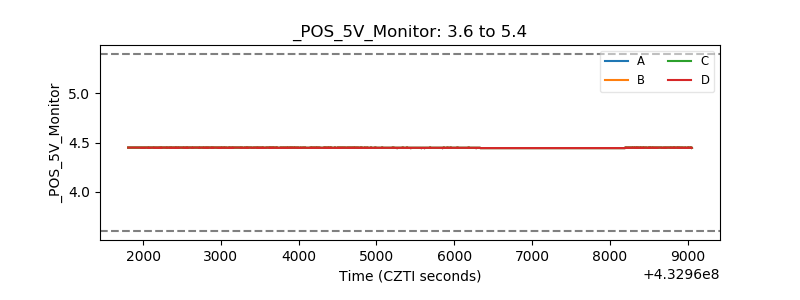 |
| _ROLL_ROT | 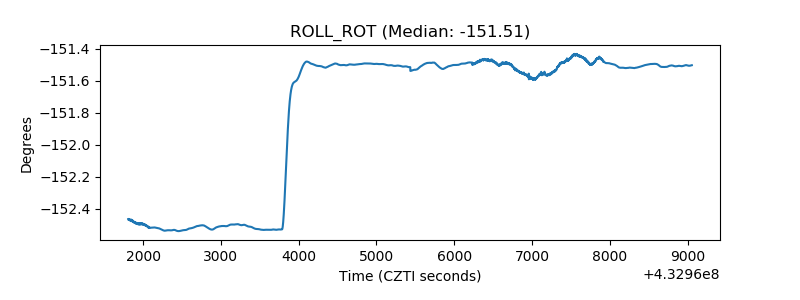 |
| _Roll_DEC | 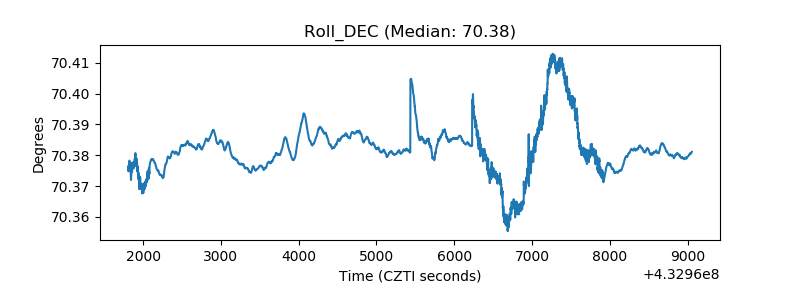 |
| _Roll_RA | 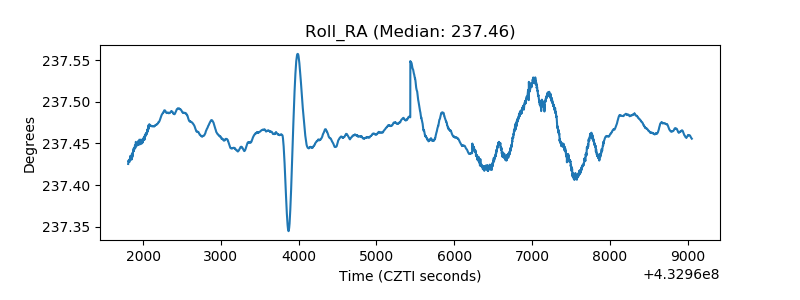 |
| Veto Counter | 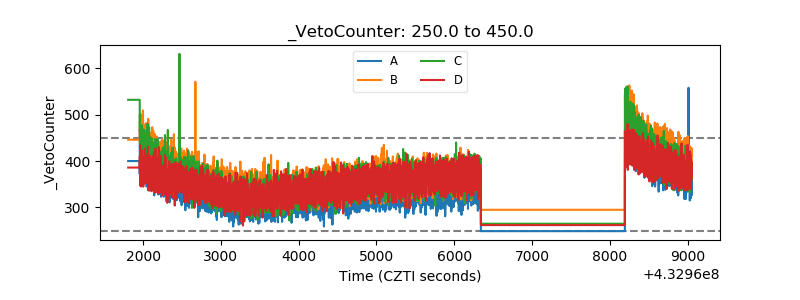 |