| Param | Original file | Final file |
|---|---|---|
| Filename | modeM0/AS1C07_001T10_9000005856_43154cztM0_level2.fits | modeM0/AS1C07_001T10_9000005856_43154cztM0_level2_quad_clean.evt |
| Size (bytes) | 291,821,760 | 87,531,840 |
| Size | 278.3 MB | 83.5 MB |
| Events in quadrant A | 3,039,991 | 592,208 |
| Events in quadrant B | 2,298,042 | 613,425 |
| Events in quadrant C | 2,413,768 | 565,948 |
| Events in quadrant D | 2,655,414 | 523,837 |
| Mode M9 | |||
|---|---|---|---|
| Quadrant | BADHDUFLAG | Total packets | Discarded packets |
| A | 0 | 26 | 0 |
| B | 0 | 27 | 0 |
| C | 0 | 27 | 0 |
| D | 0 | 27 | 0 |
| Mode SS | |||
|---|---|---|---|
| Quadrant | BADHDUFLAG | Total packets | Discarded packets |
| A | 0 | 104 | 0 |
| B | 0 | 104 | 0 |
| C | 0 | 104 | 0 |
| D | 0 | 104 | 0 |
| Mode M0 | |||
|---|---|---|---|
| Quadrant | BADHDUFLAG | Total packets | Discarded packets |
| A | 0 | 11990 | 2 |
| B | 0 | 10278 | 2 |
| C | 0 | 10403 | 2 |
| D | 0 | 11654 | 2 |
| Quadrant | Total seconds | Saturated seconds | Saturation percentage |
|---|---|---|---|
| A | 5064 | 64 | 1.263823% |
| B | 5064 | 4 | 0.078989% |
| C | 5064 | 7 | 0.138231% |
| D | 5064 | 101 | 1.994471% |
Noise dominated data is calculated using 1-second bins in cleaned event files. If a bin has >2000 counts, and if more than 50% of those come from <1% of pixels, then it is considered to be noise-dominated and hence unusable.
| Quadrant | # 1 sec bins | Bins with >0 counts | Bins with >2000 counts | High rate bins dominated by noise | Noise dominated (total time) | Noise dominated (detector-on time) | Marked lightcurve |
|---|---|---|---|---|---|---|---|
| A | 7036 | 5065 | 44 | 44 | 0.63% | 0.87% | 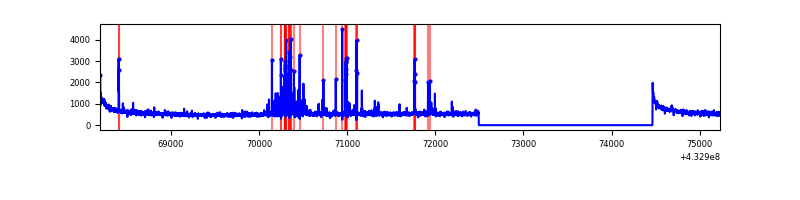 |
| B | 7036 | 5065 | 0 | 0 | 0.00% | 0.00% | 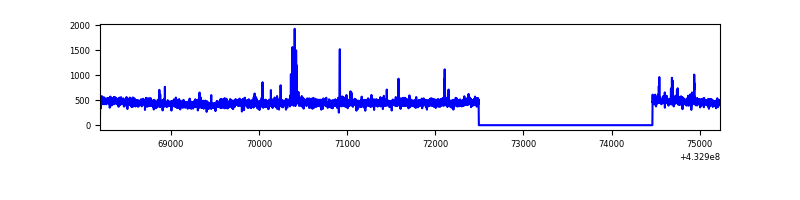 |
| C | 7036 | 5065 | 5 | 5 | 0.07% | 0.10% | 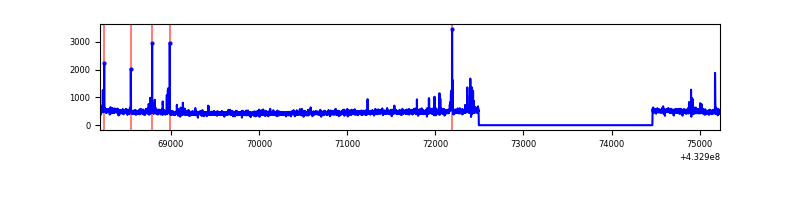 |
| D | 7036 | 5065 | 85 | 85 | 1.21% | 1.68% | 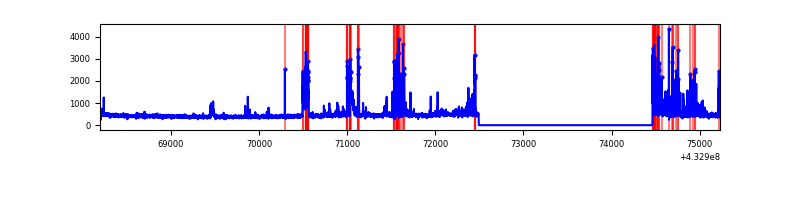 |
Top three noisy pixels from each quadrant. If the there are fewer than three noisy pixels in the level2.evt file, extra rows are filled as -1
| Pixel properties | Quadrant properties | ||||||
|---|---|---|---|---|---|---|---|
| Quadrant | DetID | PixID | Counts | Sigma | Mean | Median | Sigma |
| A | 10 | 83 | 568312 | 4988.81 | 560 | 551 | 113.8 |
| A | 15 | 237 | 238745 | 2092.96 | 560 | 551 | 113.8 |
| A | 15 | 222 | 42867 | 371.82 | 560 | 551 | 113.8 |
| B | 0 | 229 | 35175 | 327.3 | 557 | 543 | 105.8 |
| B | 5 | 172 | 23192 | 214.05 | 557 | 543 | 105.8 |
| B | 0 | 189 | 17095 | 156.43 | 557 | 543 | 105.8 |
| C | 15 | 214 | 227649 | 1825.31 | 536 | 538 | 124.4 |
| C | 14 | 254 | 90915 | 726.37 | 536 | 538 | 124.4 |
| C | 12 | 2 | 4485 | 31.72 | 536 | 538 | 124.4 |
| D | 1 | 52 | 248949 | 1899.38 | 539 | 523 | 130.8 |
| D | 13 | 249 | 194030 | 1479.49 | 539 | 523 | 130.8 |
| D | 1 | 47 | 83094 | 631.31 | 539 | 523 | 130.8 |
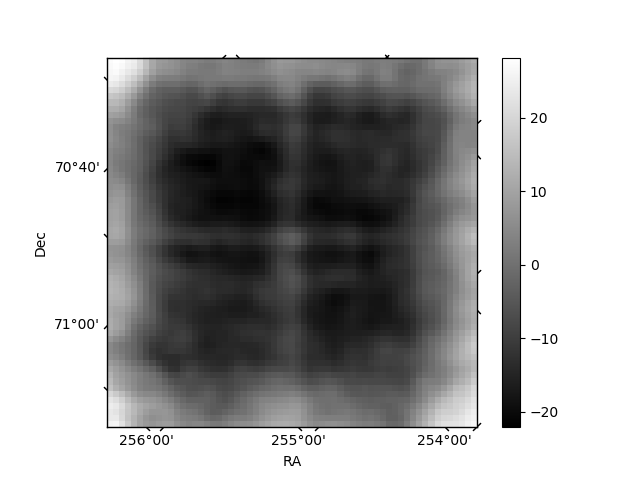
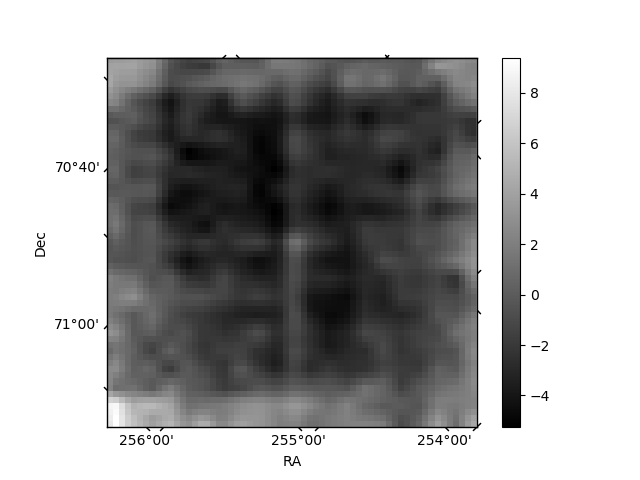
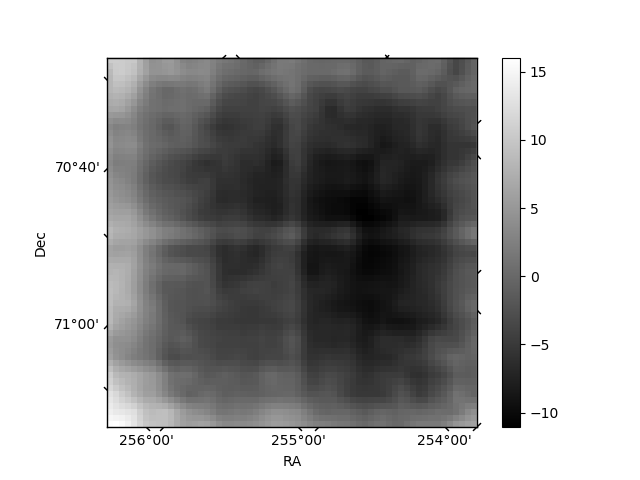
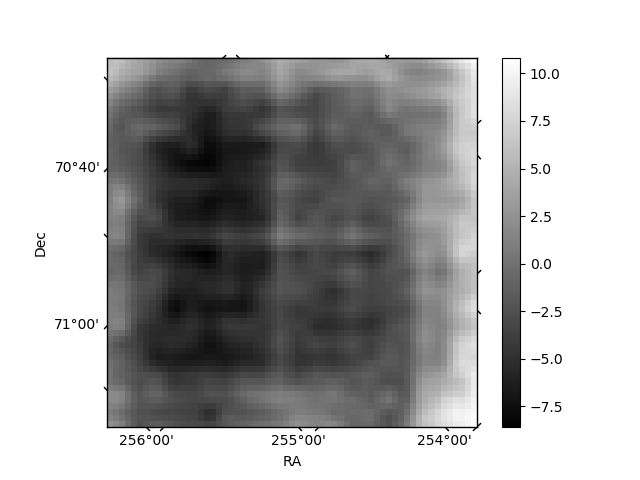
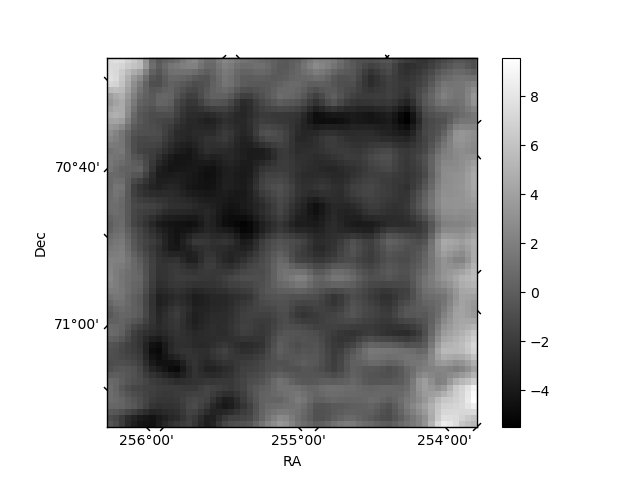
Histogram calculated using DETX and DETY for each event in the final _common_clean file
| Quadrant A | 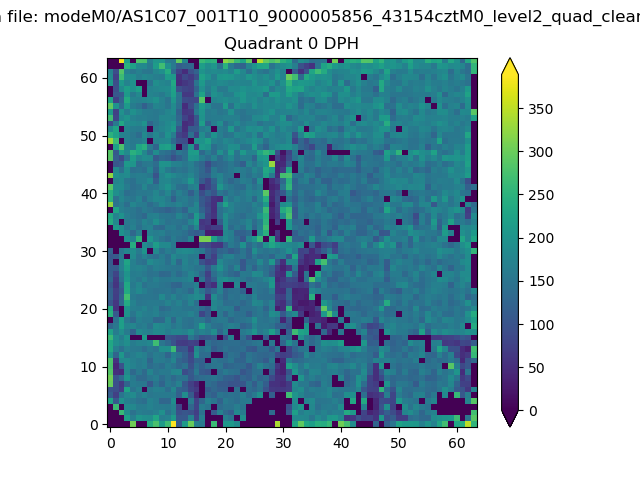 |
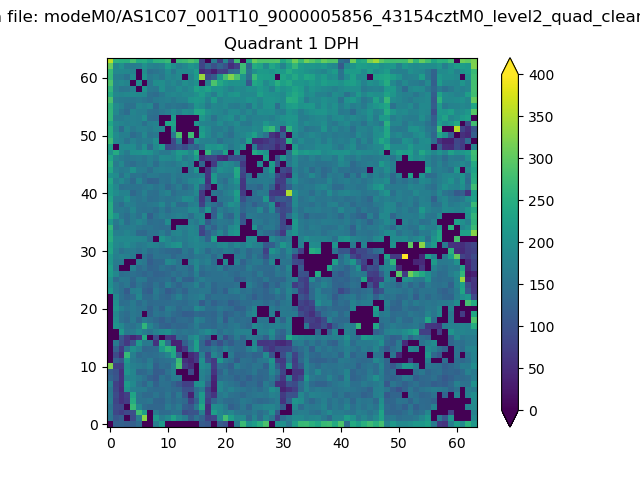 |
Quadrant B |
|---|---|---|---|
| Quadrant D | 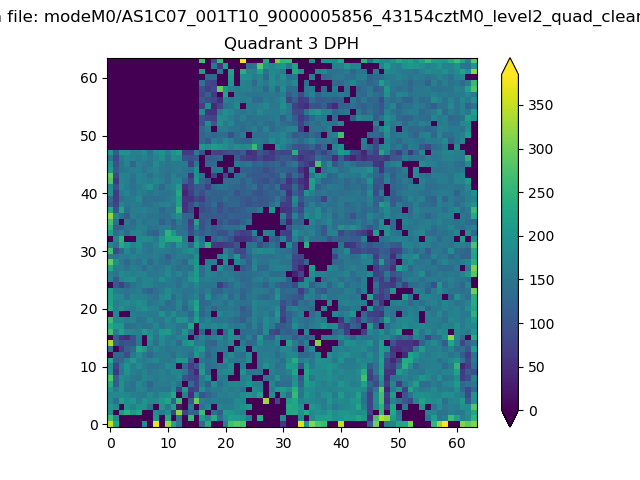 |
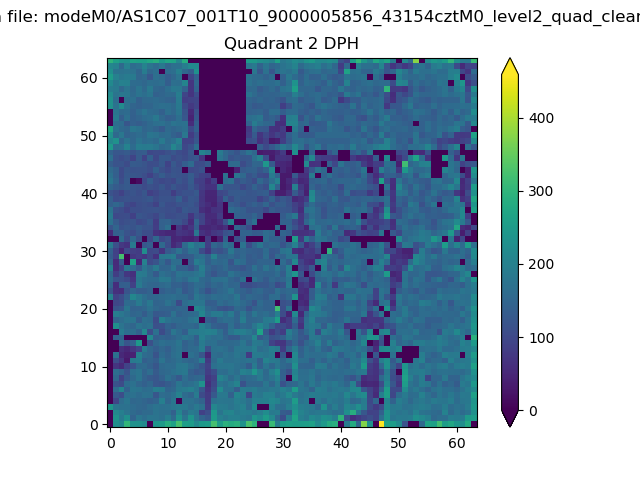 |
Quadrant C |
| Plot type | Count rate plots | Images |
|---|---|---|
| Comparison with Poisson distribution Blue bars denote a histogram of data divided into 1 sec bins. Red curve is a Poisson curve with rate = median count rate of data. |
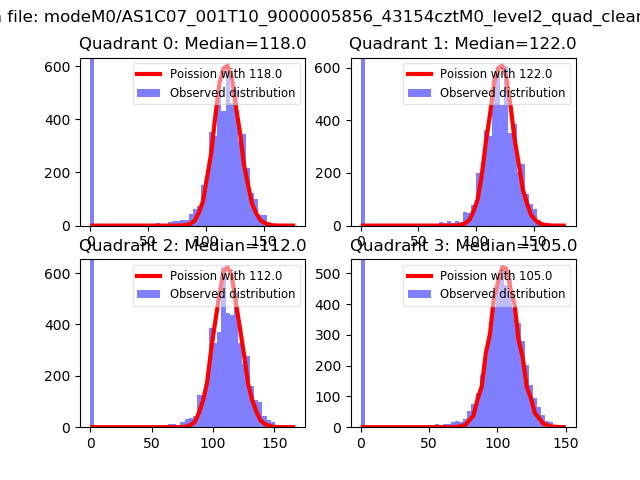 |
 |
| Quadrant-wise count rates Data is divided into 100 sec bins |
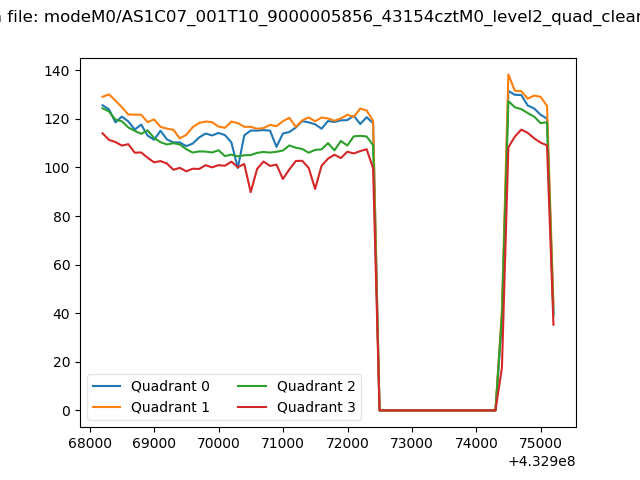 |
|
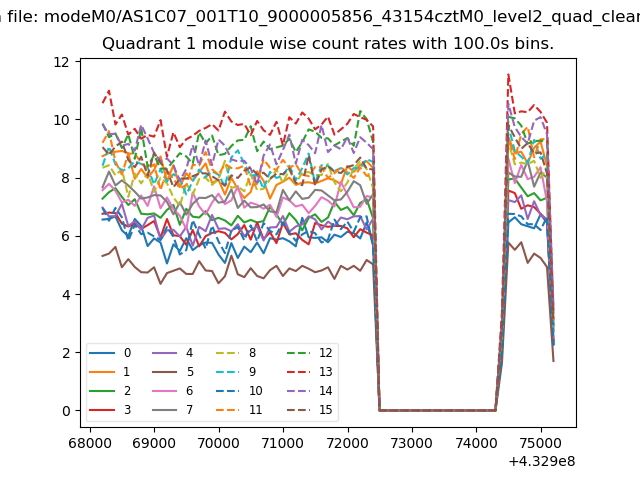
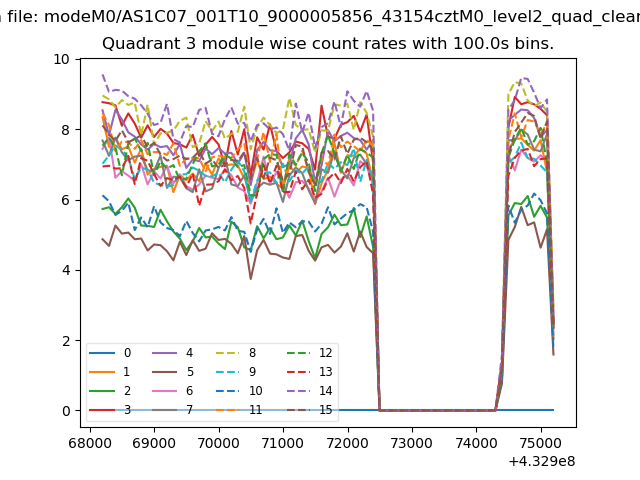
| Module-wise count rates for Quadrant A Data is divided into 100 sec bins |
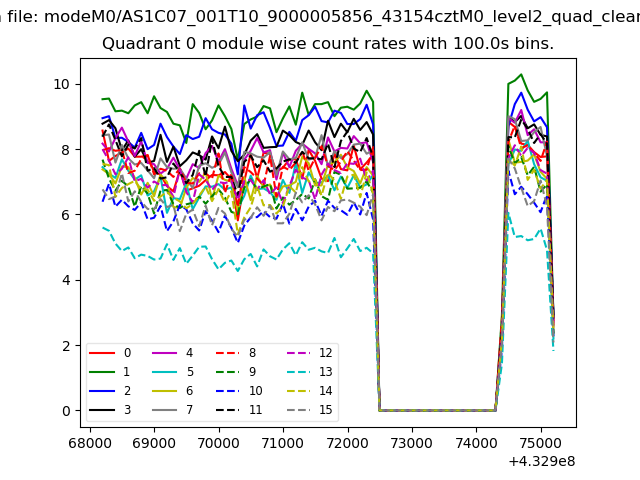 |
 |
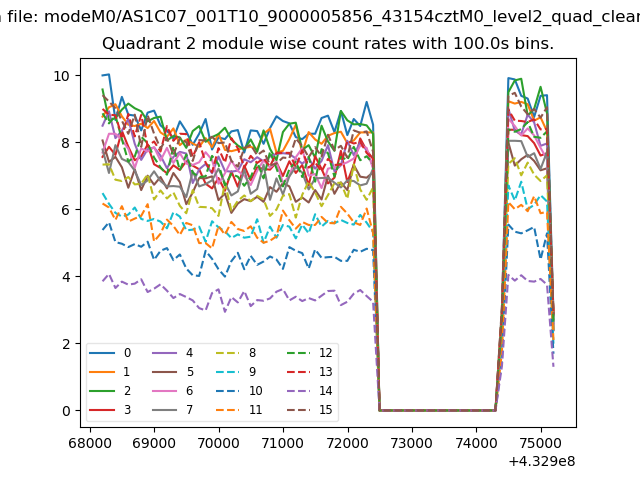
| Module-wise count rates for Quadrant B Data is divided into 100 sec bins |
 |
 |
| Module-wise count rates for Quadrant C Data is divided into 100 sec bins |
 |
 |
| Module-wise count rates for Quadrant D Data is divided into 100 sec bins |
 |
 |
| Parameter | Plot |
|---|---|
| CZT HV Monitor | 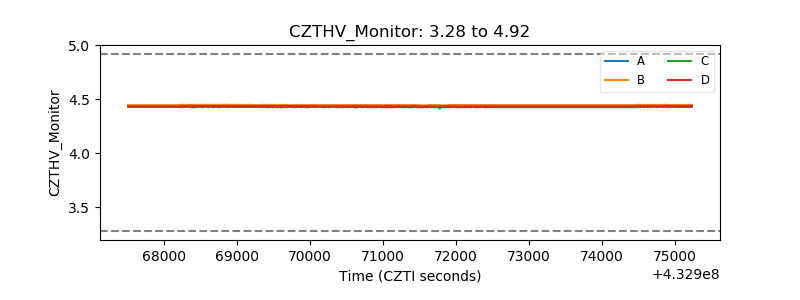 |
| D_VDD | 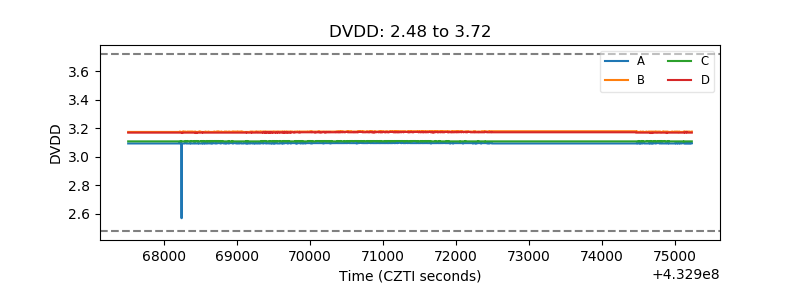 |
| Temperature 1 | 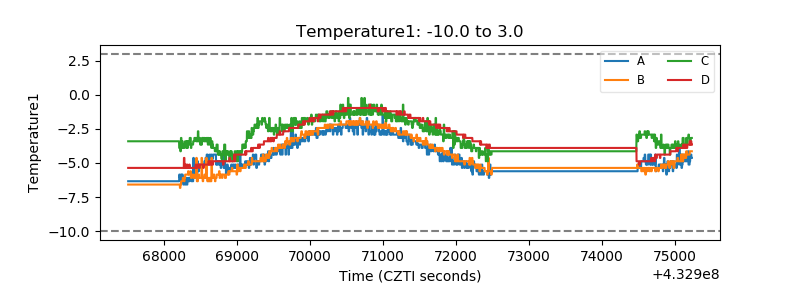 |
| Veto HV Monitor | 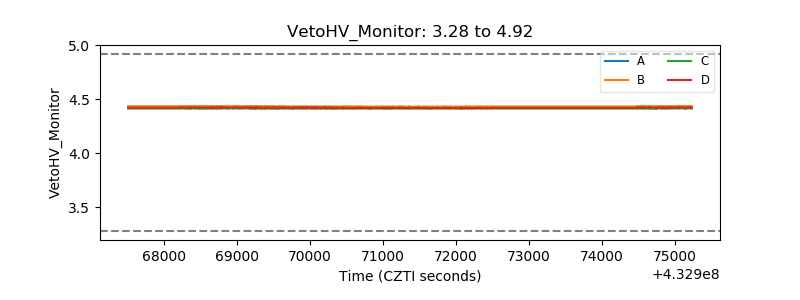 |
| Veto LLD | 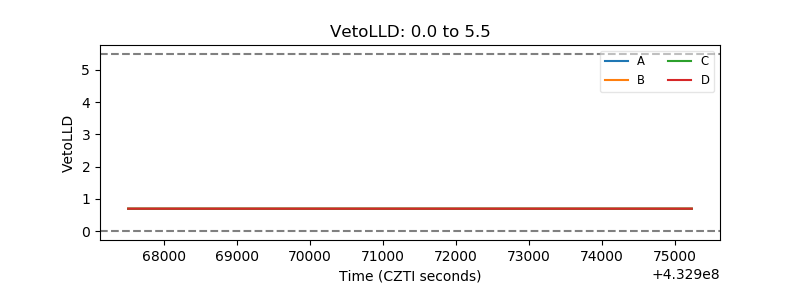 |
| Alpha Counter | 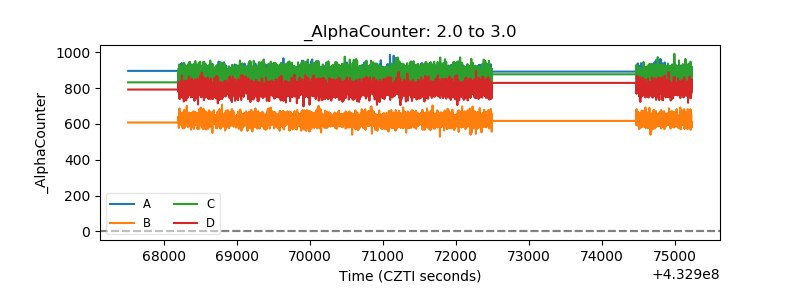 |
| _CPM_Rate | 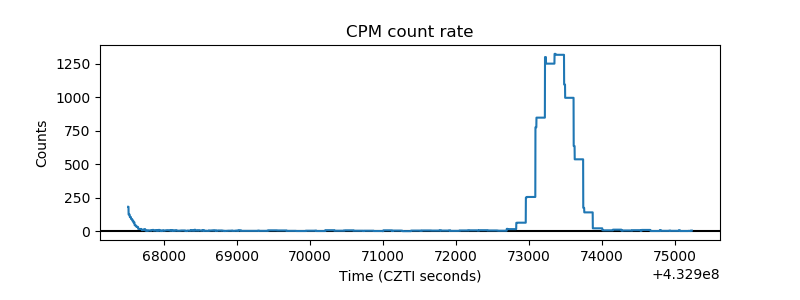 |
| CZT Counter | 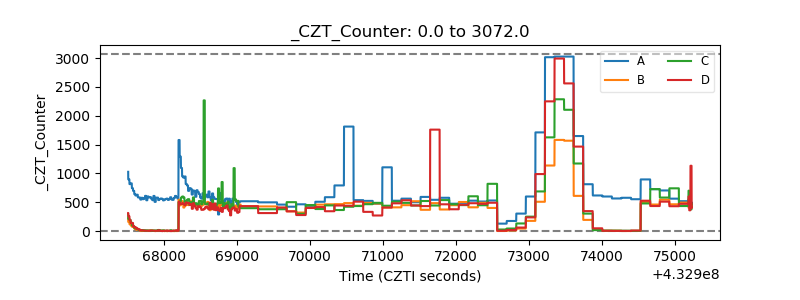 |
| +2.5 Volts monitor | 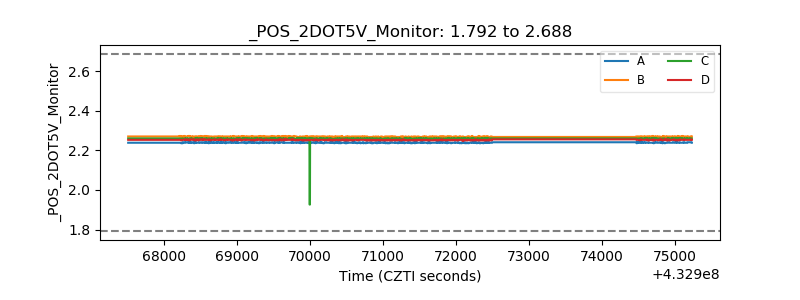 |
| +5 Volts monitor | 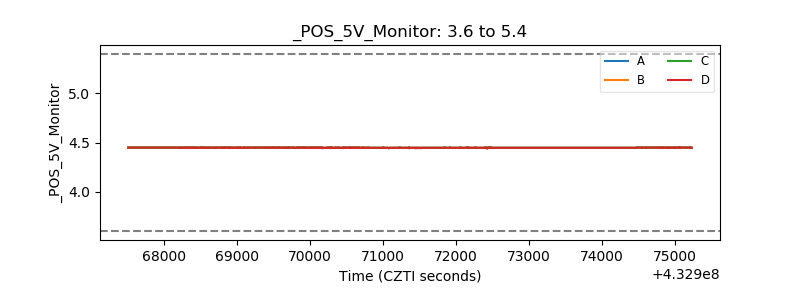 |
| _ROLL_ROT | 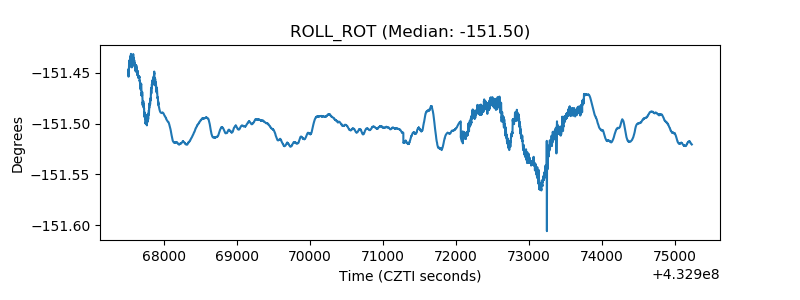 |
| _Roll_DEC | 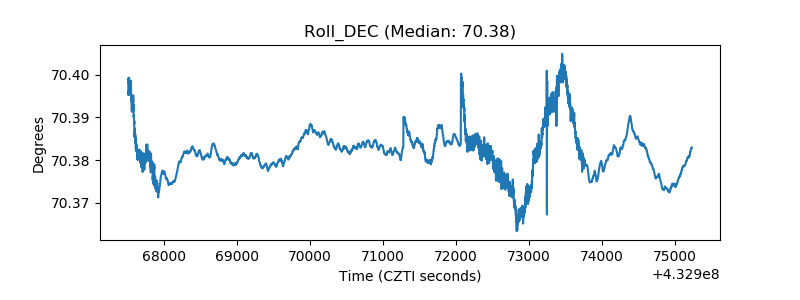 |
| _Roll_RA | 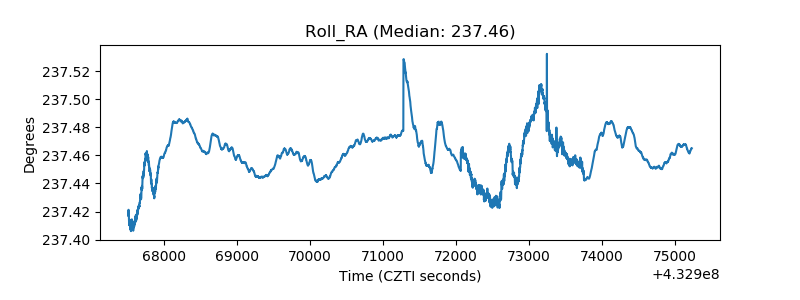 |
| Veto Counter |  |