| Param | Original file | Final file |
|---|---|---|
| Filename | modeM0/AS1C07_001T10_9000005856_43156cztM0_level2.fits | modeM0/AS1C07_001T10_9000005856_43156cztM0_level2_quad_clean.evt |
| Size (bytes) | 313,842,240 | 86,281,920 |
| Size | 299.3 MB | 82.3 MB |
| Events in quadrant A | 3,607,431 | 584,163 |
| Events in quadrant B | 2,369,289 | 604,880 |
| Events in quadrant C | 2,419,561 | 556,024 |
| Events in quadrant D | 2,837,018 | 521,822 |
| Mode M9 | |||
|---|---|---|---|
| Quadrant | BADHDUFLAG | Total packets | Discarded packets |
| A | 0 | 17 | 0 |
| B | 0 | 18 | 0 |
| C | 0 | 18 | 0 |
| D | 0 | 18 | 0 |
| Mode SS | |||
|---|---|---|---|
| Quadrant | BADHDUFLAG | Total packets | Discarded packets |
| A | 0 | 100 | 0 |
| B | 0 | 100 | 0 |
| C | 0 | 100 | 0 |
| D | 0 | 100 | 0 |
| Mode M0 | |||
|---|---|---|---|
| Quadrant | BADHDUFLAG | Total packets | Discarded packets |
| A | 0 | 13809 | 13 |
| B | 0 | 10353 | 19 |
| C | 0 | 10349 | 14 |
| D | 0 | 11922 | 30 |
| Quadrant | Total seconds | Saturated seconds | Saturation percentage |
|---|---|---|---|
| A | 4929 | 203 | 4.118482% |
| B | 4924 | 30 | 0.609261% |
| C | 4927 | 9 | 0.182667% |
| D | 4926 | 85 | 1.725538% |
Noise dominated data is calculated using 1-second bins in cleaned event files. If a bin has >2000 counts, and if more than 50% of those come from <1% of pixels, then it is considered to be noise-dominated and hence unusable.
| Quadrant | # 1 sec bins | Bins with >0 counts | Bins with >2000 counts | High rate bins dominated by noise | Noise dominated (total time) | Noise dominated (detector-on time) | Marked lightcurve |
|---|---|---|---|---|---|---|---|
| A | 7086 | 4931 | 143 | 143 | 2.02% | 2.90% | 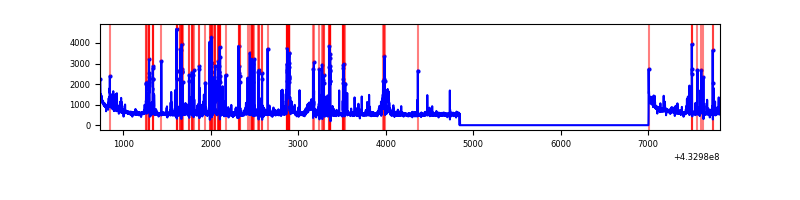 |
| B | 7086 | 4927 | 19 | 19 | 0.27% | 0.39% | 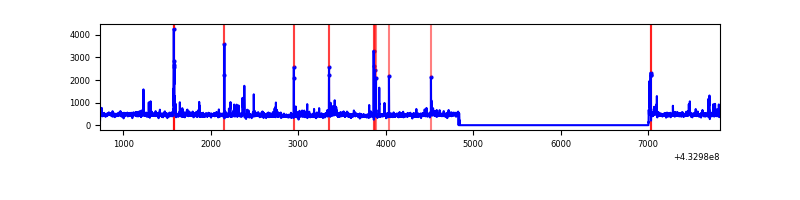 |
| C | 7086 | 4929 | 8 | 8 | 0.11% | 0.16% | 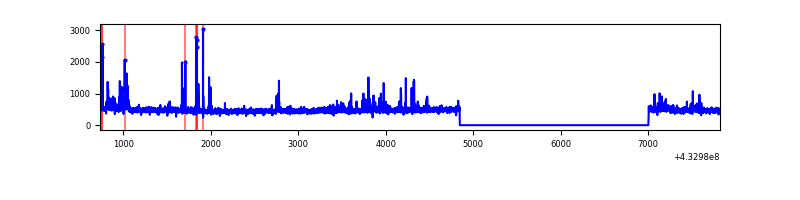 |
| D | 7086 | 4928 | 73 | 73 | 1.03% | 1.48% | 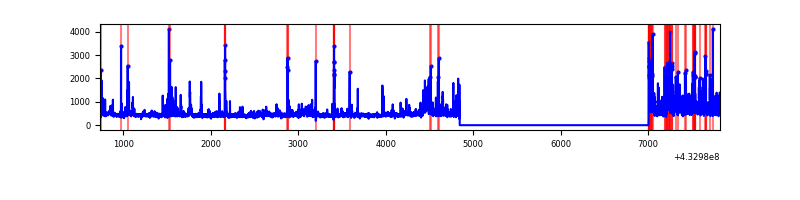 |
Top three noisy pixels from each quadrant. If the there are fewer than three noisy pixels in the level2.evt file, extra rows are filled as -1
| Pixel properties | Quadrant properties | ||||||
|---|---|---|---|---|---|---|---|
| Quadrant | DetID | PixID | Counts | Sigma | Mean | Median | Sigma |
| A | 15 | 237 | 654920 | 5900.24 | 543 | 532 | 110.9 |
| A | 10 | 83 | 571447 | 5147.61 | 543 | 532 | 110.9 |
| A | 15 | 222 | 212065 | 1907.27 | 543 | 532 | 110.9 |
| B | 5 | 255 | 125770 | 1209.35 | 540 | 525 | 103.6 |
| B | 0 | 229 | 27340 | 258.92 | 540 | 525 | 103.6 |
| B | 5 | 172 | 22198 | 209.27 | 540 | 525 | 103.6 |
| C | 15 | 214 | 221559 | 1841.47 | 521 | 525 | 120.0 |
| C | 14 | 254 | 89986 | 745.31 | 521 | 525 | 120.0 |
| C | 0 | 239 | 71300 | 589.64 | 521 | 525 | 120.0 |
| D | 1 | 52 | 324048 | 2507.8 | 531 | 516 | 129.0 |
| D | 12 | 16 | 155575 | 1201.91 | 531 | 516 | 129.0 |
| D | 13 | 249 | 127587 | 984.97 | 531 | 516 | 129.0 |
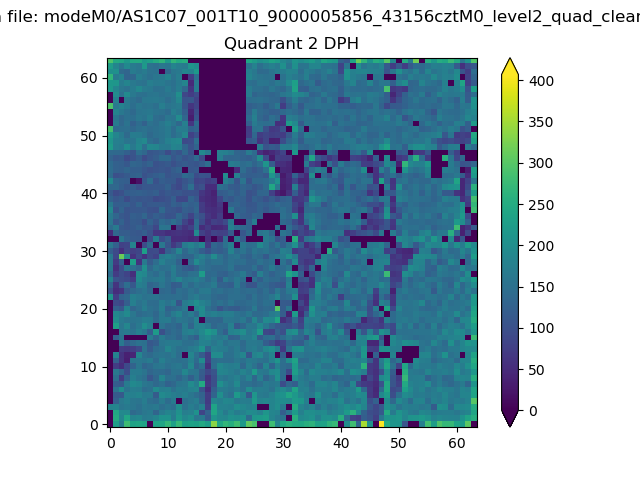
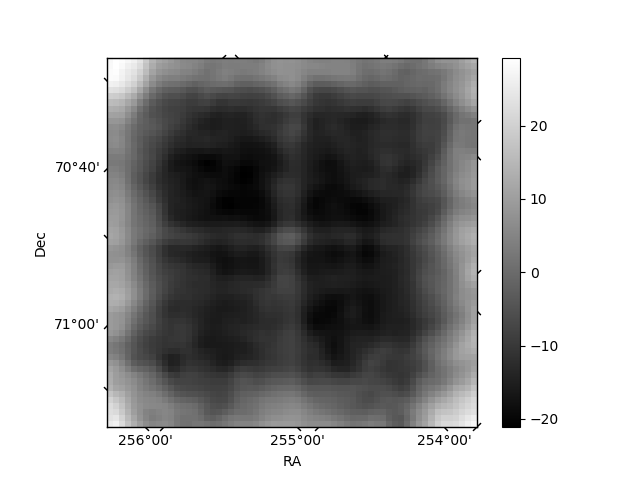
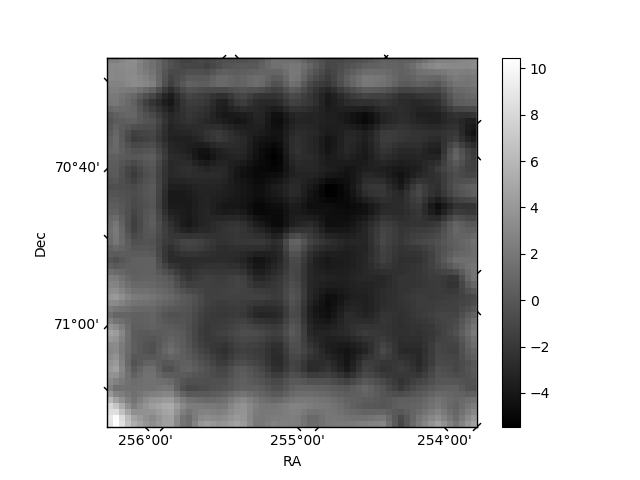
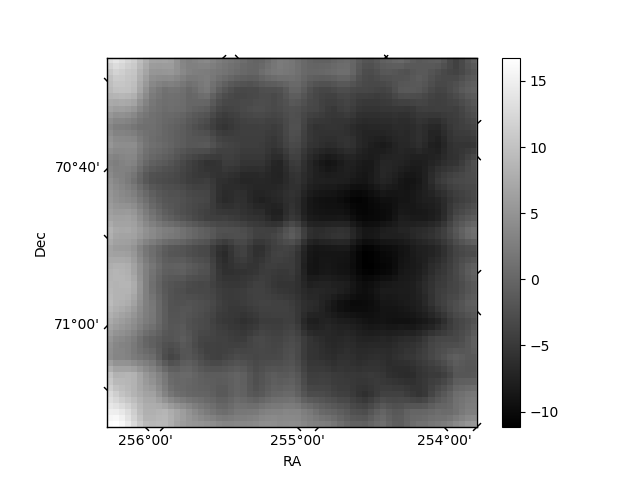
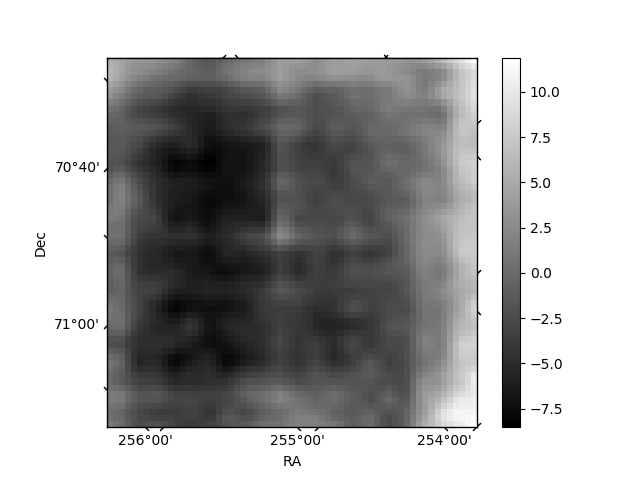
Histogram calculated using DETX and DETY for each event in the final _common_clean file
| Quadrant A | 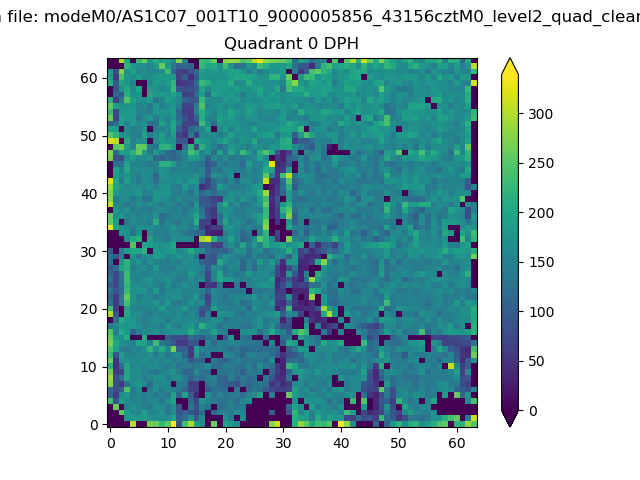 |
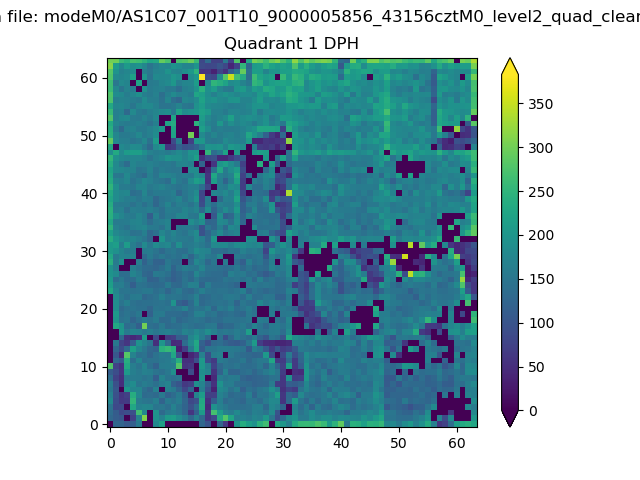 |
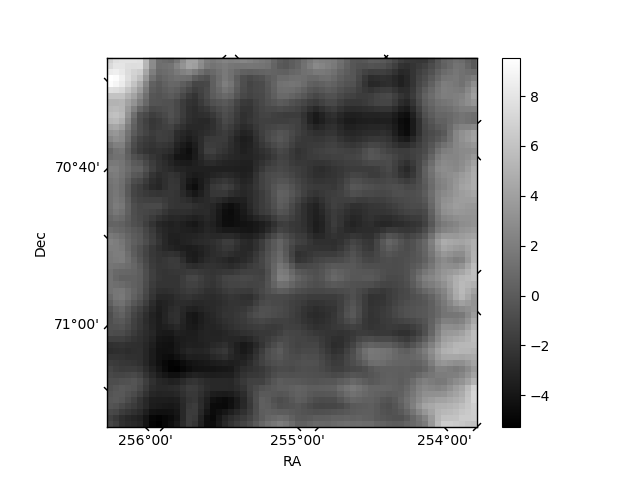
Quadrant B |
|---|---|---|---|
| Quadrant D | 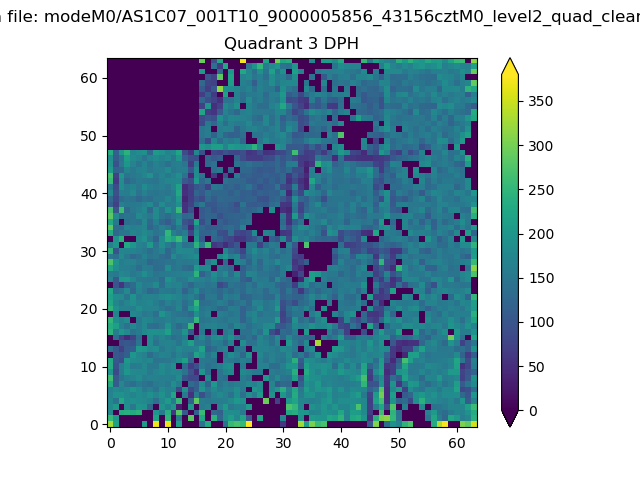 |
 |
Quadrant C |
| Plot type | Count rate plots | Images |
|---|---|---|
| Comparison with Poisson distribution Blue bars denote a histogram of data divided into 1 sec bins. Red curve is a Poisson curve with rate = median count rate of data. |
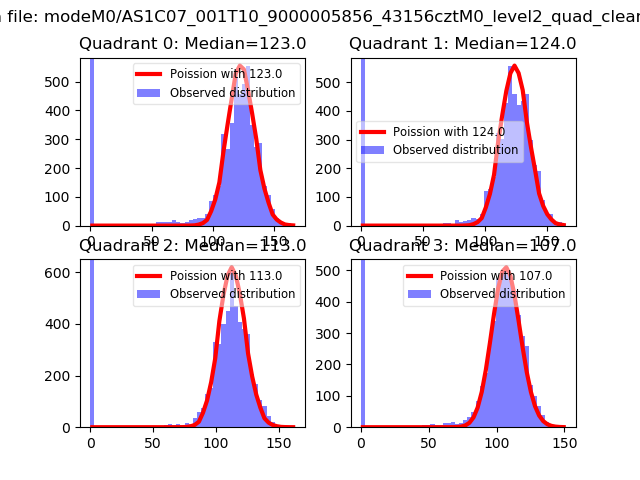 |
 |
| Quadrant-wise count rates Data is divided into 100 sec bins |
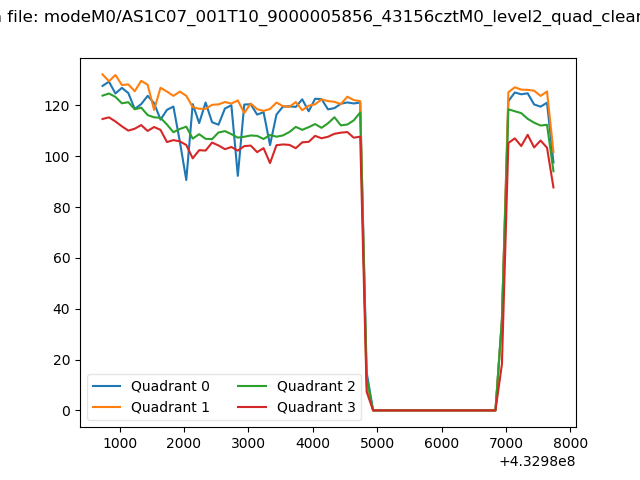 |
|
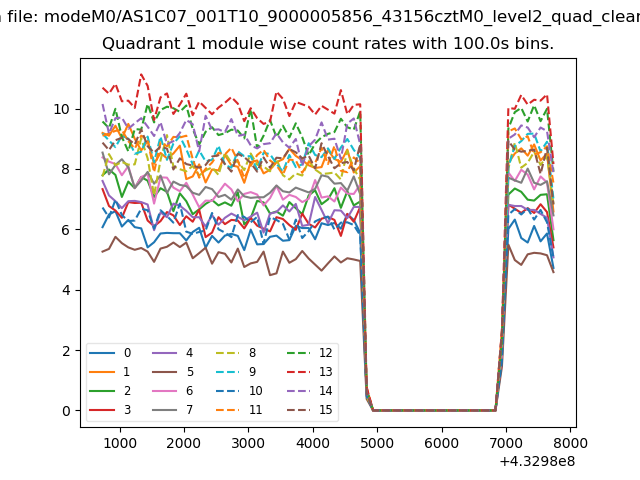
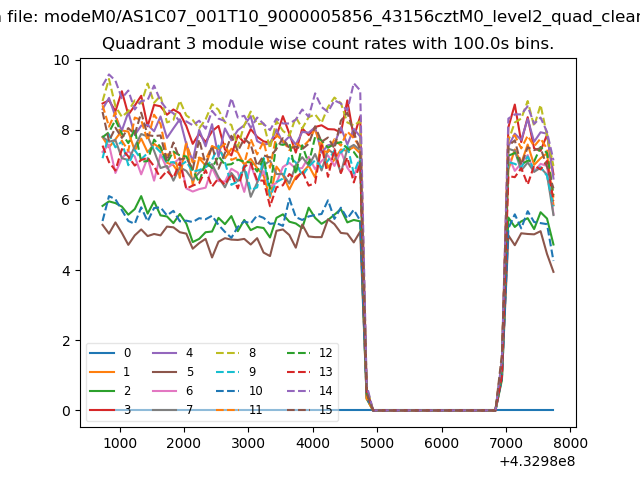
| Module-wise count rates for Quadrant A Data is divided into 100 sec bins |
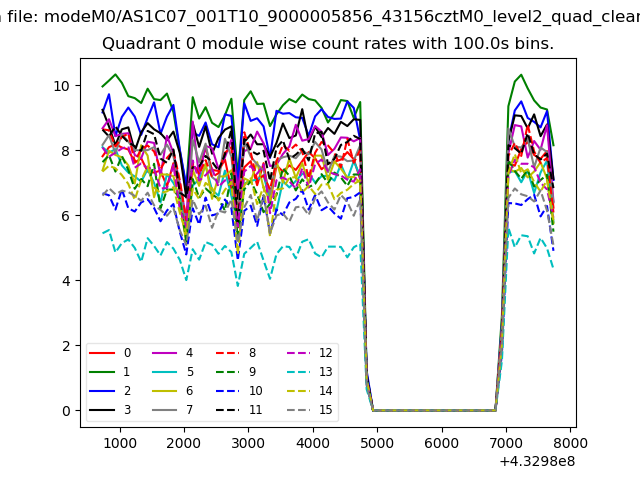 |
 |
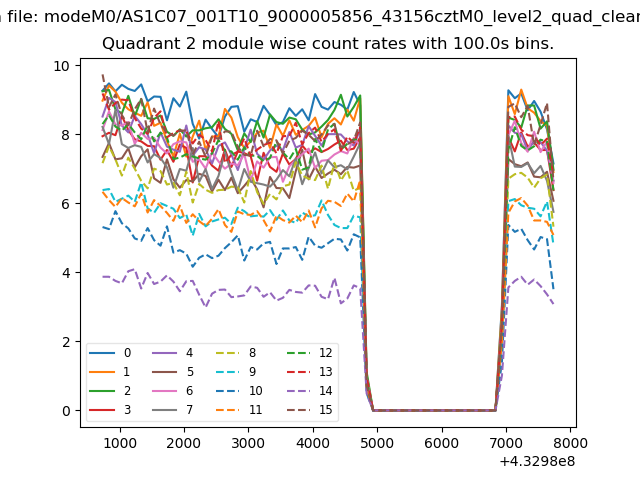
| Module-wise count rates for Quadrant B Data is divided into 100 sec bins |
 |
 |
| Module-wise count rates for Quadrant C Data is divided into 100 sec bins |
 |
 |
| Module-wise count rates for Quadrant D Data is divided into 100 sec bins |
 |
 |
| Parameter | Plot |
|---|---|
| CZT HV Monitor | 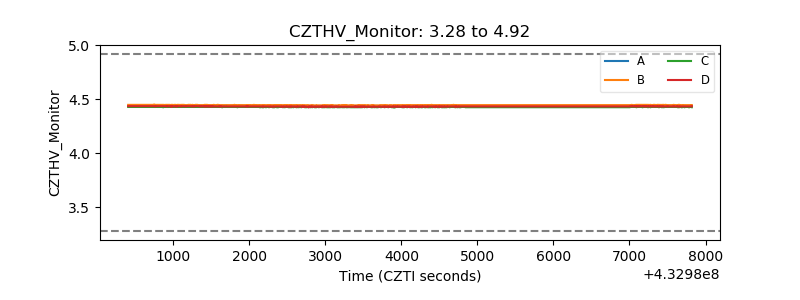 |
| D_VDD | 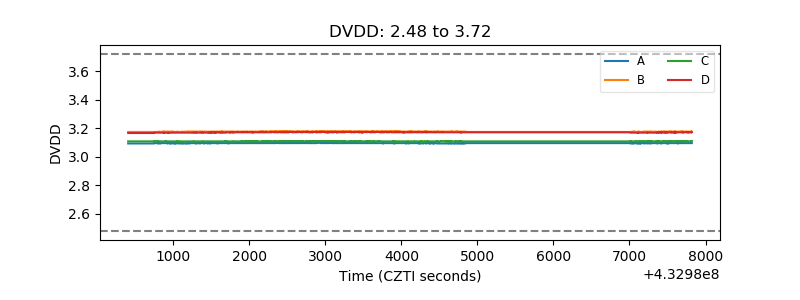 |
| Temperature 1 | 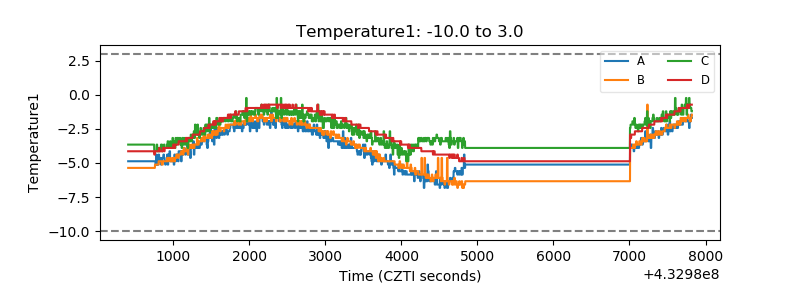 |
| Veto HV Monitor | 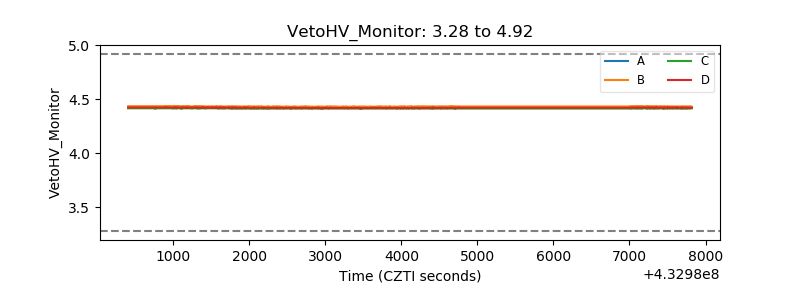 |
| Veto LLD | 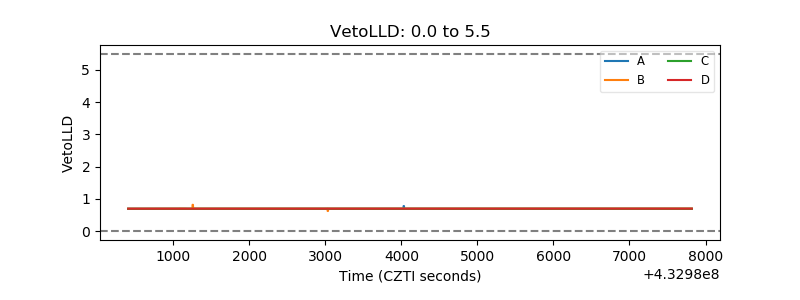 |
| Alpha Counter | 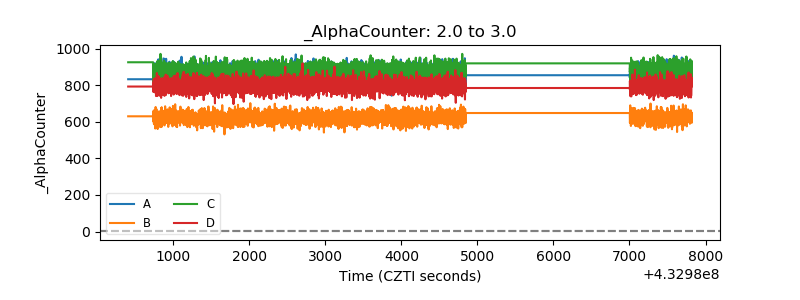 |
| _CPM_Rate | 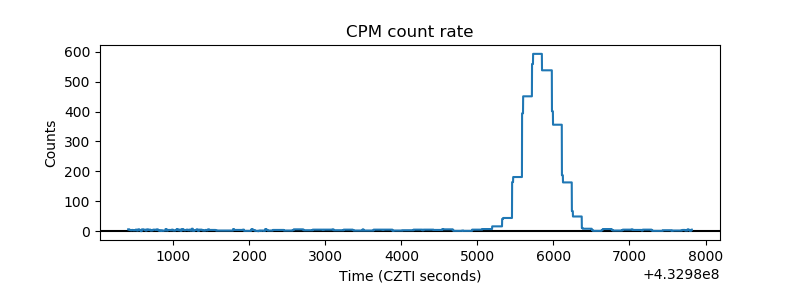 |
| CZT Counter | 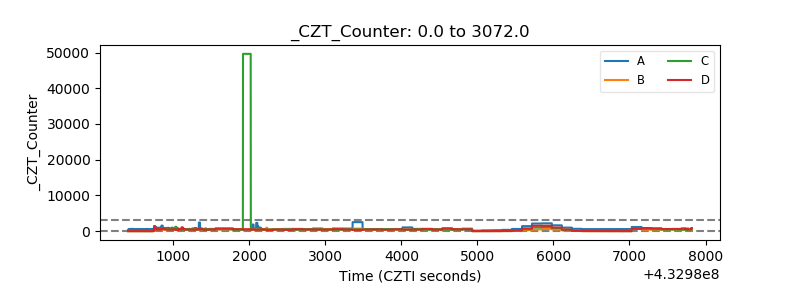 |
| +2.5 Volts monitor | 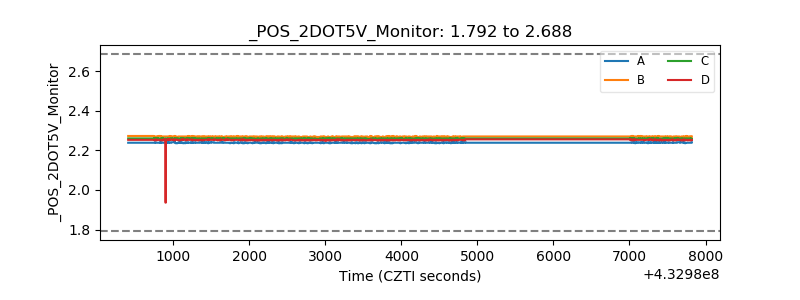 |
| +5 Volts monitor | 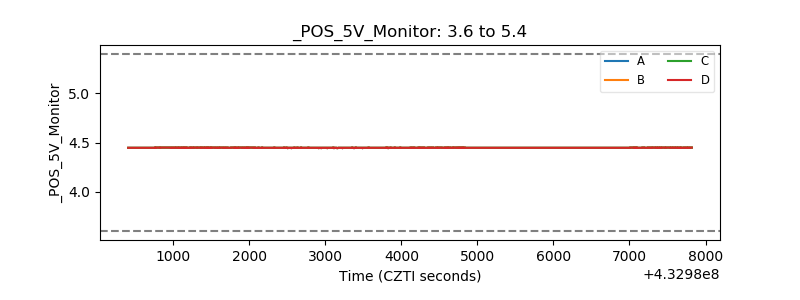 |
| _ROLL_ROT | 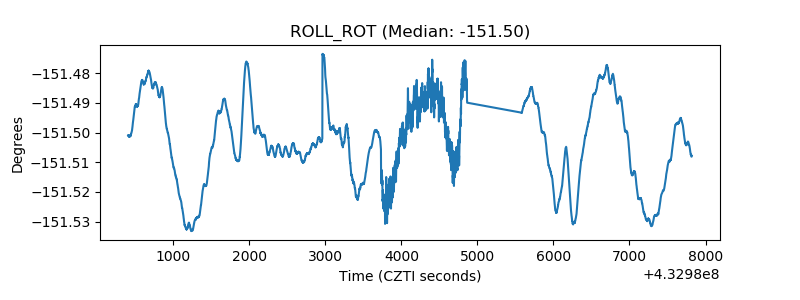 |
| _Roll_DEC | 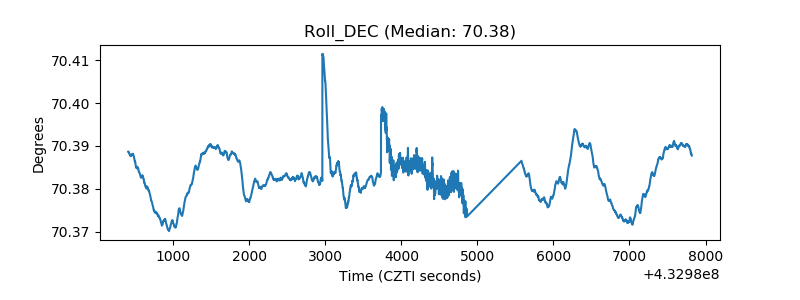 |
| _Roll_RA | 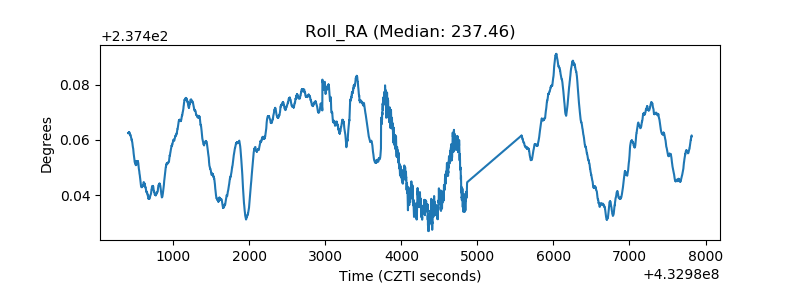 |
| Veto Counter | 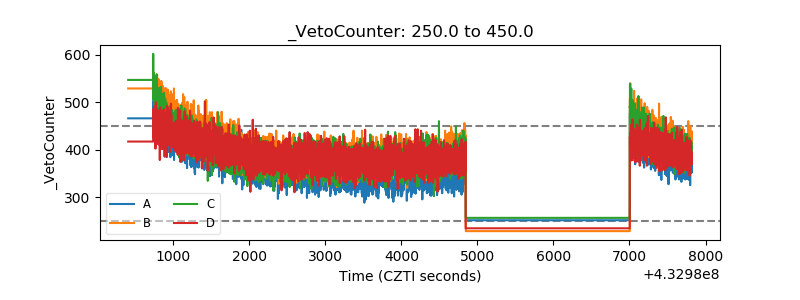 |