| Param | Original file | Final file |
|---|---|---|
| Filename | modeM0/AS1C07_001T10_9000005856_43157cztM0_level2.fits | modeM0/AS1C07_001T10_9000005856_43157cztM0_level2_quad_clean.evt |
| Size (bytes) | 390,548,160 | 79,329,600 |
| Size | 372.5 MB | 75.7 MB |
| Events in quadrant A | 3,630,502 | 555,615 |
| Events in quadrant B | 2,267,011 | 578,430 |
| Events in quadrant C | 2,331,256 | 528,353 |
| Events in quadrant D | 5,849,356 | 398,234 |
| Mode M9 | |||
|---|---|---|---|
| Quadrant | BADHDUFLAG | Total packets | Discarded packets |
| A | 0 | 24 | 1 |
| B | 0 | 25 | 1 |
| C | 0 | 24 | 0 |
| D | 0 | 26 | 2 |
| Mode SS | |||
|---|---|---|---|
| Quadrant | BADHDUFLAG | Total packets | Discarded packets |
| A | 0 | 100 | 0 |
| B | 0 | 100 | 0 |
| C | 0 | 100 | 0 |
| D | 0 | 100 | 0 |
| Mode M0 | |||
|---|---|---|---|
| Quadrant | BADHDUFLAG | Total packets | Discarded packets |
| A | 0 | 14033 | 44 |
| B | 0 | 10101 | 10 |
| C | 0 | 10090 | 22 |
| D | 0 | 20720 | 16 |
| Quadrant | Total seconds | Saturated seconds | Saturation percentage |
|---|---|---|---|
| A | 4858 | 194 | 3.993413% |
| B | 4869 | 16 | 0.328610% |
| C | 4861 | 12 | 0.246863% |
| D | 4868 | 1171 | 24.055053% |
Noise dominated data is calculated using 1-second bins in cleaned event files. If a bin has >2000 counts, and if more than 50% of those come from <1% of pixels, then it is considered to be noise-dominated and hence unusable.
| Quadrant | # 1 sec bins | Bins with >0 counts | Bins with >2000 counts | High rate bins dominated by noise | Noise dominated (total time) | Noise dominated (detector-on time) | Marked lightcurve |
|---|---|---|---|---|---|---|---|
| A | 6998 | 4870 | 148 | 148 | 2.11% | 3.04% | 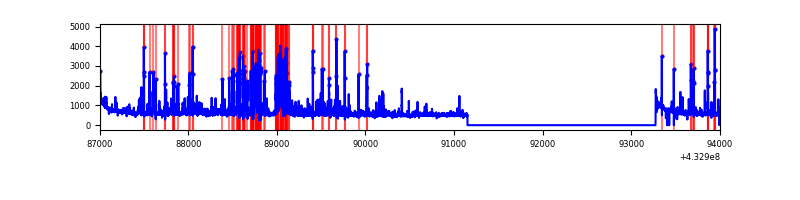 |
| B | 6998 | 4874 | 9 | 9 | 0.13% | 0.18% | 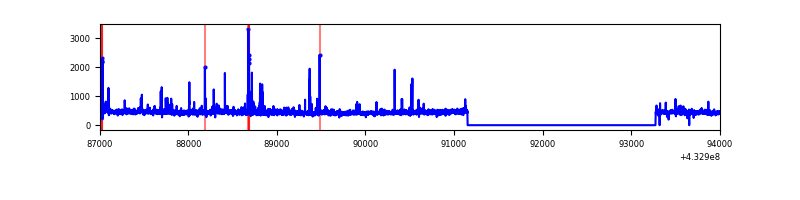 |
| C | 6998 | 4873 | 6 | 6 | 0.09% | 0.12% | 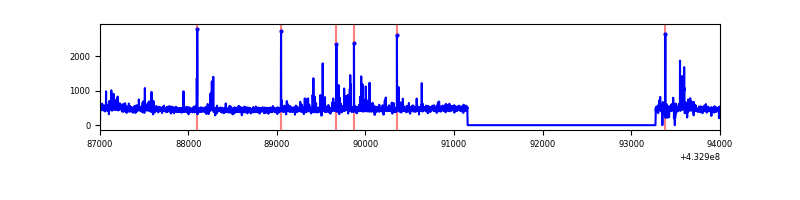 |
| D | 6998 | 4874 | 974 | 974 | 13.92% | 19.98% | 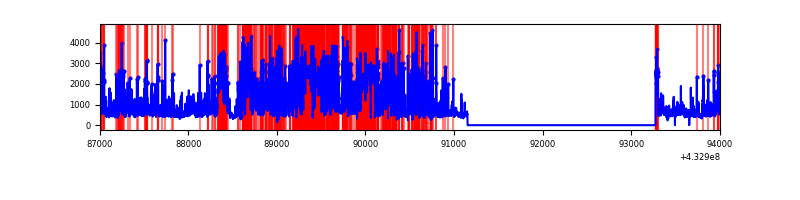 |
Top three noisy pixels from each quadrant. If the there are fewer than three noisy pixels in the level2.evt file, extra rows are filled as -1
| Pixel properties | Quadrant properties | ||||||
|---|---|---|---|---|---|---|---|
| Quadrant | DetID | PixID | Counts | Sigma | Mean | Median | Sigma |
| A | 15 | 237 | 717780 | 6692.92 | 520 | 509 | 107.2 |
| A | 10 | 83 | 576528 | 5374.89 | 520 | 509 | 107.2 |
| A | 15 | 222 | 236748 | 2204.37 | 520 | 509 | 107.2 |
| B | 5 | 255 | 73099 | 723.01 | 523 | 511 | 100.4 |
| B | 0 | 229 | 62015 | 612.61 | 523 | 511 | 100.4 |
| B | 15 | 85 | 36531 | 358.78 | 523 | 511 | 100.4 |
| C | 15 | 214 | 219519 | 1846.55 | 507 | 509 | 118.6 |
| C | 14 | 254 | 99296 | 832.91 | 507 | 509 | 118.6 |
| C | 0 | 239 | 20008 | 164.4 | 507 | 509 | 118.6 |
| D | 1 | 52 | 2894561 | 26838.85 | 442 | 428 | 107.8 |
| D | 12 | 16 | 675768 | 6262.79 | 442 | 428 | 107.8 |
| D | 12 | 233 | 447512 | 4146.05 | 442 | 428 | 107.8 |
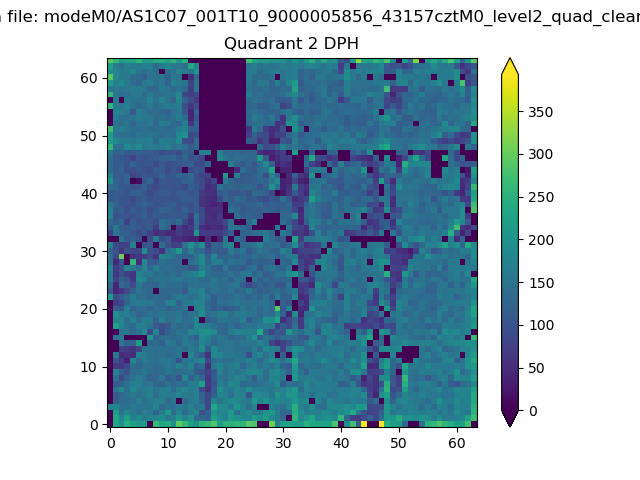
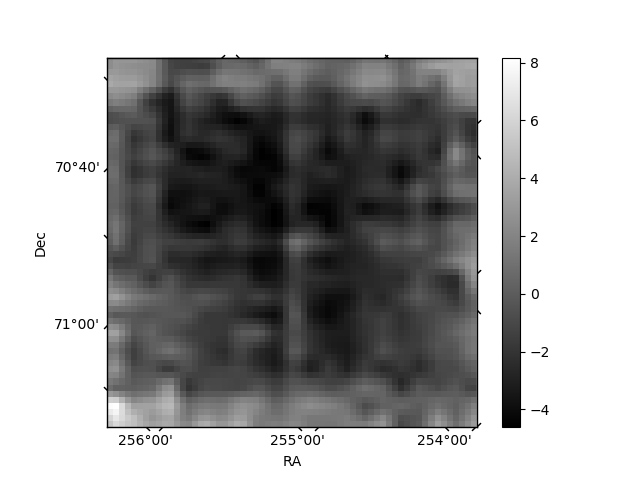
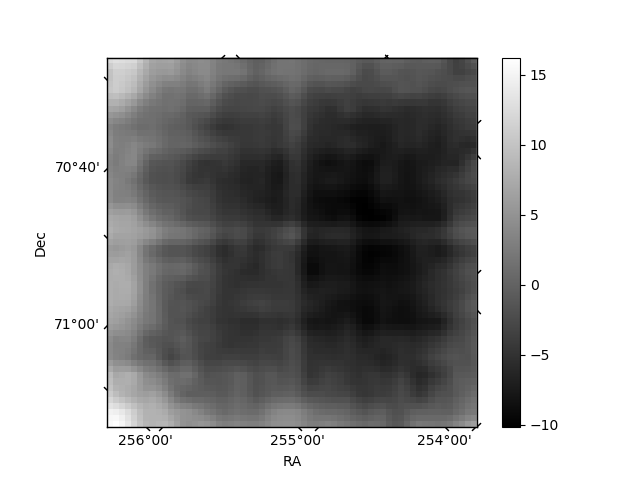
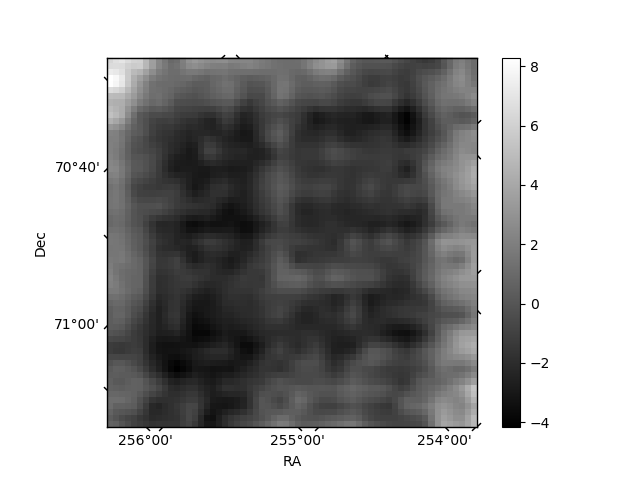
Histogram calculated using DETX and DETY for each event in the final _common_clean file
| Quadrant A | 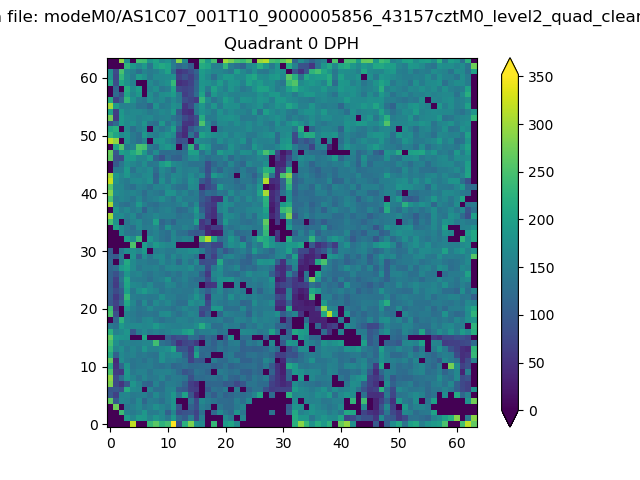 |
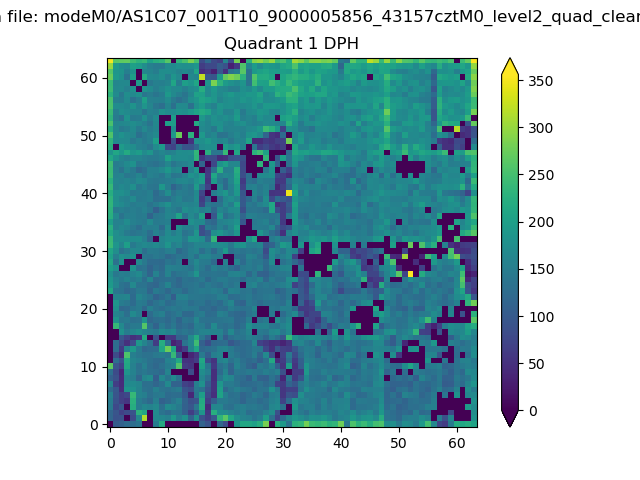 |
Quadrant B |
|---|---|---|---|
| Quadrant D | 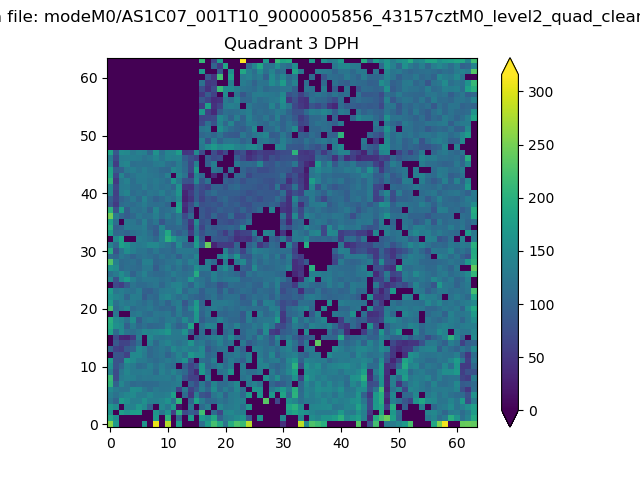 |
 |
Quadrant C |
| Plot type | Count rate plots | Images |
|---|---|---|
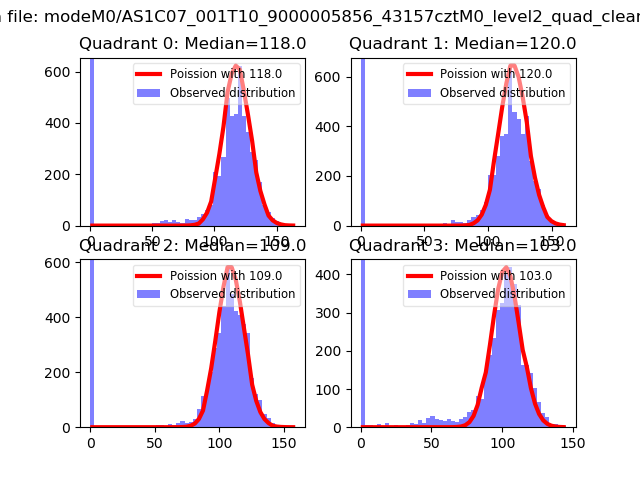
| Comparison with Poisson distribution Blue bars denote a histogram of data divided into 1 sec bins. Red curve is a Poisson curve with rate = median count rate of data. |
 |
 |
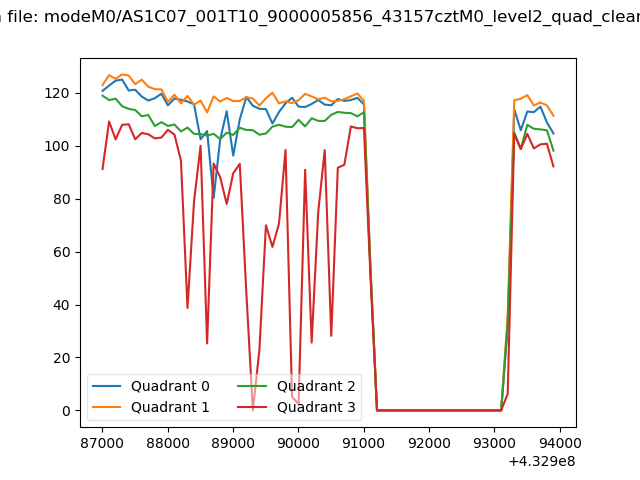
| Quadrant-wise count rates Data is divided into 100 sec bins |
 |
|
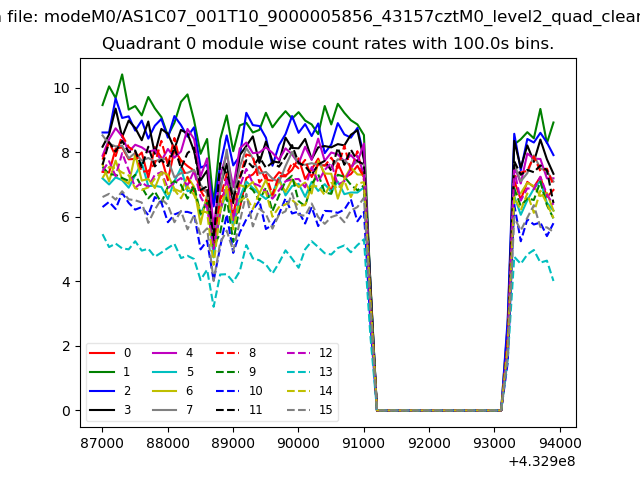
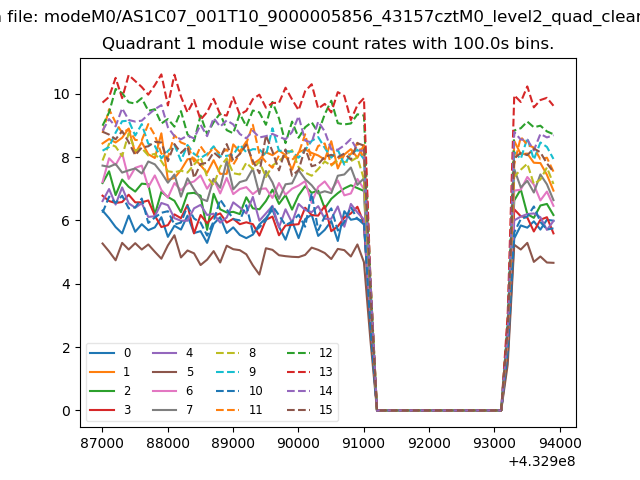
| Module-wise count rates for Quadrant A Data is divided into 100 sec bins |
 |
 |
| Module-wise count rates for Quadrant B Data is divided into 100 sec bins |
 |
 |
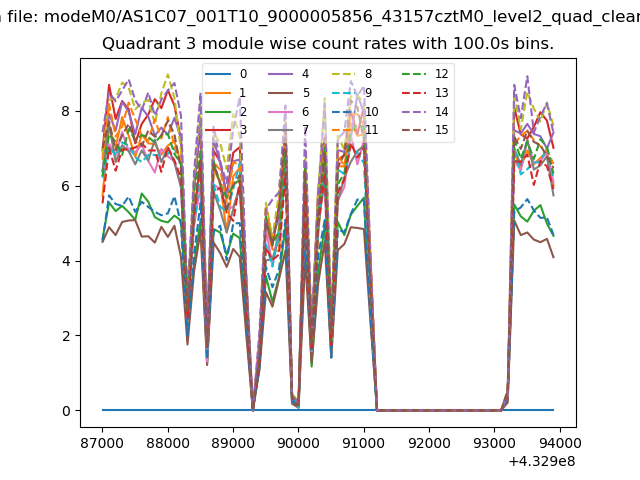
| Module-wise count rates for Quadrant C Data is divided into 100 sec bins |
 |
 |
| Module-wise count rates for Quadrant D Data is divided into 100 sec bins |
 |
 |
| Parameter | Plot |
|---|---|
| CZT HV Monitor | 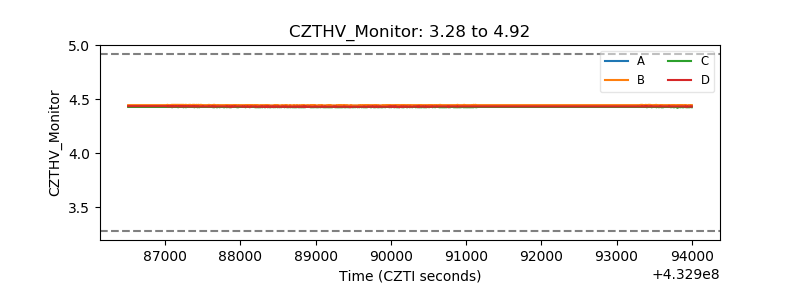 |
| D_VDD | 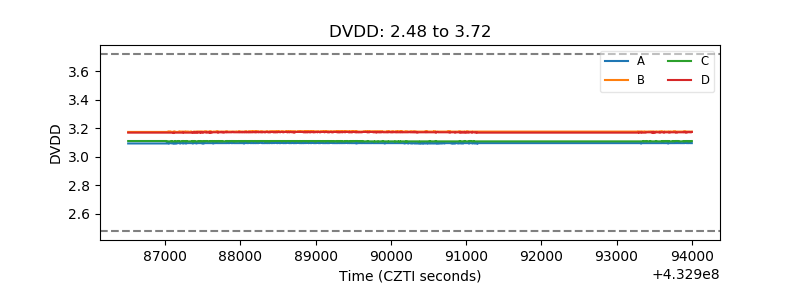 |
| Temperature 1 | 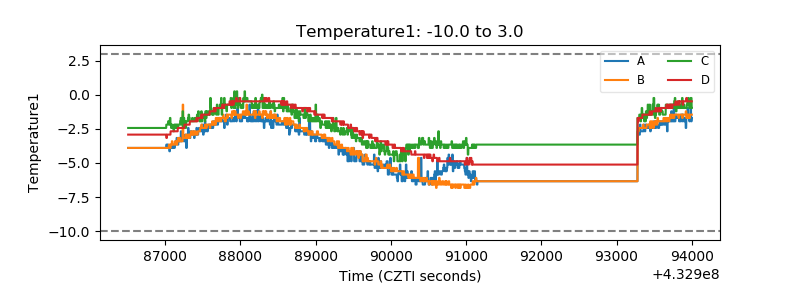 |
| Veto HV Monitor | 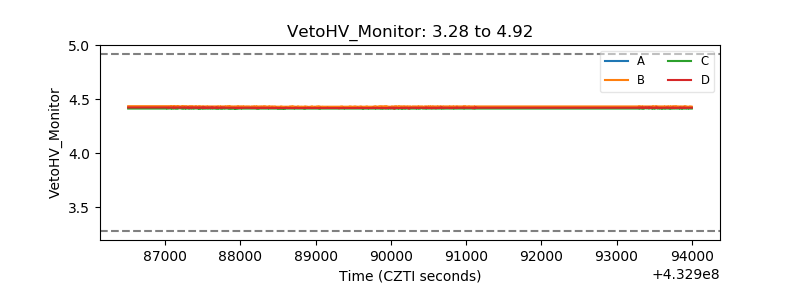 |
| Veto LLD | 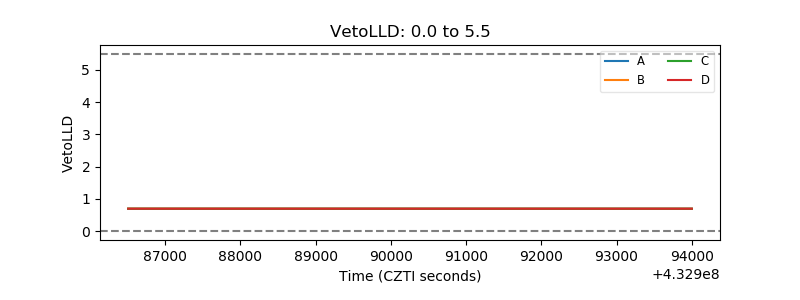 |
| Alpha Counter | 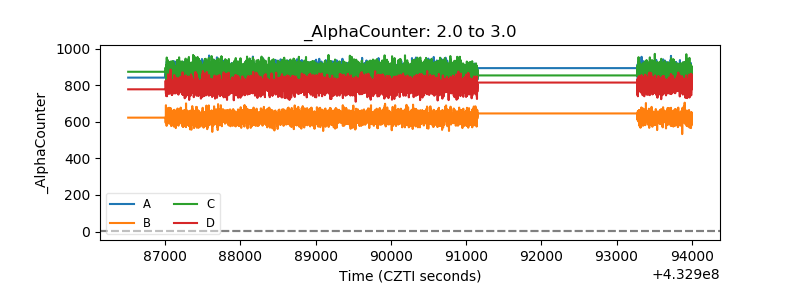 |
| _CPM_Rate |  |
| CZT Counter | 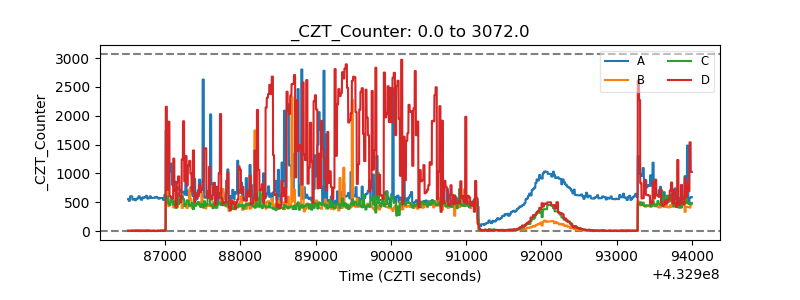 |
| +2.5 Volts monitor |  |
| +5 Volts monitor |  |
| _ROLL_ROT | 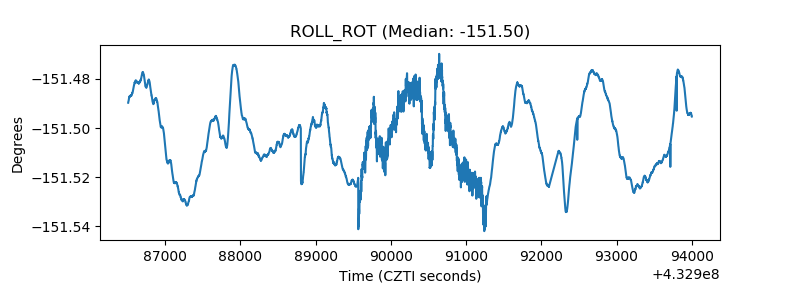 |
| _Roll_DEC | 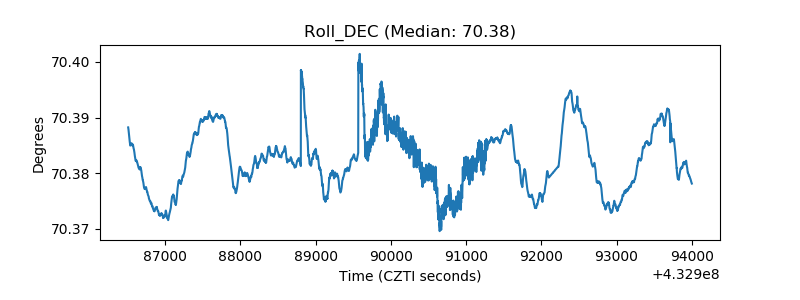 |
| _Roll_RA | 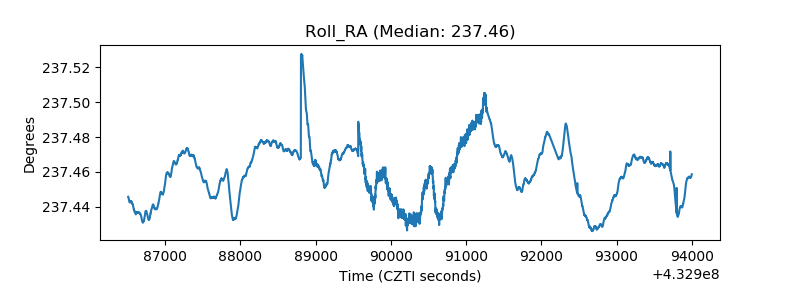 |
| Veto Counter | 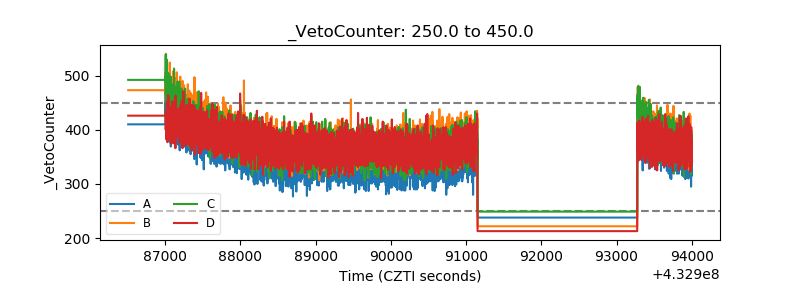 |