| Param | Original file | Final file |
|---|---|---|
| Filename | modeM0/AS1C07_001T10_9000005856_43158cztM0_level2.fits | modeM0/AS1C07_001T10_9000005856_43158cztM0_level2_quad_clean.evt |
| Size (bytes) | 351,063,360 | 83,499,840 |
| Size | 334.8 MB | 79.6 MB |
| Events in quadrant A | 3,632,464 | 567,361 |
| Events in quadrant B | 2,431,005 | 585,243 |
| Events in quadrant C | 2,374,369 | 543,614 |
| Events in quadrant D | 4,155,534 | 470,863 |
| Mode M9 | |||
|---|---|---|---|
| Quadrant | BADHDUFLAG | Total packets | Discarded packets |
| A | 0 | 28 | 0 |
| B | 0 | 29 | 0 |
| C | 0 | 29 | 0 |
| D | 0 | 29 | 0 |
| Mode SS | |||
|---|---|---|---|
| Quadrant | BADHDUFLAG | Total packets | Discarded packets |
| A | 0 | 104 | 0 |
| B | 0 | 104 | 0 |
| C | 0 | 104 | 0 |
| D | 0 | 104 | 0 |
| Mode M0 | |||
|---|---|---|---|
| Quadrant | BADHDUFLAG | Total packets | Discarded packets |
| A | 0 | 14070 | 2 |
| B | 0 | 10783 | 2 |
| C | 0 | 10516 | 2 |
| D | 0 | 15974 | 2 |
| Quadrant | Total seconds | Saturated seconds | Saturation percentage |
|---|---|---|---|
| A | 5158 | 167 | 3.237689% |
| B | 5158 | 19 | 0.368360% |
| C | 5158 | 8 | 0.155099% |
| D | 5158 | 506 | 9.810004% |
Noise dominated data is calculated using 1-second bins in cleaned event files. If a bin has >2000 counts, and if more than 50% of those come from <1% of pixels, then it is considered to be noise-dominated and hence unusable.
| Quadrant | # 1 sec bins | Bins with >0 counts | Bins with >2000 counts | High rate bins dominated by noise | Noise dominated (total time) | Noise dominated (detector-on time) | Marked lightcurve |
|---|---|---|---|---|---|---|---|
| A | 7070 | 5159 | 123 | 123 | 1.74% | 2.38% | 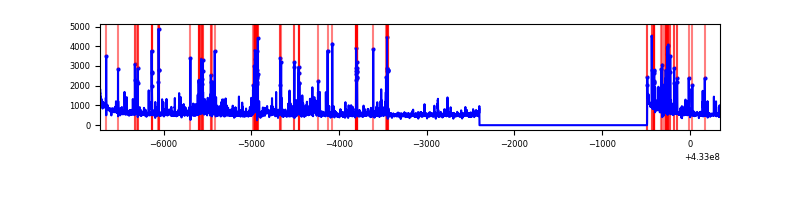 |
| B | 7070 | 5159 | 18 | 18 | 0.25% | 0.35% | 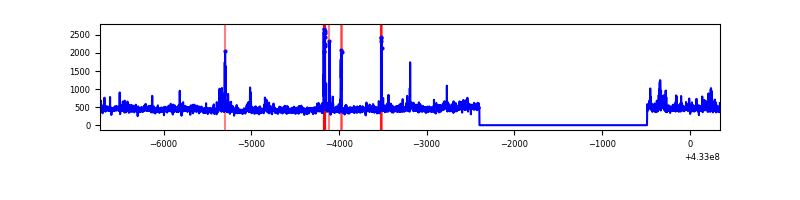 |
| C | 7070 | 5159 | 3 | 3 | 0.04% | 0.06% | 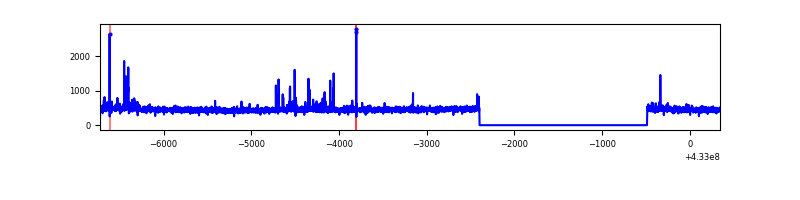 |
| D | 7070 | 5159 | 454 | 454 | 6.42% | 8.80% | 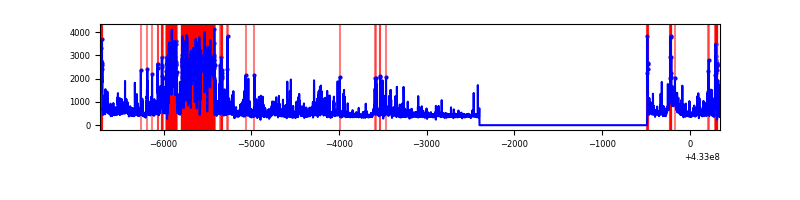 |
Top three noisy pixels from each quadrant. If the there are fewer than three noisy pixels in the level2.evt file, extra rows are filled as -1
| Pixel properties | Quadrant properties | ||||||
|---|---|---|---|---|---|---|---|
| Quadrant | DetID | PixID | Counts | Sigma | Mean | Median | Sigma |
| A | 10 | 83 | 600391 | 5408.48 | 541 | 530 | 110.9 |
| A | 15 | 237 | 542719 | 4888.49 | 541 | 530 | 110.9 |
| A | 15 | 222 | 253095 | 2277.18 | 541 | 530 | 110.9 |
| B | 0 | 229 | 136873 | 1321.33 | 541 | 527 | 103.2 |
| B | 5 | 255 | 63594 | 611.18 | 541 | 527 | 103.2 |
| B | 0 | 230 | 27078 | 257.31 | 541 | 527 | 103.2 |
| C | 15 | 214 | 231461 | 1883.17 | 529 | 533 | 122.6 |
| C | 14 | 254 | 52505 | 423.82 | 529 | 533 | 122.6 |
| C | 0 | 239 | 19439 | 154.17 | 529 | 533 | 122.6 |
| D | 12 | 233 | 1218593 | 9792.43 | 508 | 492 | 124.4 |
| D | 12 | 16 | 491964 | 3950.99 | 508 | 492 | 124.4 |
| D | 1 | 52 | 319598 | 2565.32 | 508 | 492 | 124.4 |
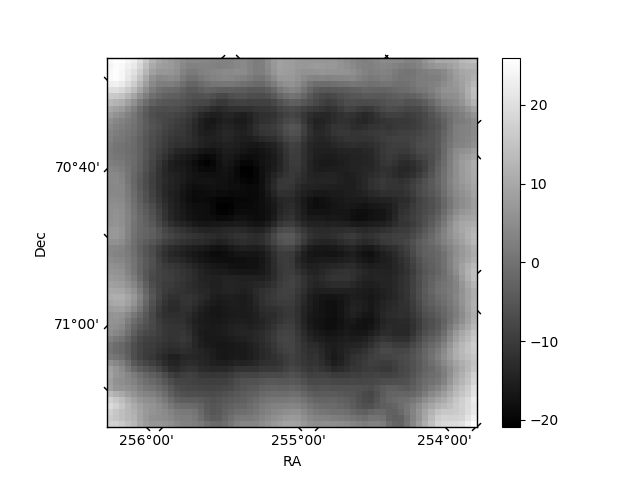
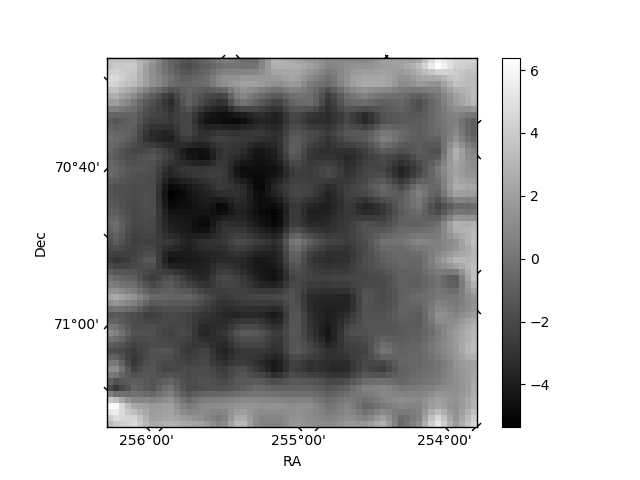
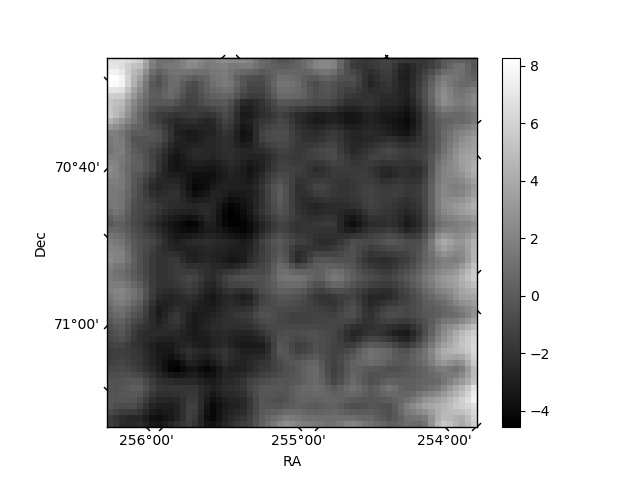
Histogram calculated using DETX and DETY for each event in the final _common_clean file
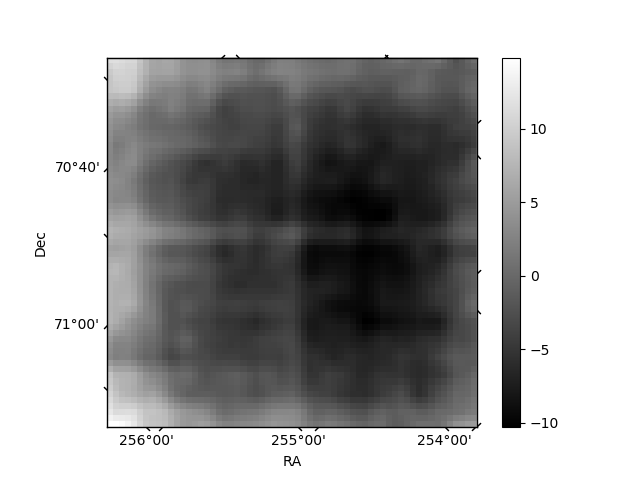
| Quadrant A | 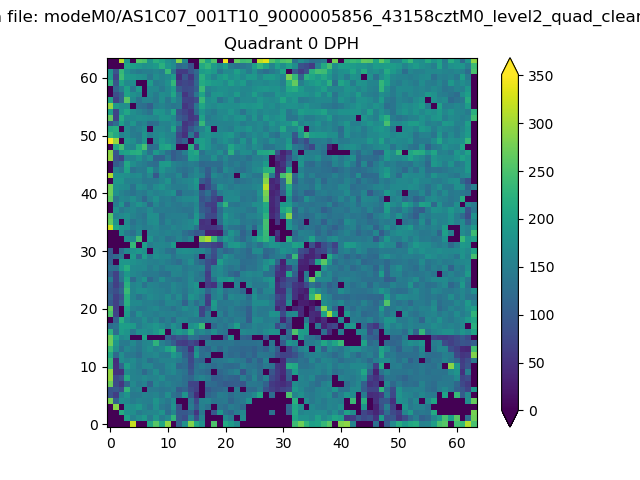 |
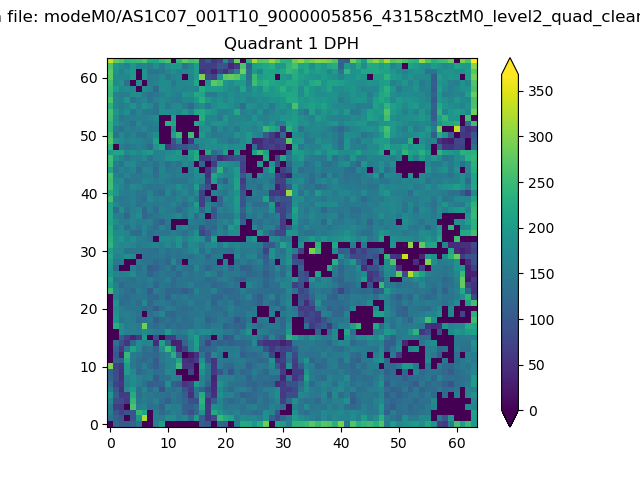 |
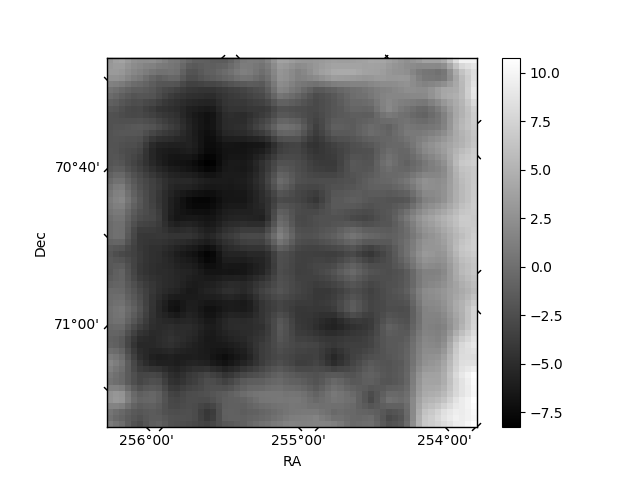
Quadrant B |
|---|---|---|---|
| Quadrant D |  |
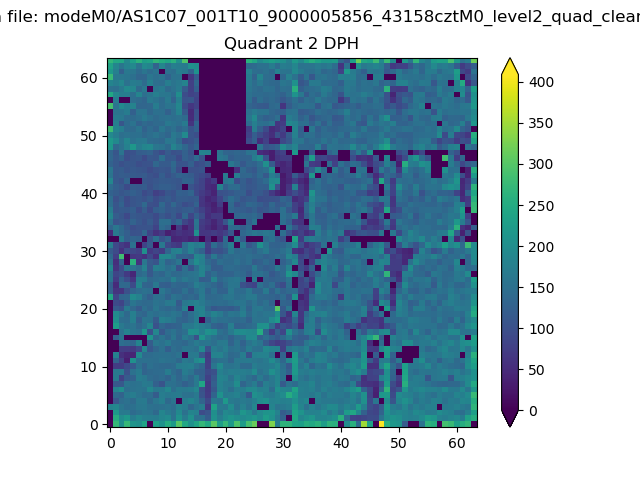 |
Quadrant C |
| Plot type | Count rate plots | Images |
|---|---|---|
| Comparison with Poisson distribution Blue bars denote a histogram of data divided into 1 sec bins. Red curve is a Poisson curve with rate = median count rate of data. |
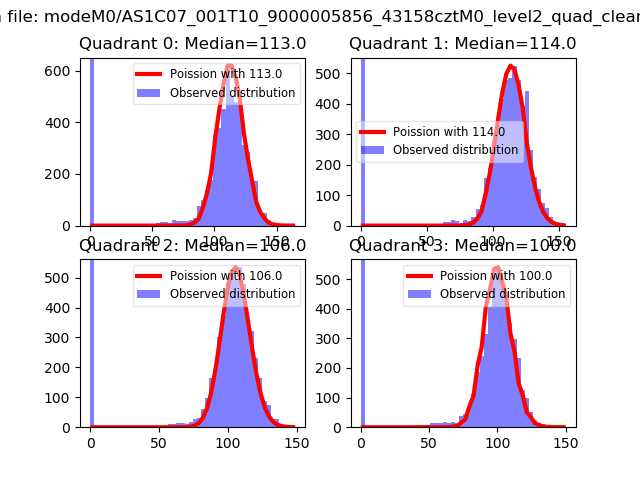 |
 |
| Quadrant-wise count rates Data is divided into 100 sec bins |
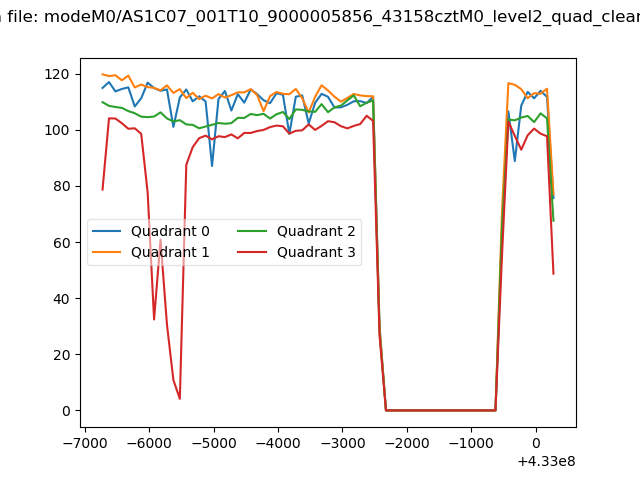 |
|
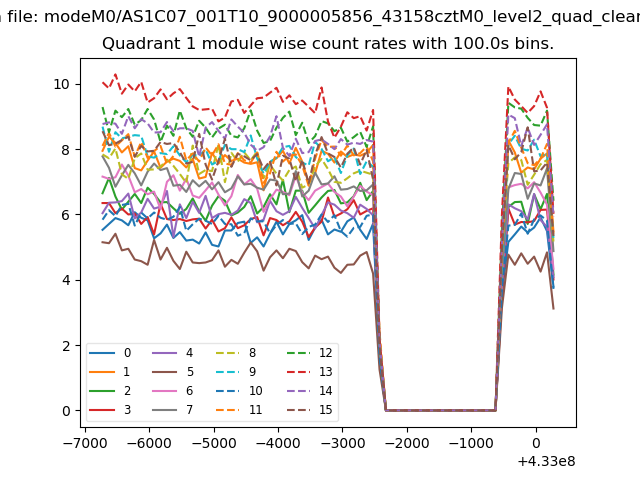
| Module-wise count rates for Quadrant A Data is divided into 100 sec bins |
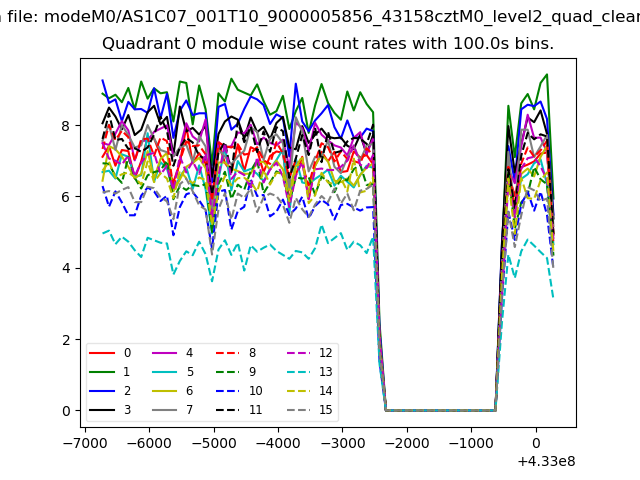 |
 |
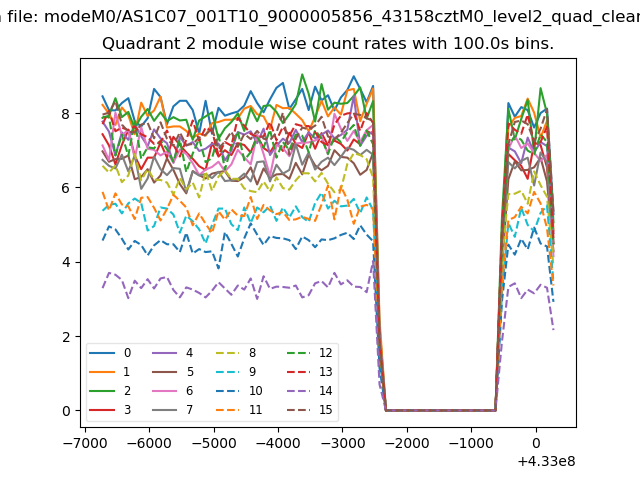
| Module-wise count rates for Quadrant B Data is divided into 100 sec bins |
 |
 |
| Module-wise count rates for Quadrant C Data is divided into 100 sec bins |
 |
 |
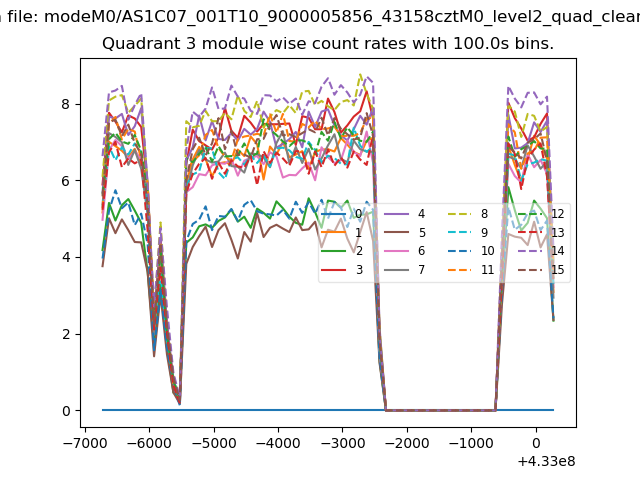
| Module-wise count rates for Quadrant D Data is divided into 100 sec bins |
 |
 |
| Parameter | Plot |
|---|---|
| CZT HV Monitor | 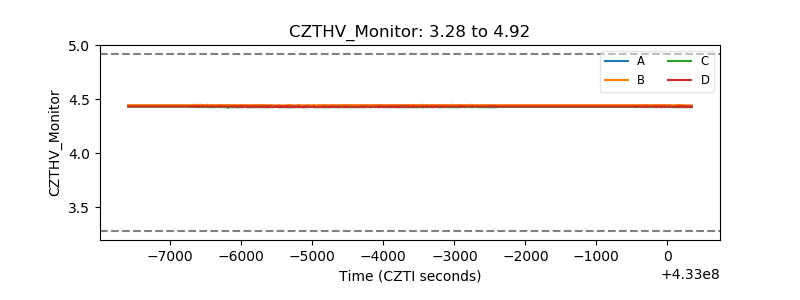 |
| D_VDD | 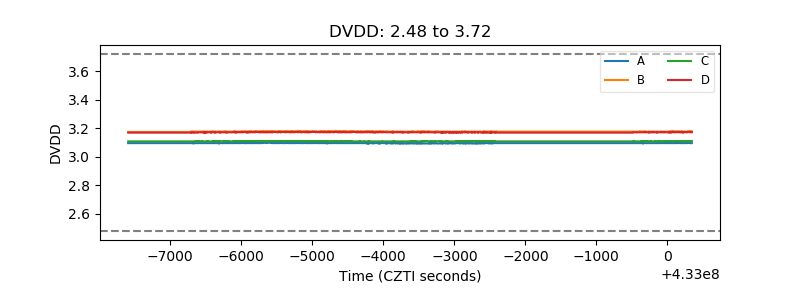 |
| Temperature 1 | 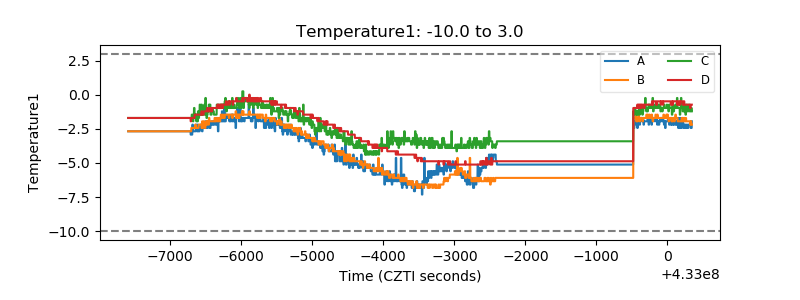 |
| Veto HV Monitor |  |
| Veto LLD | 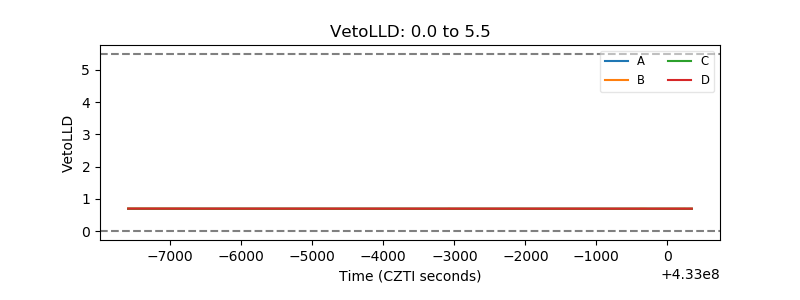 |
| Alpha Counter | 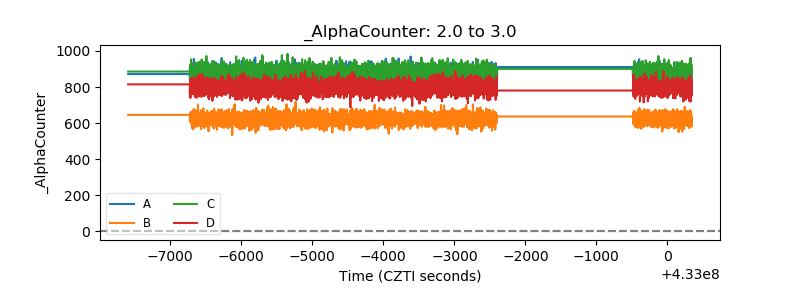 |
| _CPM_Rate | 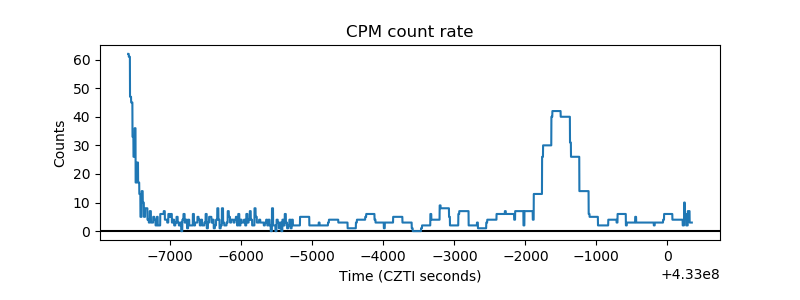 |
| CZT Counter | 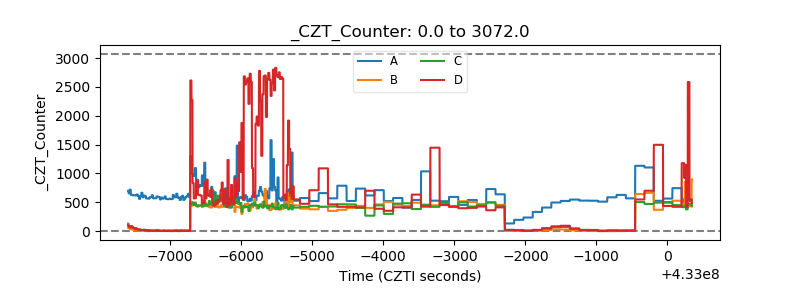 |
| +2.5 Volts monitor | 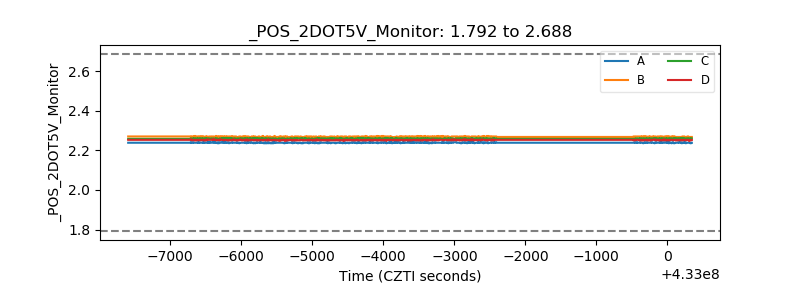 |
| +5 Volts monitor | 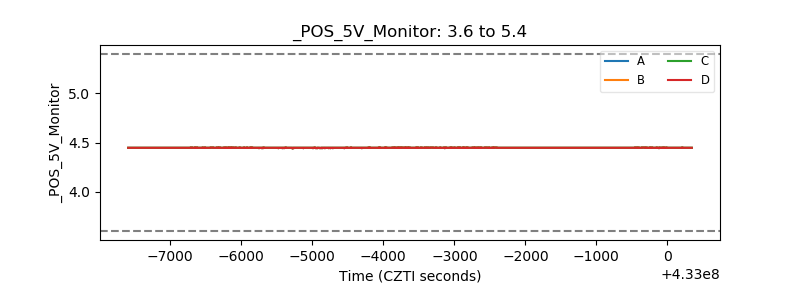 |
| _ROLL_ROT | 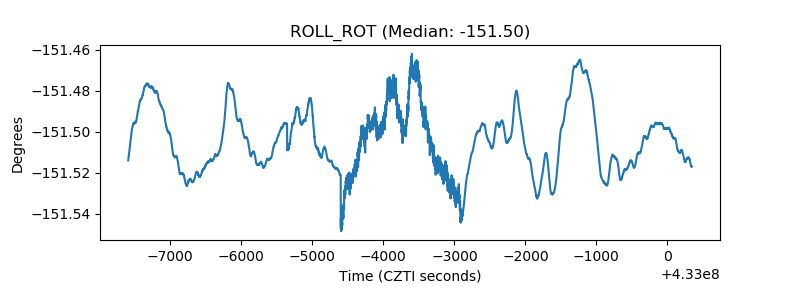 |
| _Roll_DEC | 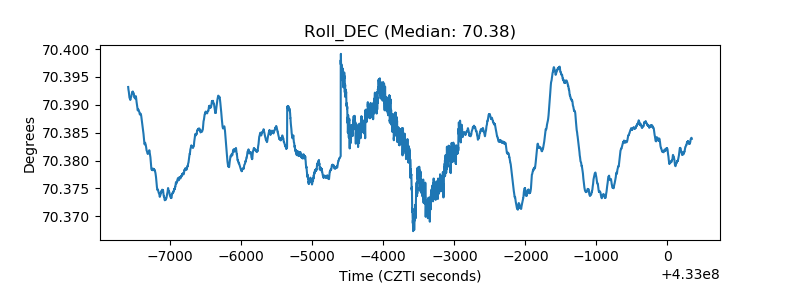 |
| _Roll_RA | 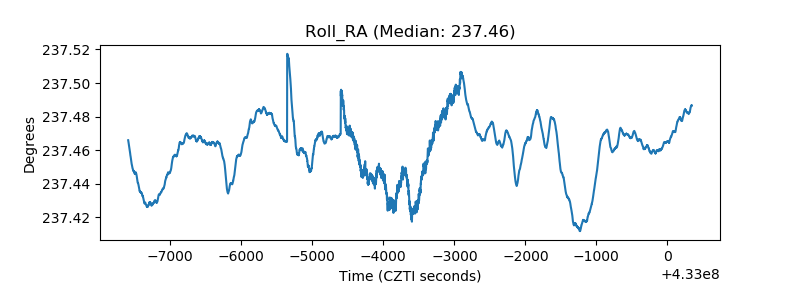 |
| Veto Counter | 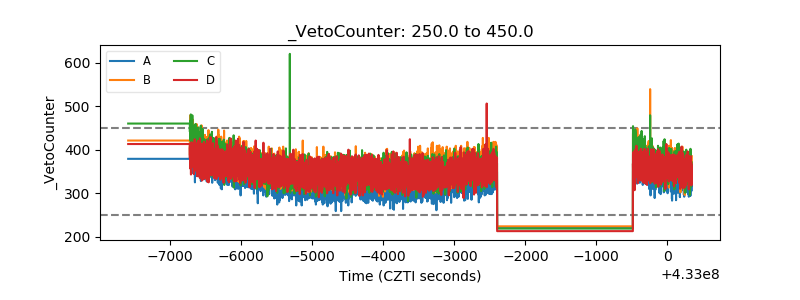 |