| Param | Original file | Final file |
|---|---|---|
| Filename | modeM0/AS1C07_001T10_9000005856_43159cztM0_level2.fits | modeM0/AS1C07_001T10_9000005856_43159cztM0_level2_quad_clean.evt |
| Size (bytes) | 337,766,400 | 89,568,000 |
| Size | 322.1 MB | 85.4 MB |
| Events in quadrant A | 3,516,150 | 596,618 |
| Events in quadrant B | 2,527,552 | 620,035 |
| Events in quadrant C | 2,498,115 | 576,452 |
| Events in quadrant D | 3,528,685 | 530,631 |
| Mode M9 | |||
|---|---|---|---|
| Quadrant | BADHDUFLAG | Total packets | Discarded packets |
| A | 0 | 17 | 0 |
| B | 0 | 18 | 0 |
| C | 0 | 18 | 0 |
| D | 0 | 18 | 0 |
| Mode SS | |||
|---|---|---|---|
| Quadrant | BADHDUFLAG | Total packets | Discarded packets |
| A | 0 | 112 | 0 |
| B | 0 | 112 | 0 |
| C | 0 | 112 | 0 |
| D | 0 | 112 | 0 |
| Mode M0 | |||
|---|---|---|---|
| Quadrant | BADHDUFLAG | Total packets | Discarded packets |
| A | 0 | 13863 | 2 |
| B | 0 | 11404 | 2 |
| C | 0 | 11189 | 3 |
| D | 0 | 14452 | 2 |
| Quadrant | Total seconds | Saturated seconds | Saturation percentage |
|---|---|---|---|
| A | 5552 | 176 | 3.170029% |
| B | 5552 | 3 | 0.054035% |
| C | 5550 | 9 | 0.162162% |
| D | 5551 | 202 | 3.638984% |
Noise dominated data is calculated using 1-second bins in cleaned event files. If a bin has >2000 counts, and if more than 50% of those come from <1% of pixels, then it is considered to be noise-dominated and hence unusable.
| Quadrant | # 1 sec bins | Bins with >0 counts | Bins with >2000 counts | High rate bins dominated by noise | Noise dominated (total time) | Noise dominated (detector-on time) | Marked lightcurve |
|---|---|---|---|---|---|---|---|
| A | 7135 | 5553 | 106 | 106 | 1.49% | 1.91% | 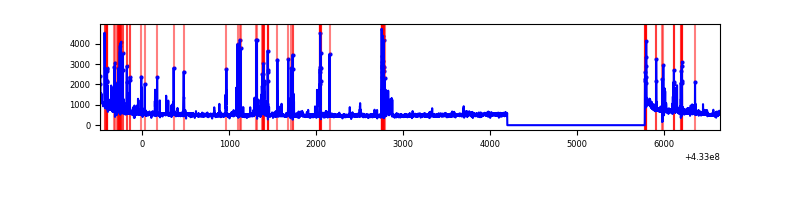 |
| B | 7135 | 5553 | 2 | 2 | 0.03% | 0.04% | 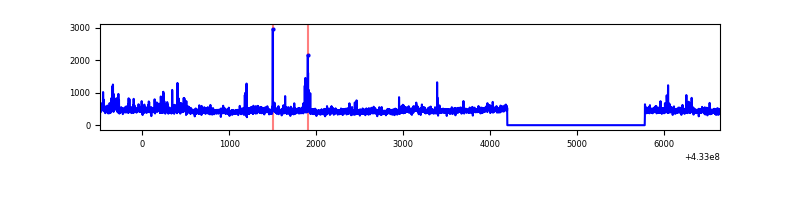 |
| C | 7134 | 5552 | 2 | 2 | 0.03% | 0.04% | 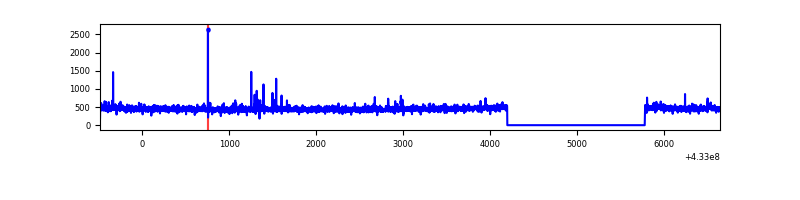 |
| D | 7134 | 5552 | 182 | 182 | 2.55% | 3.28% | 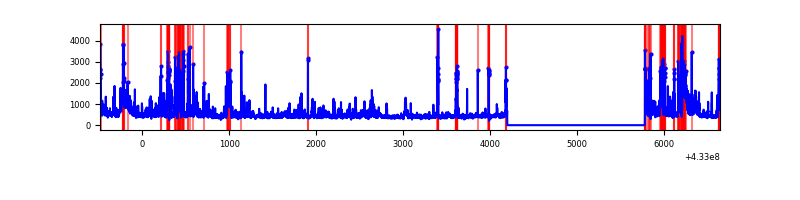 |
Top three noisy pixels from each quadrant. If the there are fewer than three noisy pixels in the level2.evt file, extra rows are filled as -1
| Pixel properties | Quadrant properties | ||||||
|---|---|---|---|---|---|---|---|
| Quadrant | DetID | PixID | Counts | Sigma | Mean | Median | Sigma |
| A | 10 | 83 | 620918 | 5187.88 | 580 | 568 | 119.6 |
| A | 15 | 237 | 412594 | 3445.71 | 580 | 568 | 119.6 |
| A | 15 | 222 | 139393 | 1160.97 | 580 | 568 | 119.6 |
| B | 0 | 229 | 123790 | 1091.86 | 582 | 566 | 112.9 |
| B | 0 | 189 | 51599 | 452.19 | 582 | 566 | 112.9 |
| B | 5 | 255 | 31411 | 273.31 | 582 | 566 | 112.9 |
| C | 15 | 214 | 245332 | 1849.11 | 566 | 569 | 132.4 |
| C | 14 | 254 | 34423 | 255.76 | 566 | 569 | 132.4 |
| C | 4 | 254 | 6388 | 43.96 | 566 | 569 | 132.4 |
| D | 12 | 16 | 605975 | 4386.26 | 565 | 549 | 138.0 |
| D | 1 | 52 | 440710 | 3188.93 | 565 | 549 | 138.0 |
| D | 13 | 249 | 99899 | 719.78 | 565 | 549 | 138.0 |
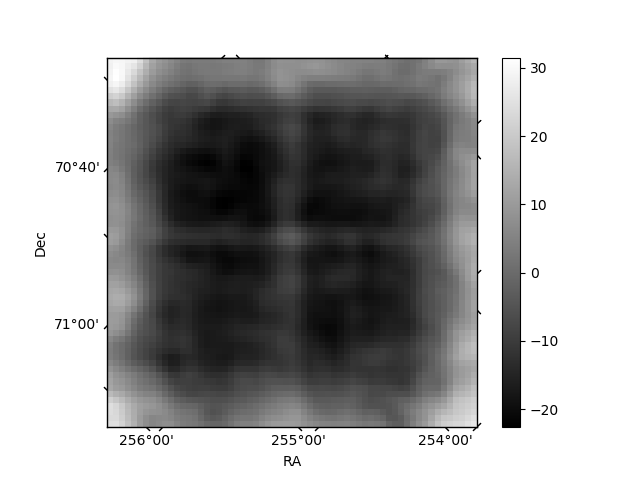
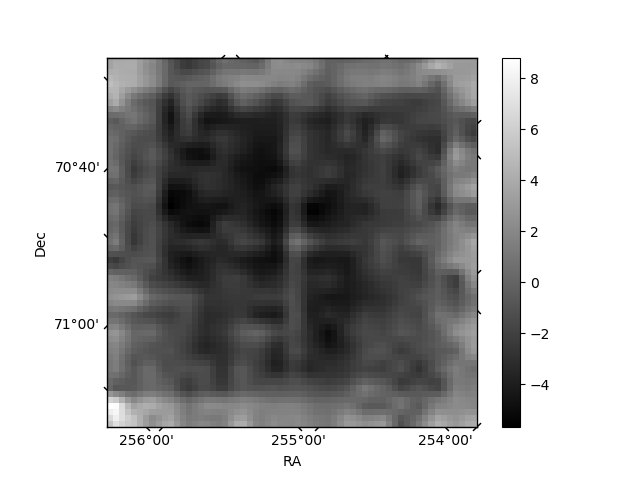
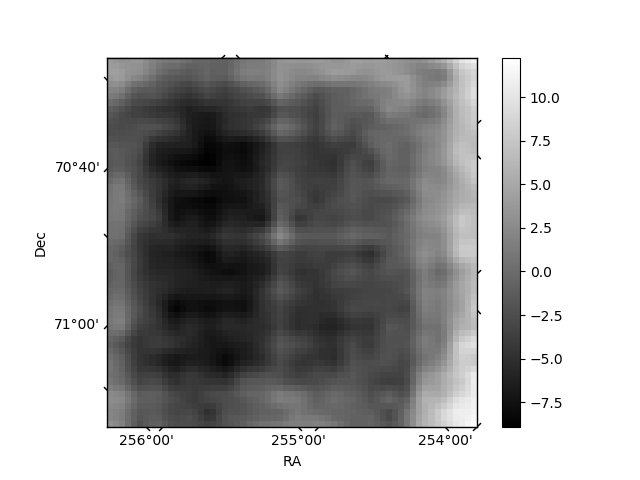
Histogram calculated using DETX and DETY for each event in the final _common_clean file
| Quadrant A | 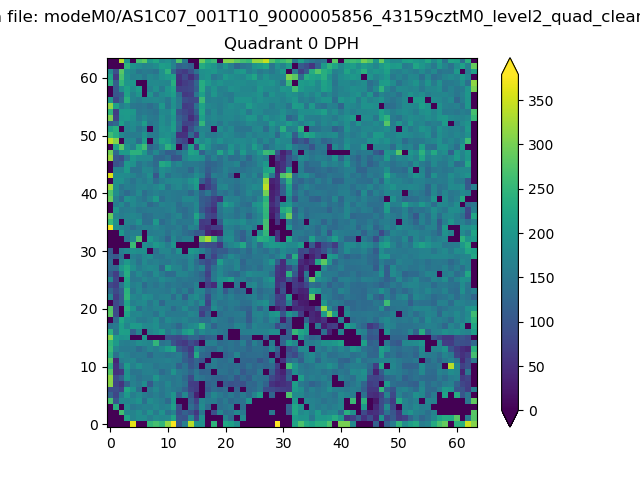 |
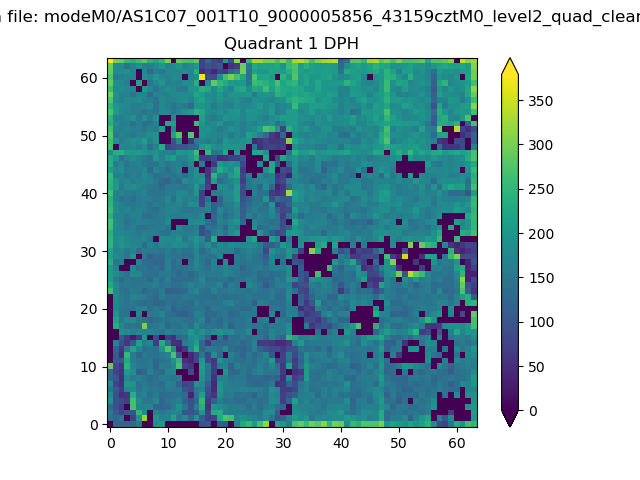 |
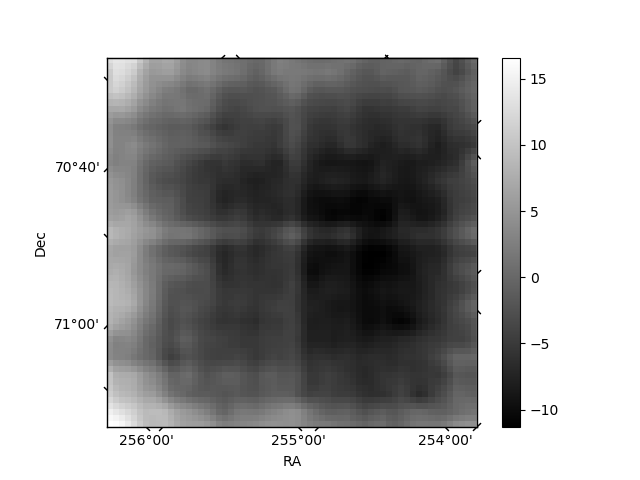
Quadrant B |
|---|---|---|---|
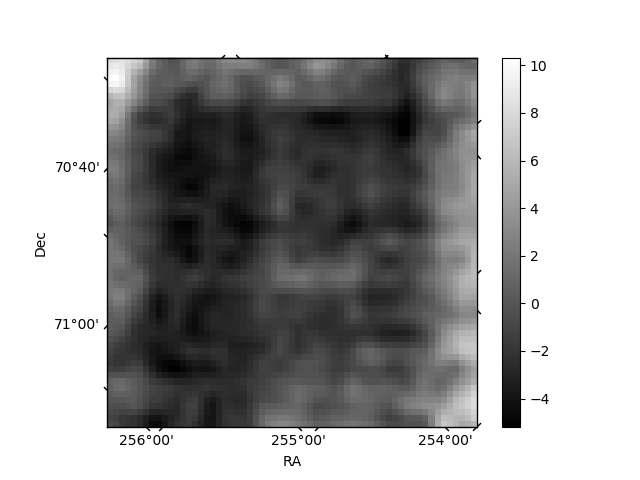
| Quadrant D | 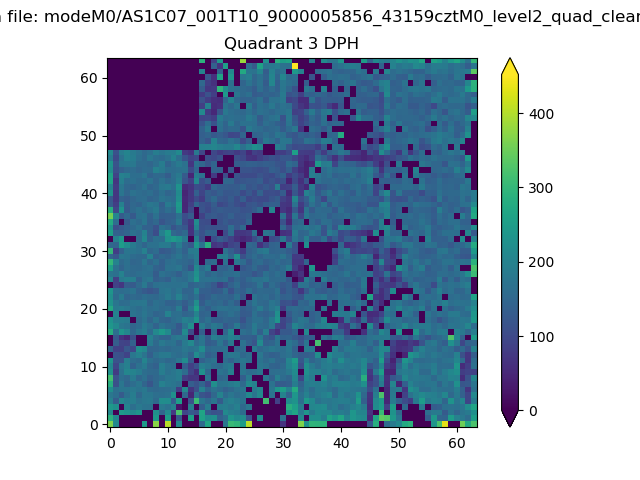 |
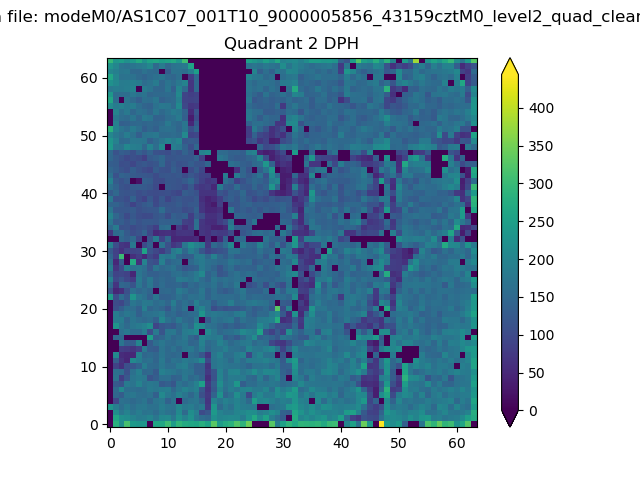 |
Quadrant C |
| Plot type | Count rate plots | Images |
|---|---|---|
| Comparison with Poisson distribution Blue bars denote a histogram of data divided into 1 sec bins. Red curve is a Poisson curve with rate = median count rate of data. |
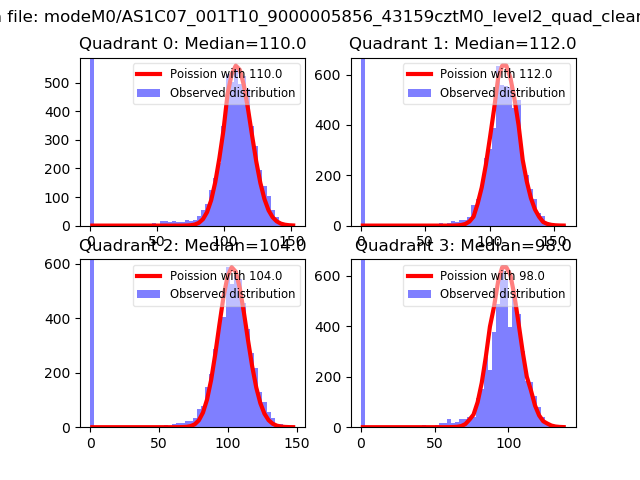 |
 |
| Quadrant-wise count rates Data is divided into 100 sec bins |
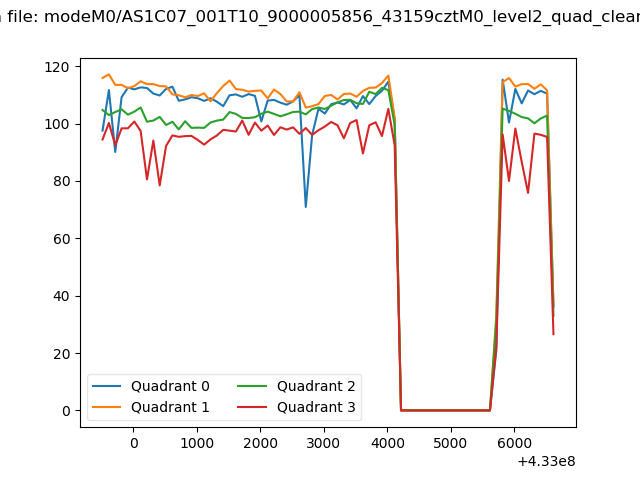 |
|
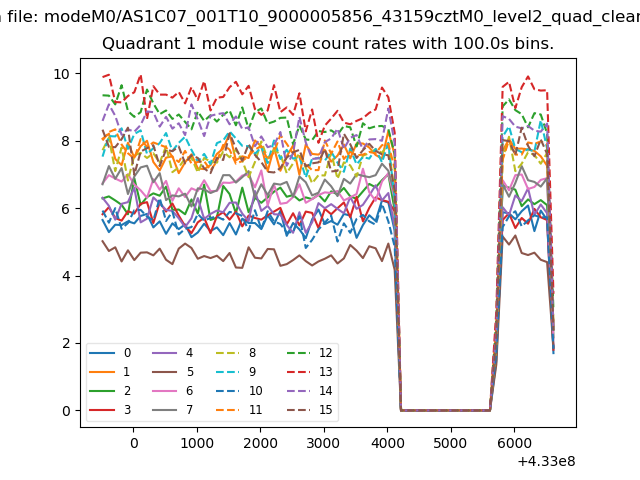
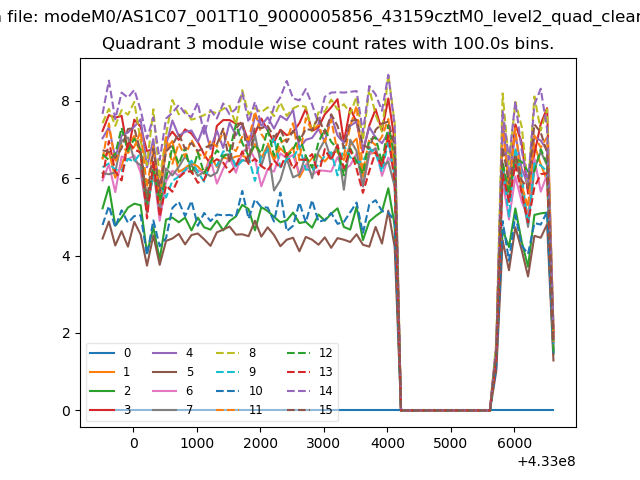
| Module-wise count rates for Quadrant A Data is divided into 100 sec bins |
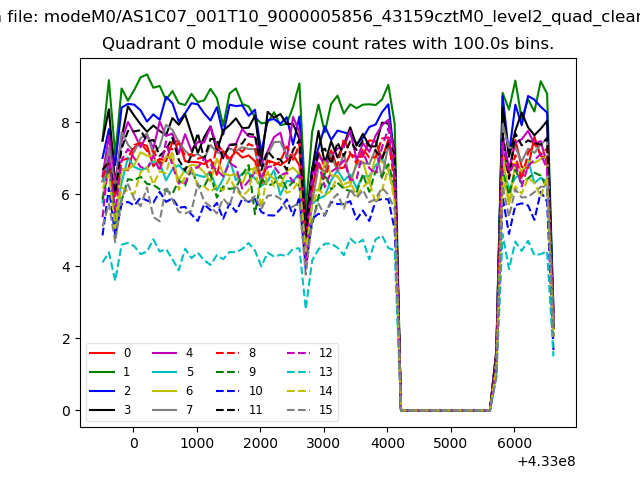 |
 |
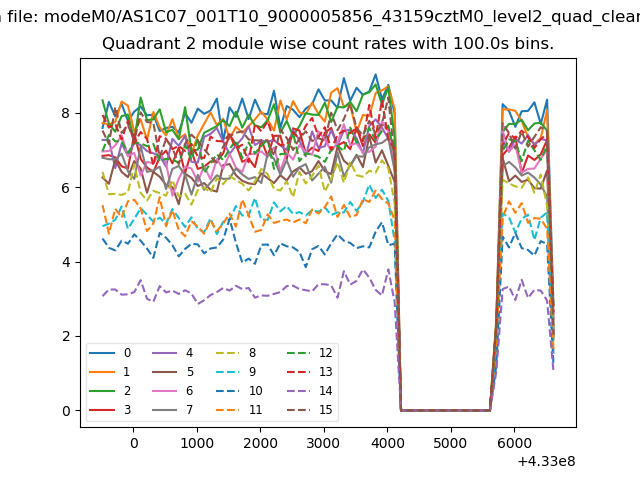
| Module-wise count rates for Quadrant B Data is divided into 100 sec bins |
 |
 |
| Module-wise count rates for Quadrant C Data is divided into 100 sec bins |
 |
 |
| Module-wise count rates for Quadrant D Data is divided into 100 sec bins |
 |
 |
| Parameter | Plot |
|---|---|
| CZT HV Monitor | 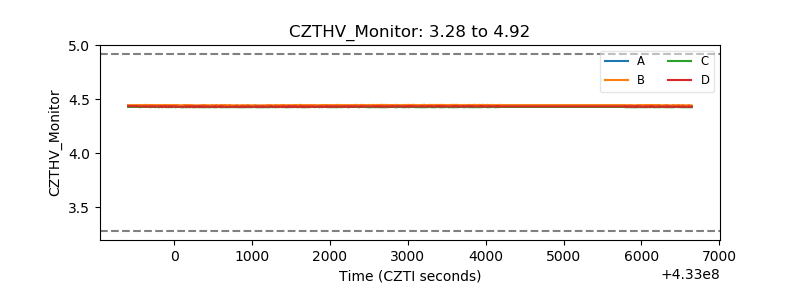 |
| D_VDD | 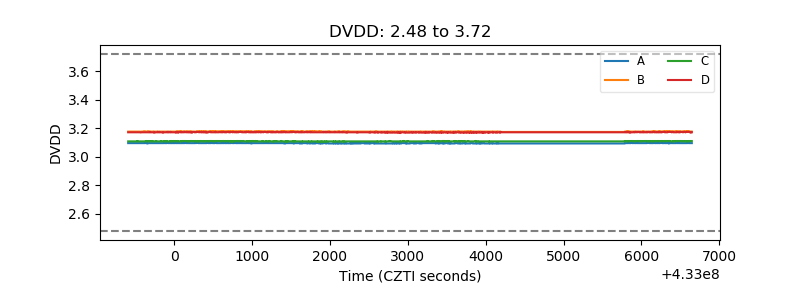 |
| Temperature 1 | 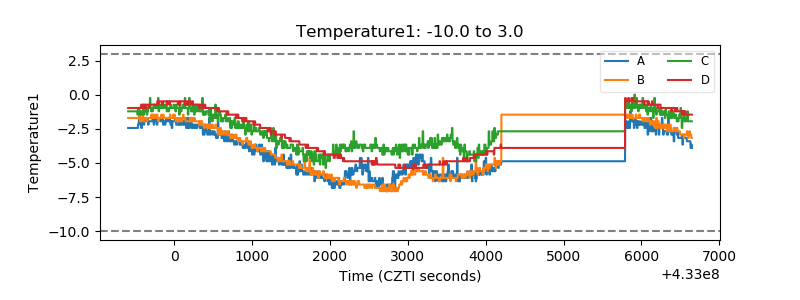 |
| Veto HV Monitor |  |
| Veto LLD | 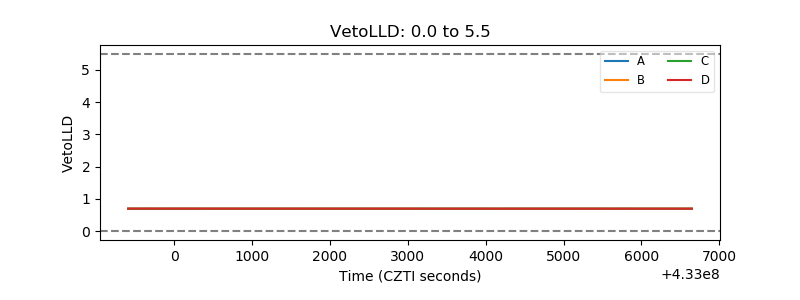 |
| Alpha Counter | 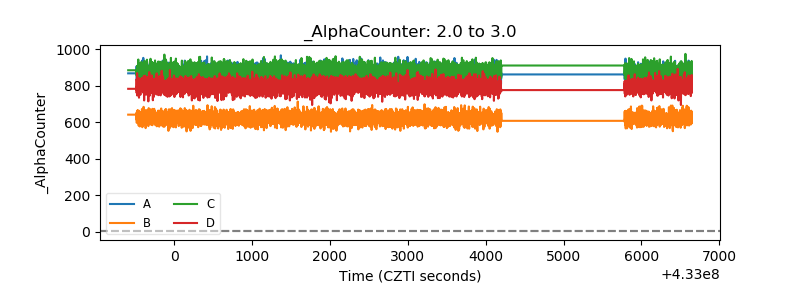 |
| _CPM_Rate | 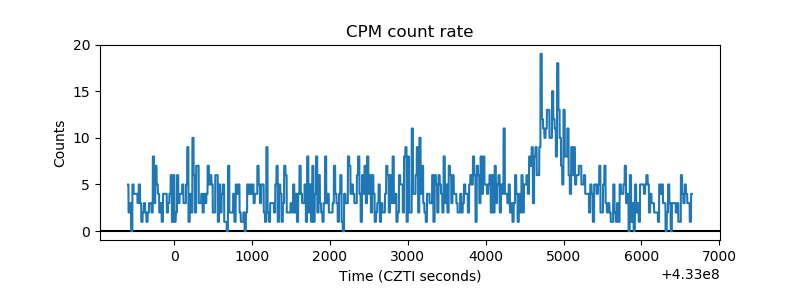 |
| CZT Counter | 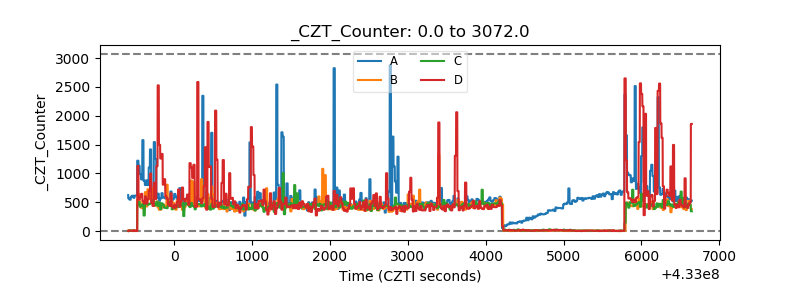 |
| +2.5 Volts monitor | 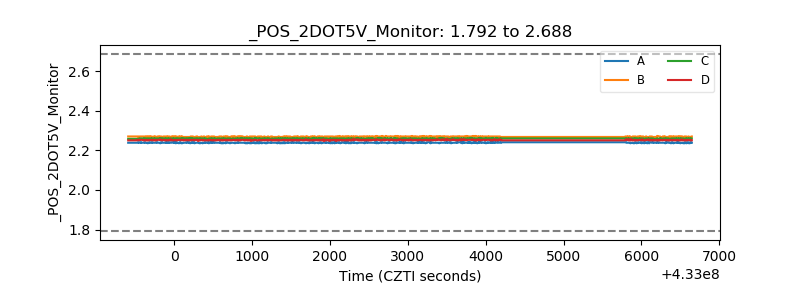 |
| +5 Volts monitor | 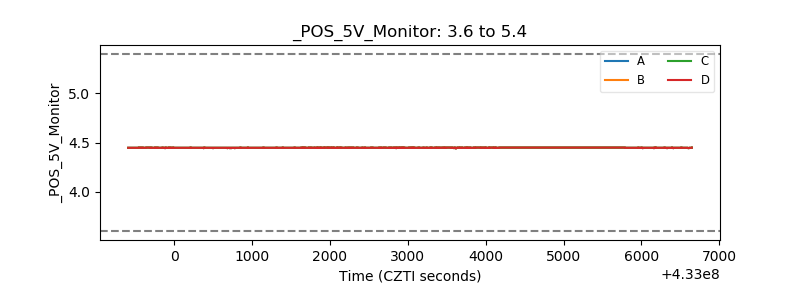 |
| _ROLL_ROT | 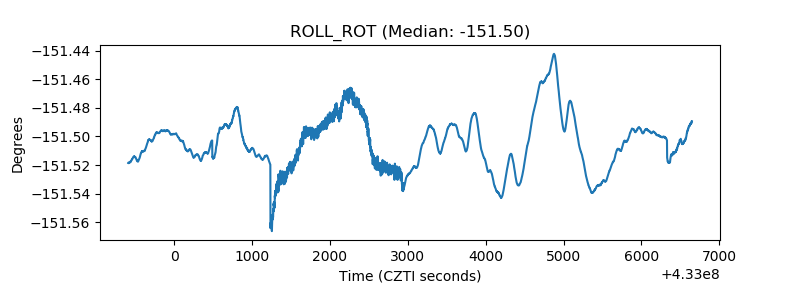 |
| _Roll_DEC | 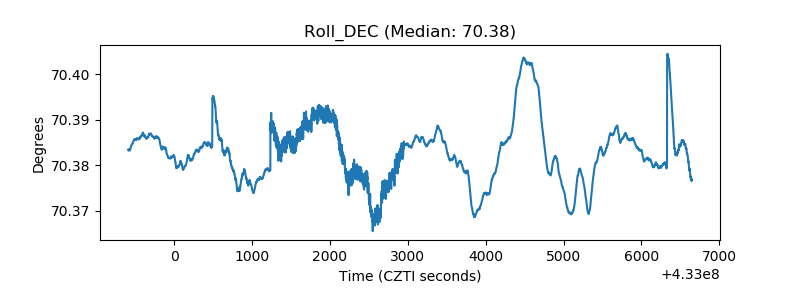 |
| _Roll_RA | 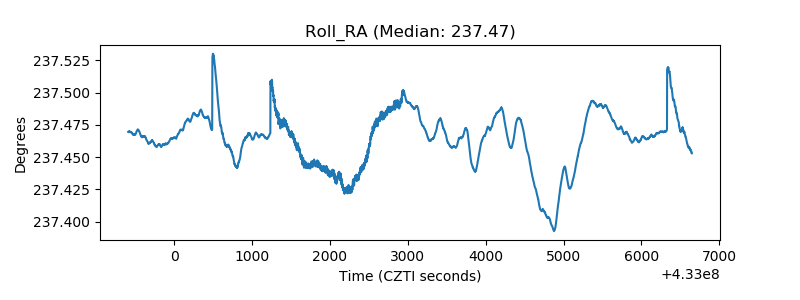 |
| Veto Counter | 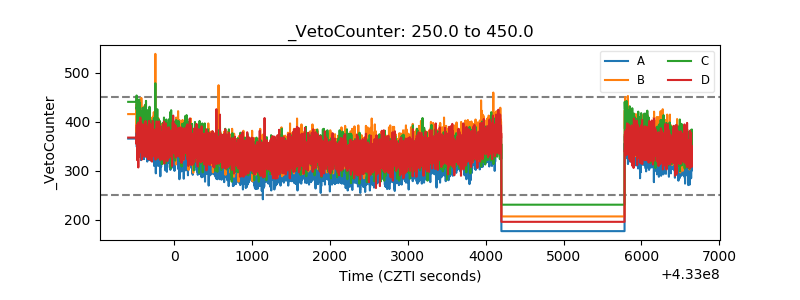 |