| Param | Original file | Final file |
|---|---|---|
| Filename | modeM0/AS1C07_001T10_9000005856_43167cztM0_level2.fits | modeM0/AS1C07_001T10_9000005856_43167cztM0_level2_quad_clean.evt |
| Size (bytes) | 369,763,200 | 82,831,680 |
| Size | 352.6 MB | 79.0 MB |
| Events in quadrant A | 3,237,765 | 562,386 |
| Events in quadrant B | 2,356,086 | 584,397 |
| Events in quadrant C | 2,421,272 | 547,636 |
| Events in quadrant D | 5,264,787 | 447,222 |
| Mode M9 | |||
|---|---|---|---|
| Quadrant | BADHDUFLAG | Total packets | Discarded packets |
| A | 0 | 18 | 0 |
| B | 0 | 18 | 0 |
| C | 0 | 18 | 0 |
| D | 0 | 18 | 0 |
| Mode SS | |||
|---|---|---|---|
| Quadrant | BADHDUFLAG | Total packets | Discarded packets |
| A | 0 | 106 | 0 |
| B | 0 | 106 | 0 |
| C | 0 | 106 | 0 |
| D | 0 | 106 | 0 |
| Mode M0 | |||
|---|---|---|---|
| Quadrant | BADHDUFLAG | Total packets | Discarded packets |
| A | 0 | 12969 | 1 |
| B | 0 | 10949 | 1 |
| C | 0 | 10754 | 1 |
| D | 0 | 19286 | 1 |
| Quadrant | Total seconds | Saturated seconds | Saturation percentage |
|---|---|---|---|
| A | 5231 | 111 | 2.121965% |
| B | 5232 | 33 | 0.630734% |
| C | 5232 | 26 | 0.496942% |
| D | 5232 | 818 | 15.634557% |
Noise dominated data is calculated using 1-second bins in cleaned event files. If a bin has >2000 counts, and if more than 50% of those come from <1% of pixels, then it is considered to be noise-dominated and hence unusable.
| Quadrant | # 1 sec bins | Bins with >0 counts | Bins with >2000 counts | High rate bins dominated by noise | Noise dominated (total time) | Noise dominated (detector-on time) | Marked lightcurve |
|---|---|---|---|---|---|---|---|
| A | 7024 | 5232 | 73 | 73 | 1.04% | 1.40% | 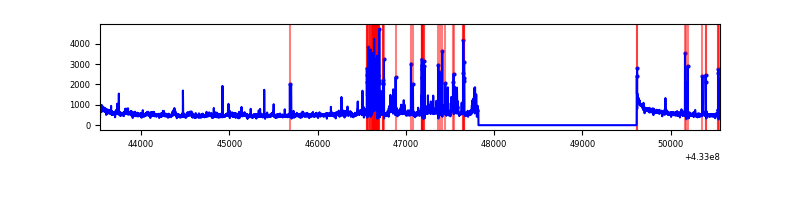 |
| B | 7025 | 5233 | 20 | 20 | 0.28% | 0.38% | 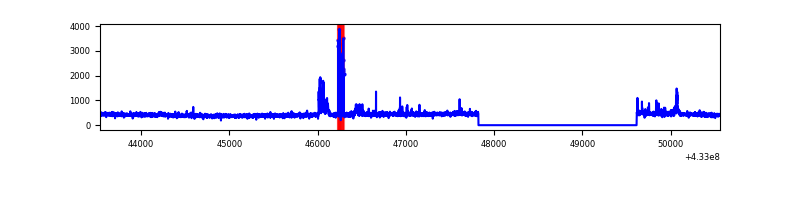 |
| C | 7025 | 5233 | 16 | 16 | 0.23% | 0.31% | 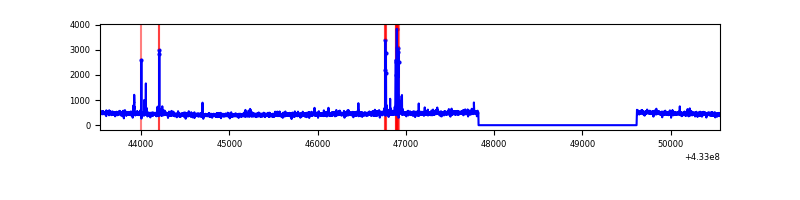 |
| D | 7025 | 5233 | 743 | 743 | 10.58% | 14.20% | 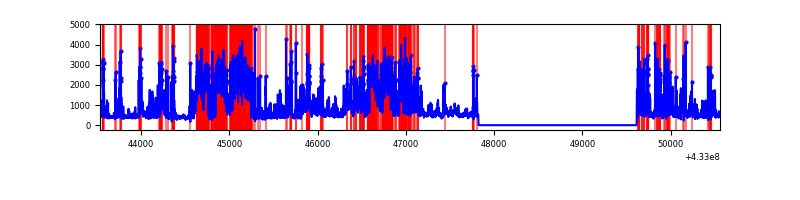 |
Top three noisy pixels from each quadrant. If the there are fewer than three noisy pixels in the level2.evt file, extra rows are filled as -1
| Pixel properties | Quadrant properties | ||||||
|---|---|---|---|---|---|---|---|
| Quadrant | DetID | PixID | Counts | Sigma | Mean | Median | Sigma |
| A | 10 | 83 | 502598 | 4419.61 | 551 | 539 | 113.6 |
| A | 15 | 237 | 281787 | 2475.82 | 551 | 539 | 113.6 |
| A | 15 | 222 | 218082 | 1915.02 | 551 | 539 | 113.6 |
| B | 0 | 229 | 149134 | 1393.36 | 551 | 536 | 106.6 |
| B | 5 | 255 | 35929 | 331.87 | 551 | 536 | 106.6 |
| B | 12 | 111 | 13689 | 123.33 | 551 | 536 | 106.6 |
| C | 15 | 214 | 216685 | 1737.52 | 534 | 535 | 124.4 |
| C | 7 | 220 | 98758 | 789.56 | 534 | 535 | 124.4 |
| C | 14 | 254 | 12808 | 98.66 | 534 | 535 | 124.4 |
| D | 1 | 52 | 1896963 | 15104.76 | 510 | 494 | 125.6 |
| D | 12 | 16 | 916000 | 7291.71 | 510 | 494 | 125.6 |
| D | 13 | 249 | 230996 | 1835.87 | 510 | 494 | 125.6 |
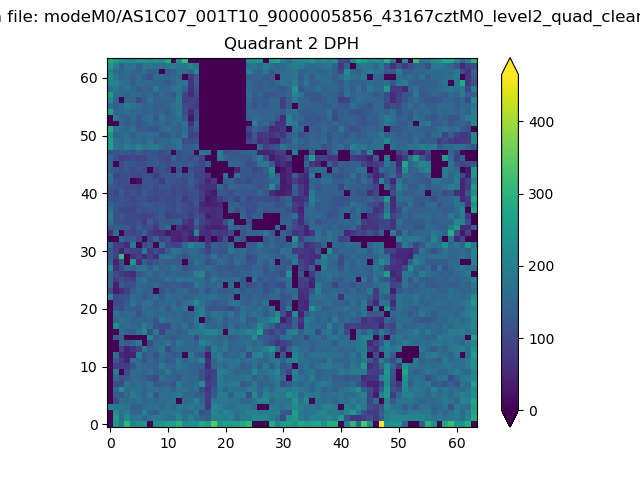
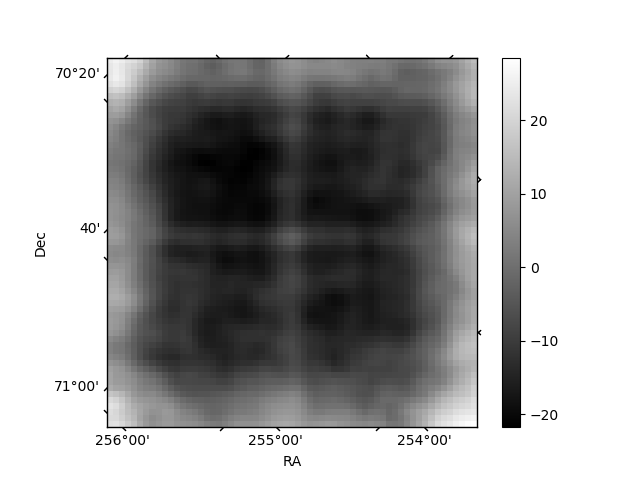
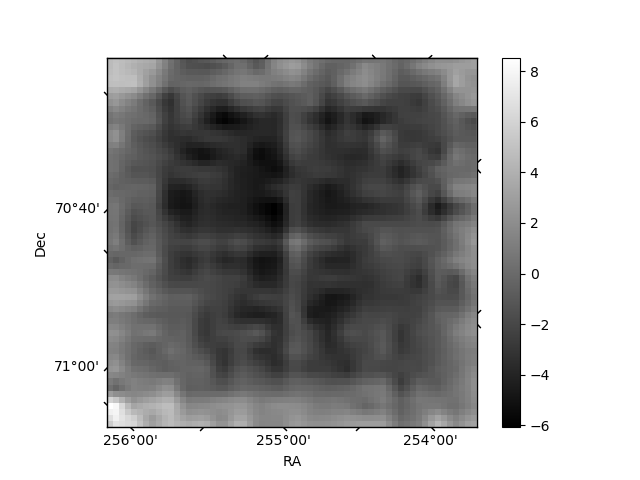
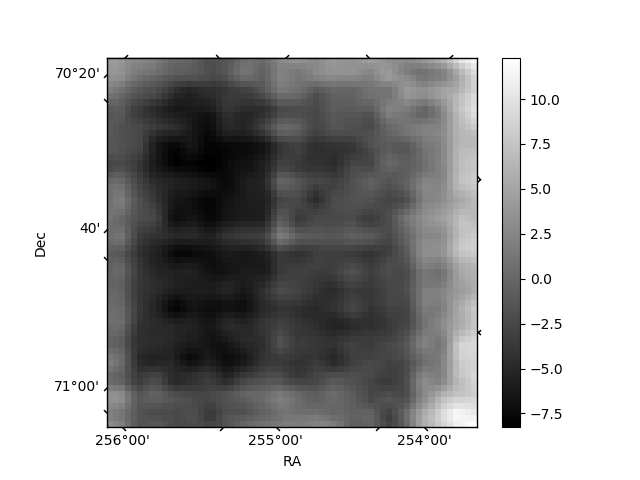
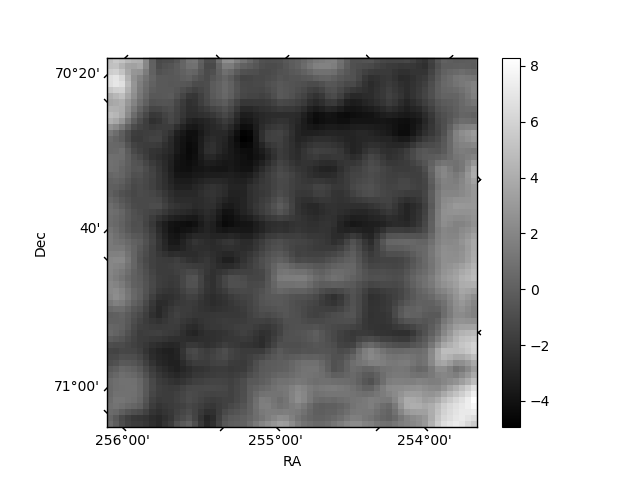
Histogram calculated using DETX and DETY for each event in the final _common_clean file
| Quadrant A | 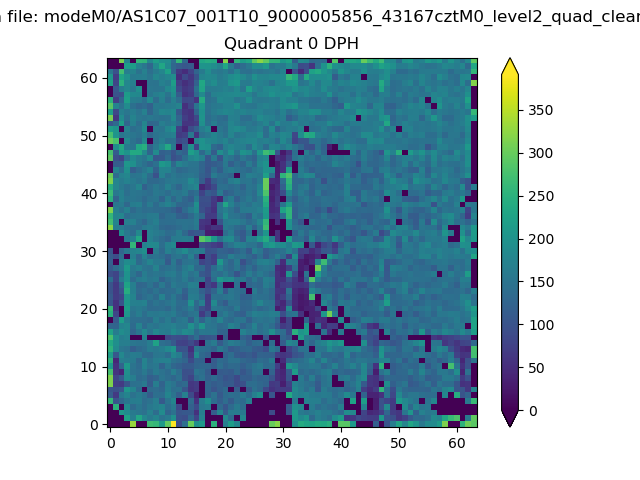 |
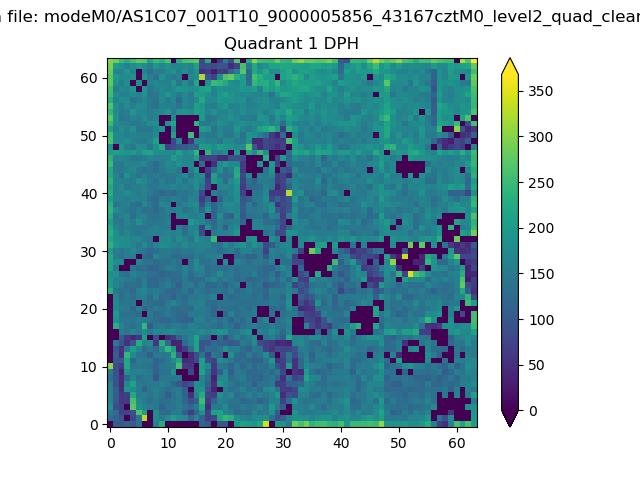 |
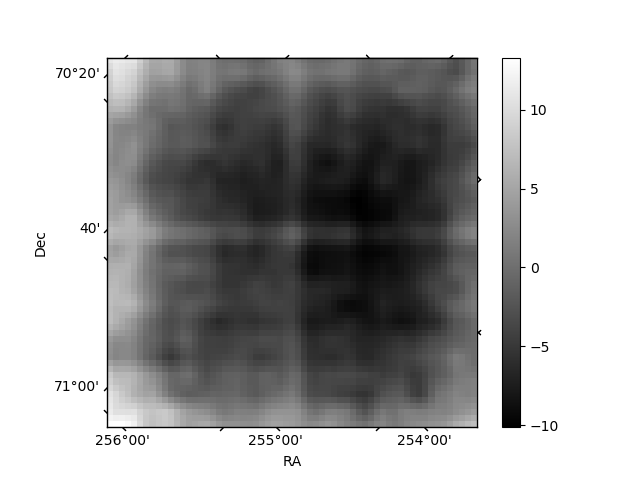
Quadrant B |
|---|---|---|---|
| Quadrant D | 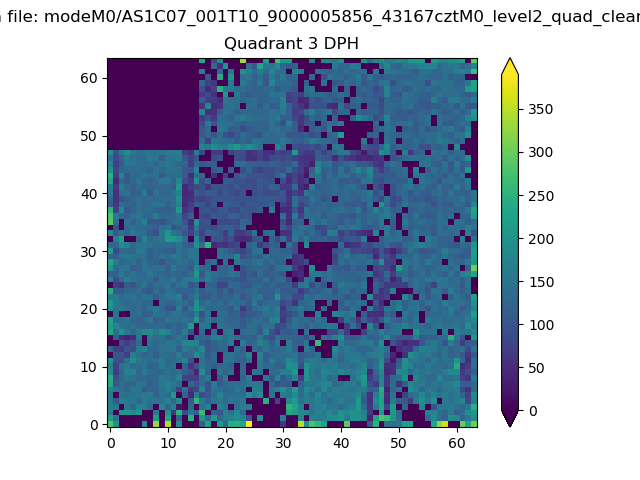 |
 |
Quadrant C |
| Plot type | Count rate plots | Images |
|---|---|---|
| Comparison with Poisson distribution Blue bars denote a histogram of data divided into 1 sec bins. Red curve is a Poisson curve with rate = median count rate of data. |
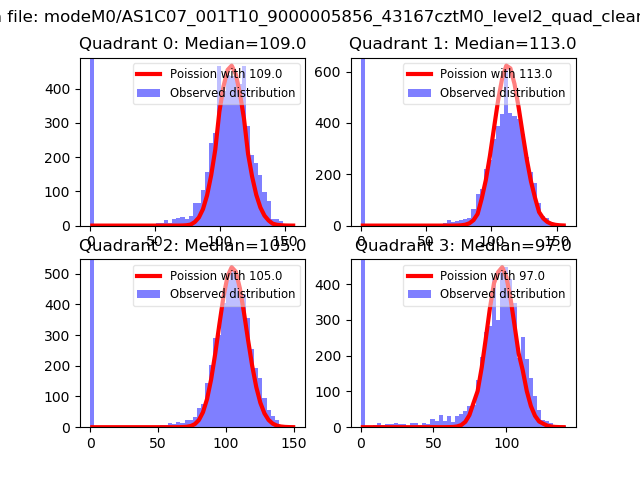 |
 |
| Quadrant-wise count rates Data is divided into 100 sec bins |
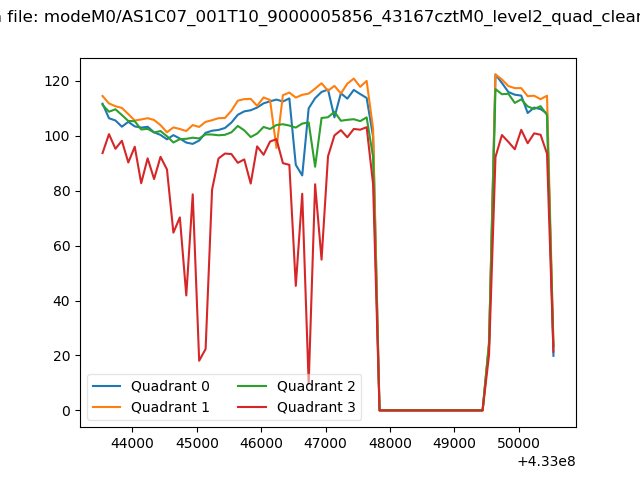 |
|
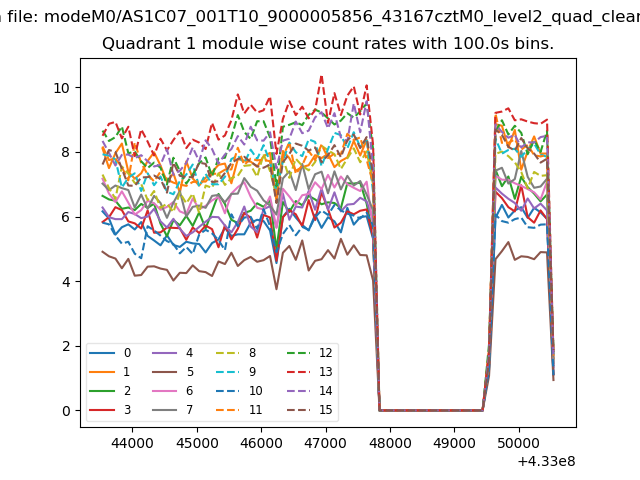
| Module-wise count rates for Quadrant A Data is divided into 100 sec bins |
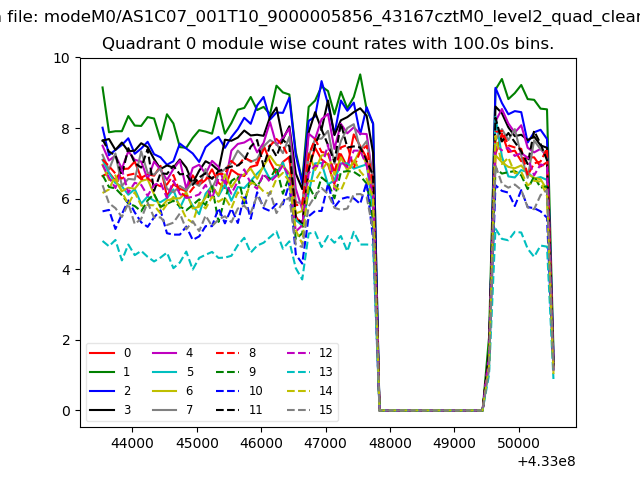 |
 |
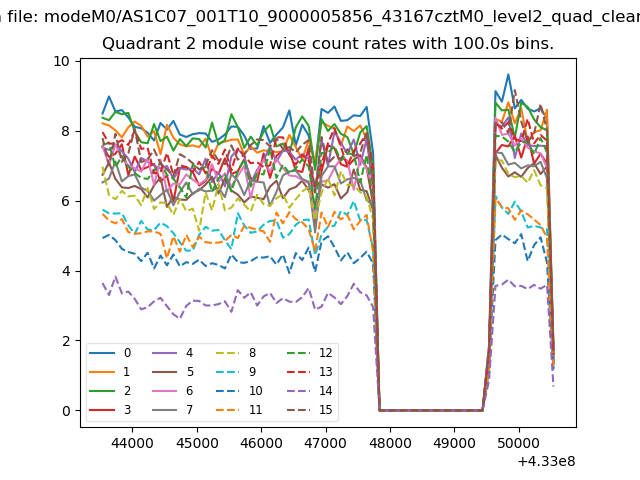
| Module-wise count rates for Quadrant B Data is divided into 100 sec bins |
 |
 |
| Module-wise count rates for Quadrant C Data is divided into 100 sec bins |
 |
 |
| Module-wise count rates for Quadrant D Data is divided into 100 sec bins |
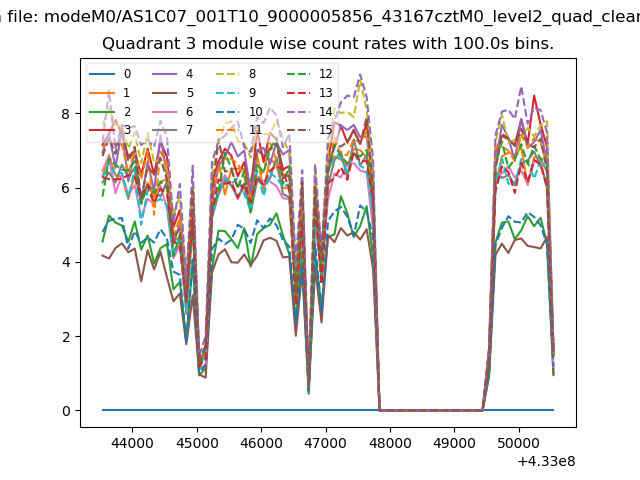 |
 |
| Parameter | Plot |
|---|---|
| CZT HV Monitor | 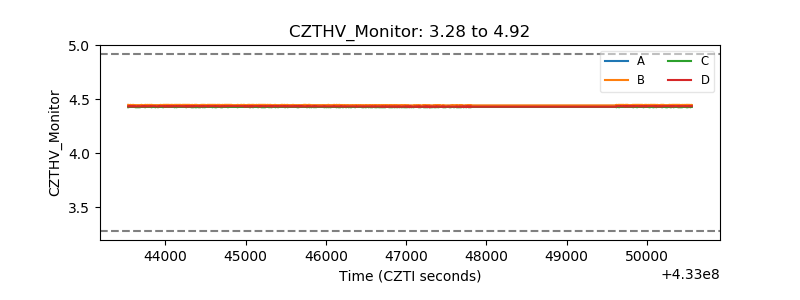 |
| D_VDD |  |
| Temperature 1 | 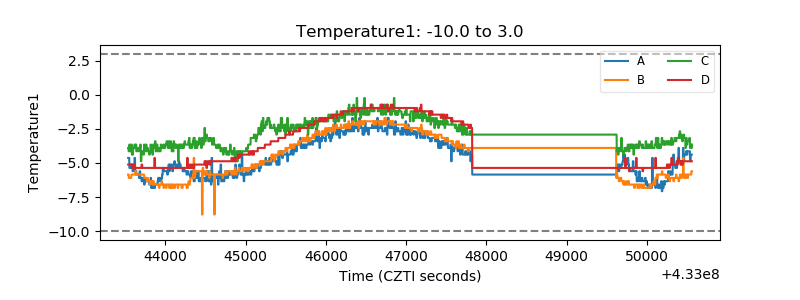 |
| Veto HV Monitor |  |
| Veto LLD | 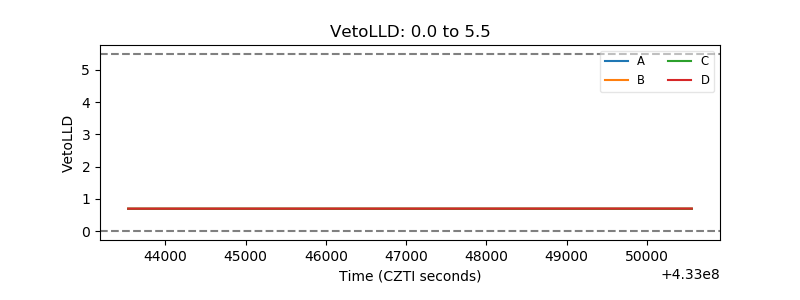 |
| Alpha Counter | 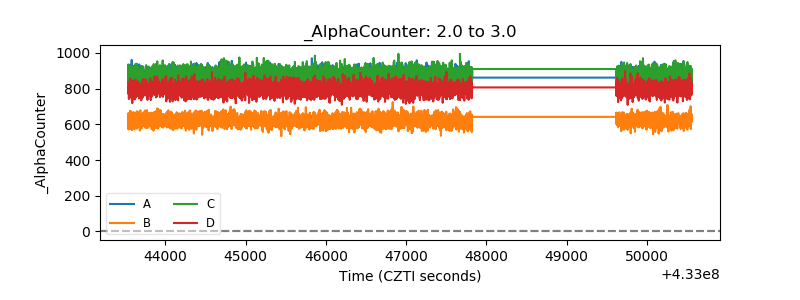 |
| _CPM_Rate | 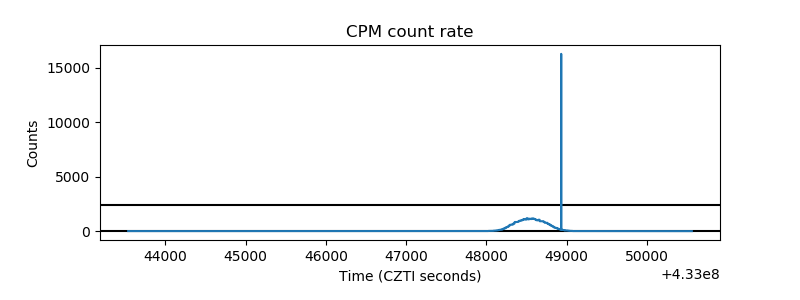 |
| CZT Counter | 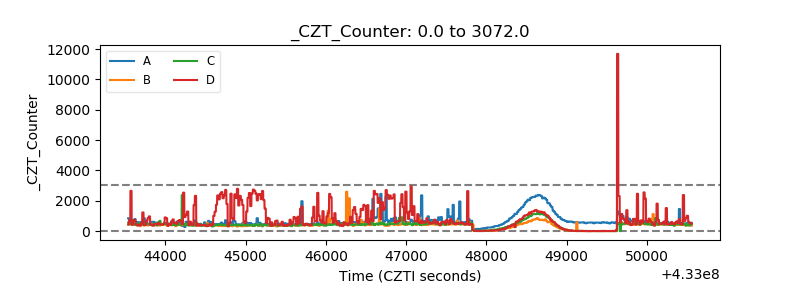 |
| +2.5 Volts monitor | 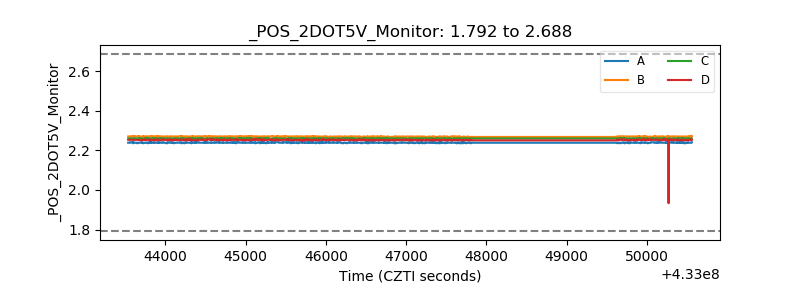 |
| +5 Volts monitor | 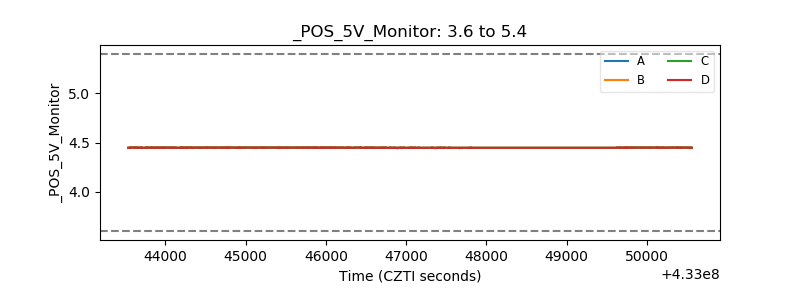 |
| _ROLL_ROT | 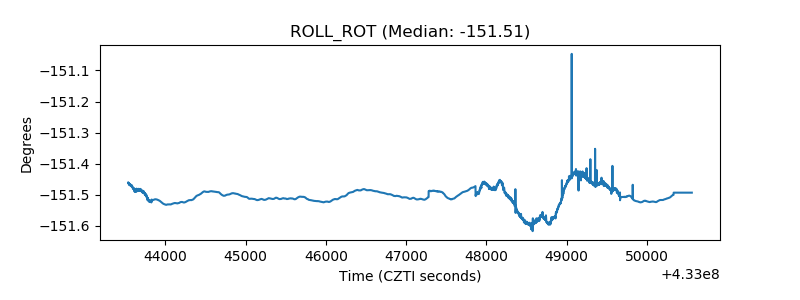 |
| _Roll_DEC | 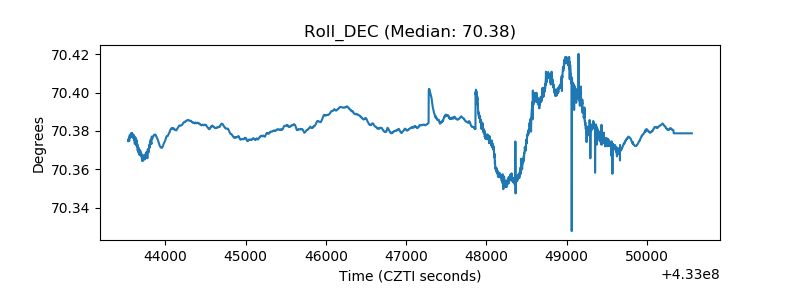 |
| _Roll_RA | 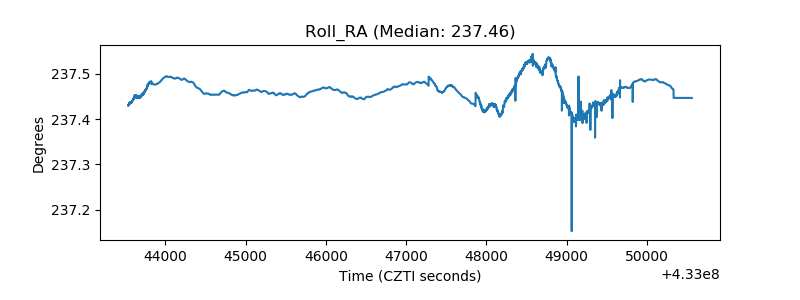 |
| Veto Counter | 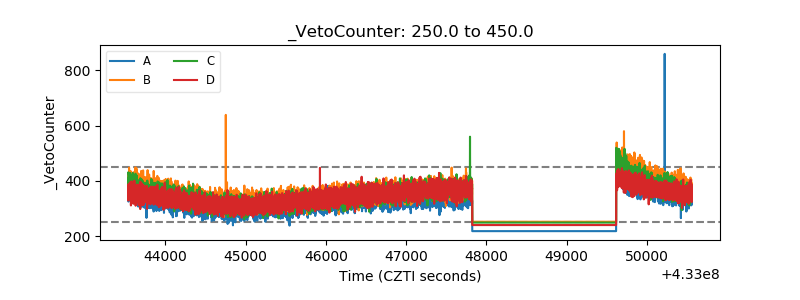 |