| Param | Original file | Final file |
|---|---|---|
| Filename | modeM0/AS1C07_001T10_9000005856_43168cztM0_level2.fits | modeM0/AS1C07_001T10_9000005856_43168cztM0_level2_quad_clean.evt |
| Size (bytes) | 2,067,788,160 | 529,260,480 |
| Size | 1.9 GB | 504.7 MB |
| Events in quadrant A | 20,049,276 | 3,525,599 |
| Events in quadrant B | 15,642,880 | 3,648,092 |
| Events in quadrant C | 15,539,781 | 3,466,601 |
| Events in quadrant D | 22,740,178 | 3,100,212 |
| Mode M9 | |||
|---|---|---|---|
| Quadrant | BADHDUFLAG | Total packets | Discarded packets |
| A | 0 | 109 | 6 |
| B | 0 | 109 | 4 |
| C | 0 | 109 | 5 |
| D | 0 | 109 | 5 |
| Mode SS | |||
|---|---|---|---|
| Quadrant | BADHDUFLAG | Total packets | Discarded packets |
| A | 0 | 688 | 8 |
| B | 0 | 687 | 5 |
| C | 0 | 688 | 8 |
| D | 0 | 688 | 6 |
| Mode M0 | |||
|---|---|---|---|
| Quadrant | BADHDUFLAG | Total packets | Discarded packets |
| A | 0 | 82007 | 1150 |
| B | 0 | 71535 | 724 |
| C | 0 | 69606 | 741 |
| D | 0 | 93197 | 1330 |
| Quadrant | Total seconds | Saturated seconds | Saturation percentage |
|---|---|---|---|
| A | 33219 | 775 | 2.333002% |
| B | 33247 | 377 | 1.133937% |
| C | 33234 | 42 | 0.126377% |
| D | 33218 | 1883 | 5.668613% |
Noise dominated data is calculated using 1-second bins in cleaned event files. If a bin has >2000 counts, and if more than 50% of those come from <1% of pixels, then it is considered to be noise-dominated and hence unusable.
| Quadrant | # 1 sec bins | Bins with >0 counts | Bins with >2000 counts | High rate bins dominated by noise | Noise dominated (total time) | Noise dominated (detector-on time) | Marked lightcurve |
|---|---|---|---|---|---|---|---|
| A | 44486 | 33286 | 519 | 519 | 1.17% | 1.56% | 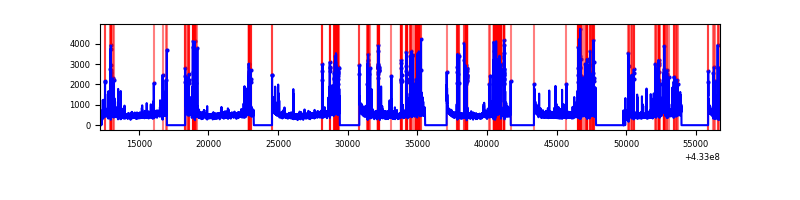 |
| B | 44527 | 33306 | 280 | 280 | 0.63% | 0.84% | 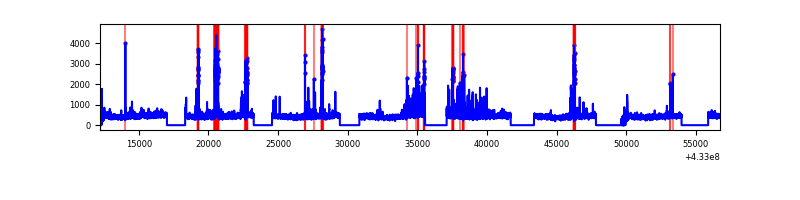 |
| C | 44522 | 33314 | 21 | 21 | 0.05% | 0.06% | 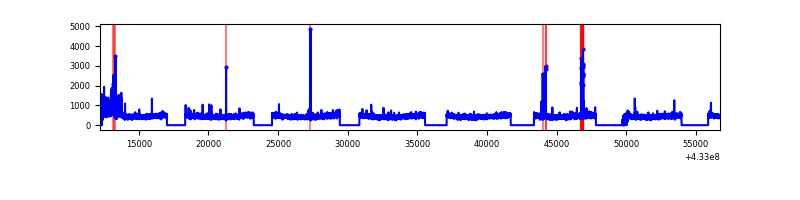 |
| D | 44499 | 33286 | 1644 | 1644 | 3.69% | 4.94% | 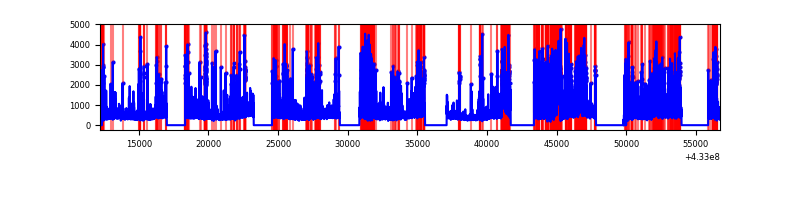 |
Top three noisy pixels from each quadrant. If the there are fewer than three noisy pixels in the level2.evt file, extra rows are filled as -1
| Pixel properties | Quadrant properties | ||||||
|---|---|---|---|---|---|---|---|
| Quadrant | DetID | PixID | Counts | Sigma | Mean | Median | Sigma |
| A | 10 | 83 | 3019991 | 4255.18 | 3503 | 3427 | 708.9 |
| A | 15 | 237 | 1553108 | 2185.99 | 3503 | 3427 | 708.9 |
| A | 15 | 222 | 951807 | 1337.79 | 3503 | 3427 | 708.9 |
| B | 0 | 229 | 1375201 | 2081.53 | 3492 | 3396 | 659.0 |
| B | 0 | 230 | 161722 | 240.24 | 3492 | 3396 | 659.0 |
| B | 0 | 189 | 152156 | 225.72 | 3492 | 3396 | 659.0 |
| C | 15 | 214 | 1403229 | 1773.59 | 3412 | 3425 | 789.3 |
| C | 8 | 79 | 622072 | 783.84 | 3412 | 3425 | 789.3 |
| C | 7 | 220 | 124552 | 153.47 | 3412 | 3425 | 789.3 |
| D | 1 | 52 | 4436465 | 5412.84 | 3366 | 3270 | 819.0 |
| D | 12 | 16 | 1907776 | 2325.36 | 3366 | 3270 | 819.0 |
| D | 1 | 47 | 1287006 | 1567.42 | 3366 | 3270 | 819.0 |
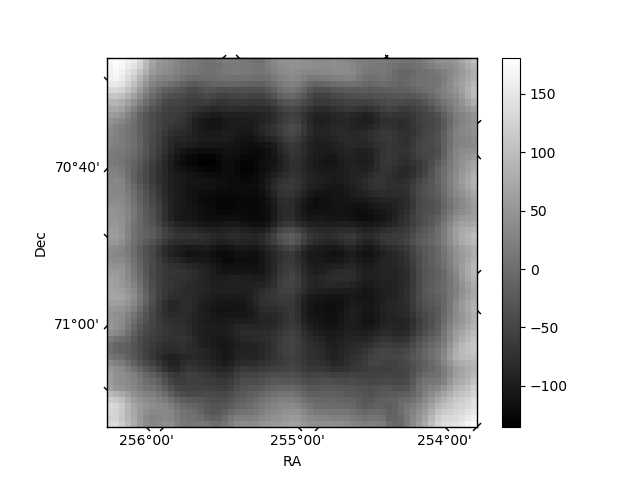
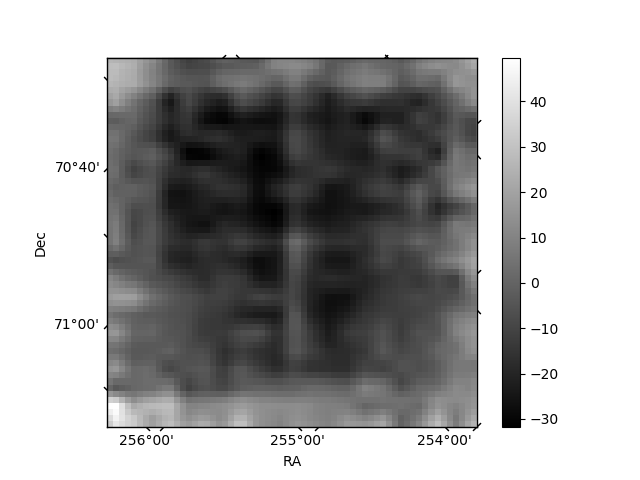
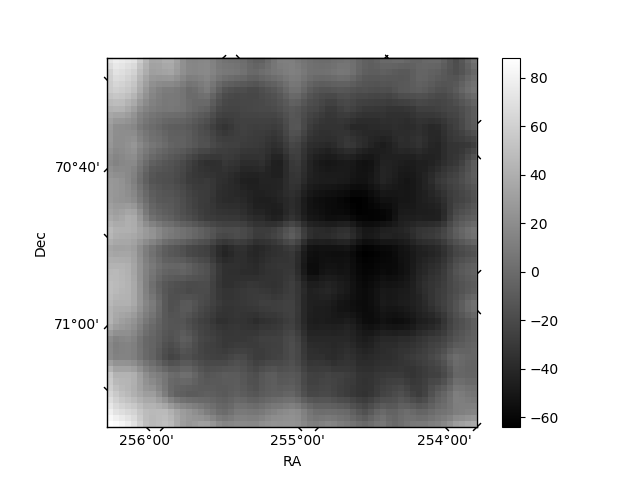
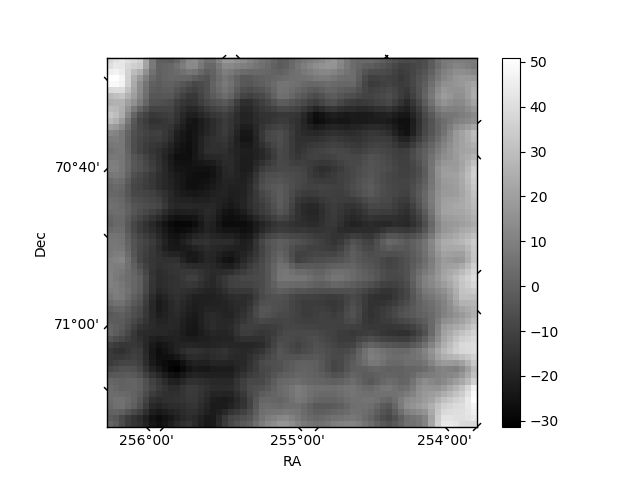
Histogram calculated using DETX and DETY for each event in the final _common_clean file
| Quadrant A | 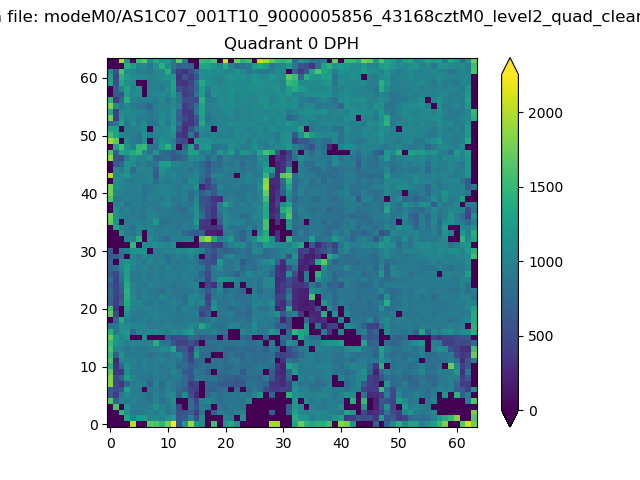 |
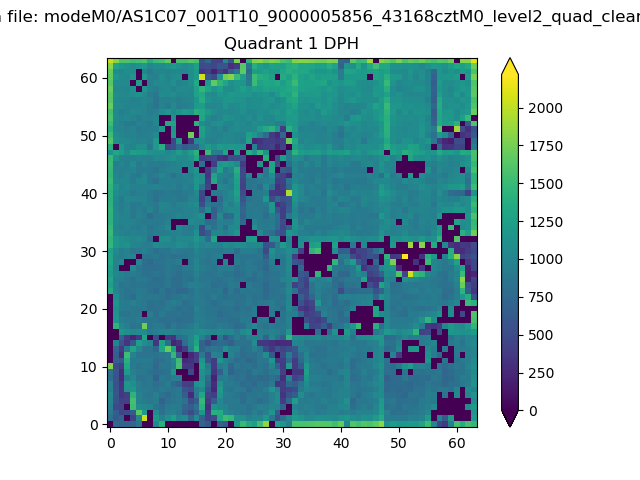 |
Quadrant B |
|---|---|---|---|
| Quadrant D | 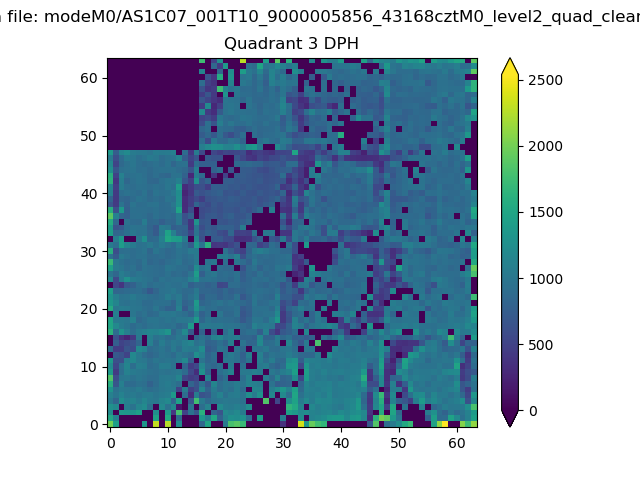 |
 |
Quadrant C |
| Plot type | Count rate plots | Images |
|---|---|---|
| Comparison with Poisson distribution Blue bars denote a histogram of data divided into 1 sec bins. Red curve is a Poisson curve with rate = median count rate of data. |
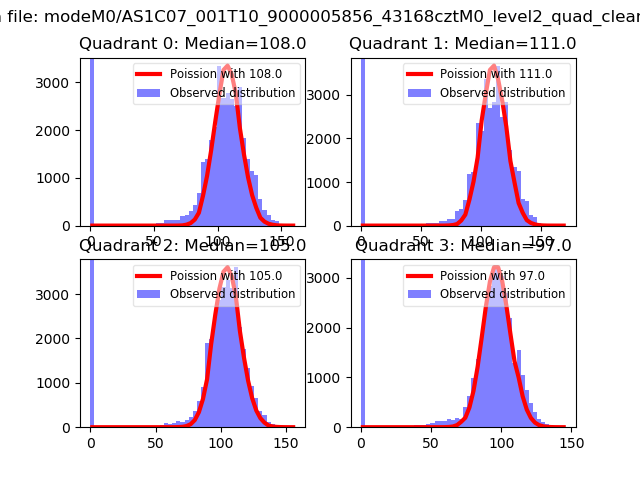 |
 |
| Quadrant-wise count rates Data is divided into 100 sec bins |
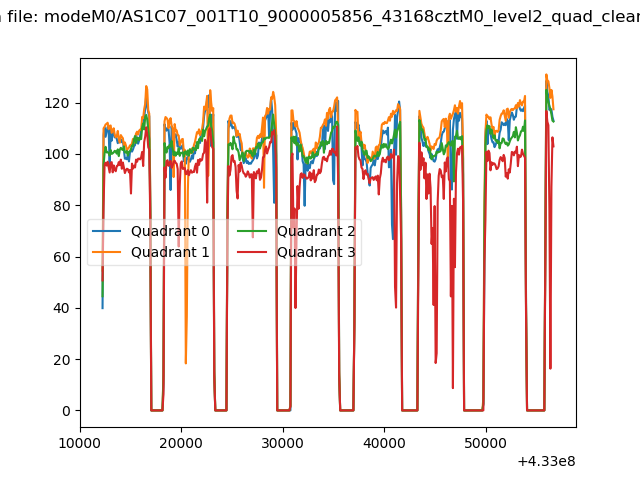 |
|
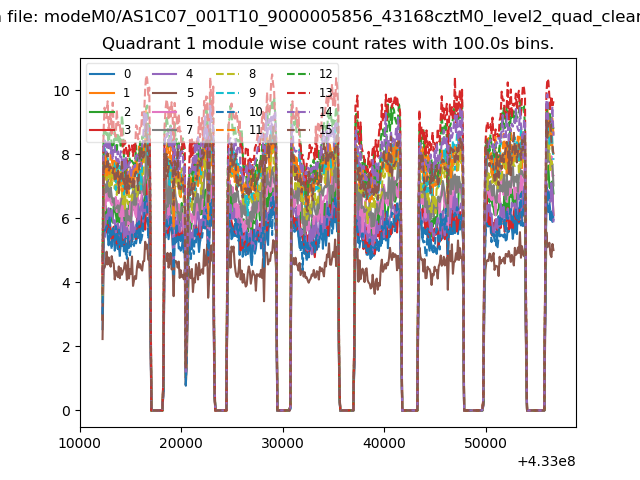
| Module-wise count rates for Quadrant A Data is divided into 100 sec bins |
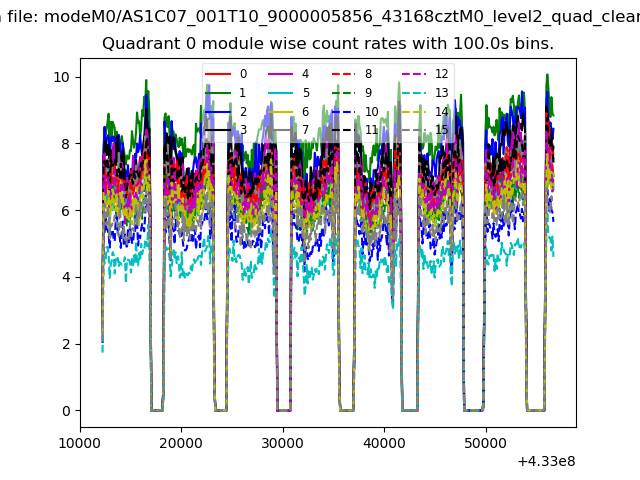 |
 |
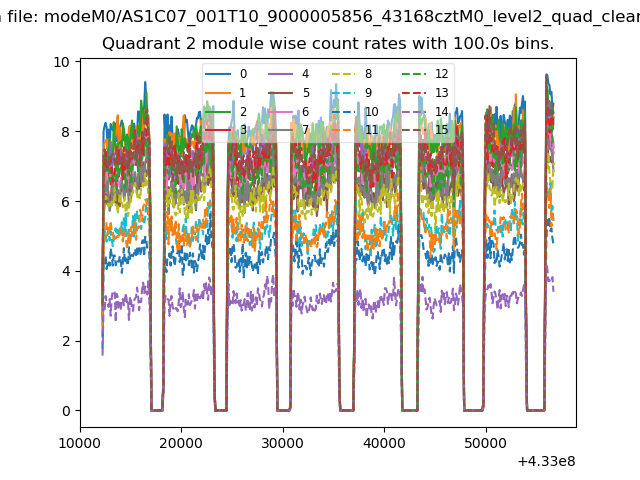
| Module-wise count rates for Quadrant B Data is divided into 100 sec bins |
 |
 |
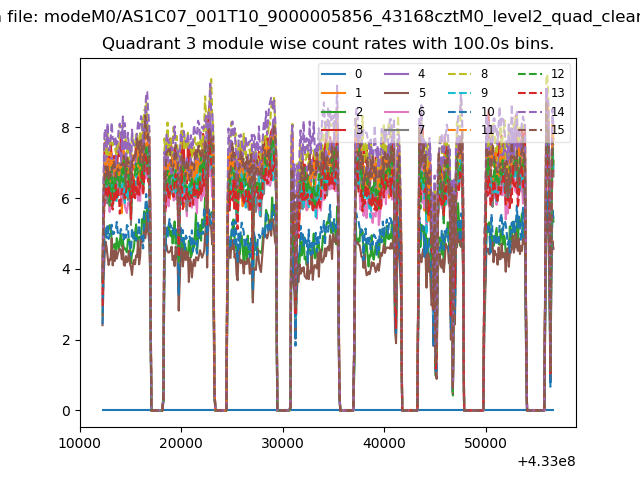
| Module-wise count rates for Quadrant C Data is divided into 100 sec bins |
 |
 |
| Module-wise count rates for Quadrant D Data is divided into 100 sec bins |
 |
 |
| Parameter | Plot |
|---|---|
| CZT HV Monitor | 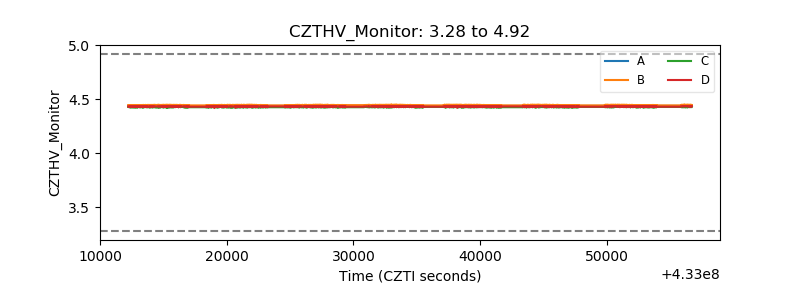 |
| D_VDD | 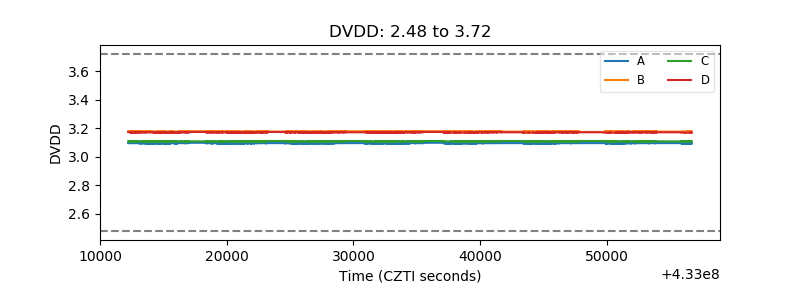 |
| Temperature 1 | 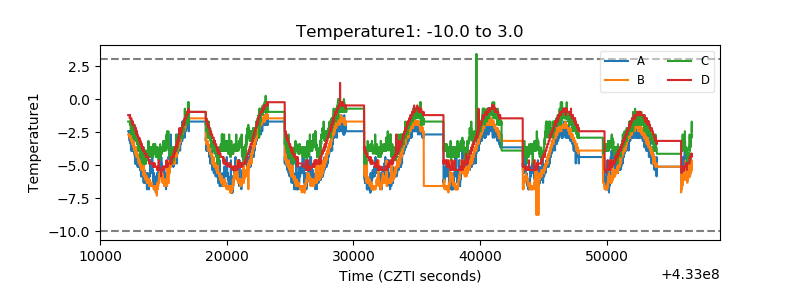 |
| Veto HV Monitor | 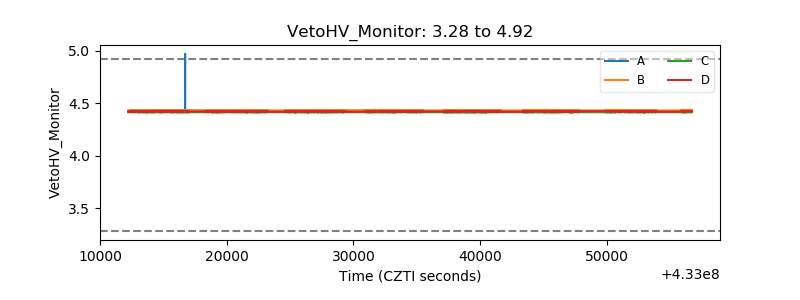 |
| Veto LLD | 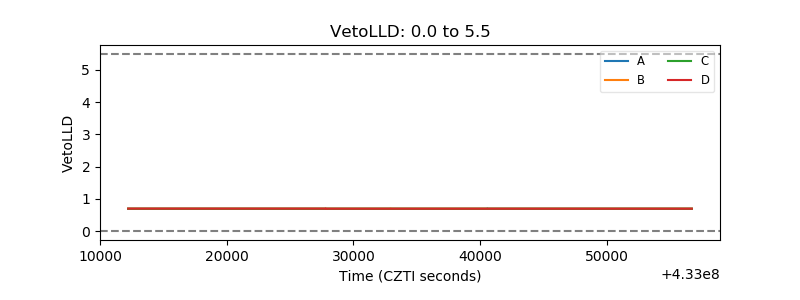 |
| Alpha Counter | 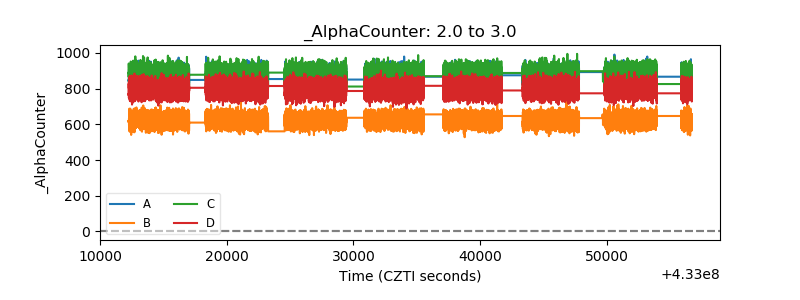 |
| _CPM_Rate | 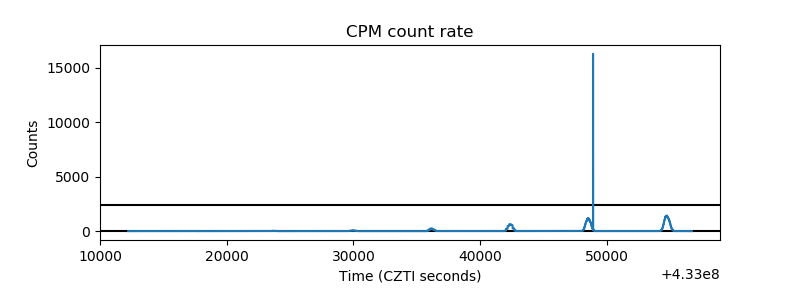 |
| CZT Counter | 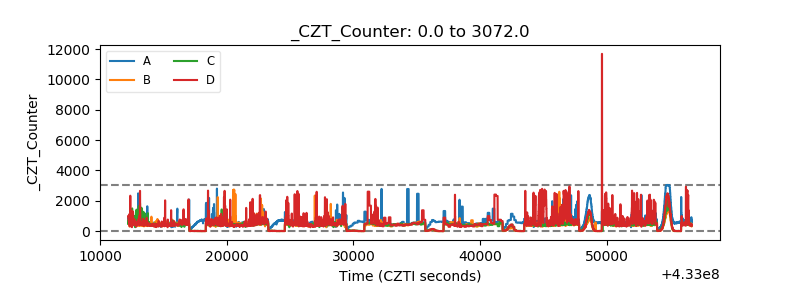 |
| +2.5 Volts monitor | 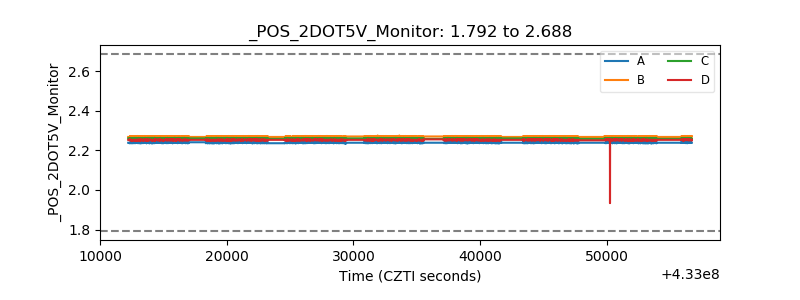 |
| +5 Volts monitor | 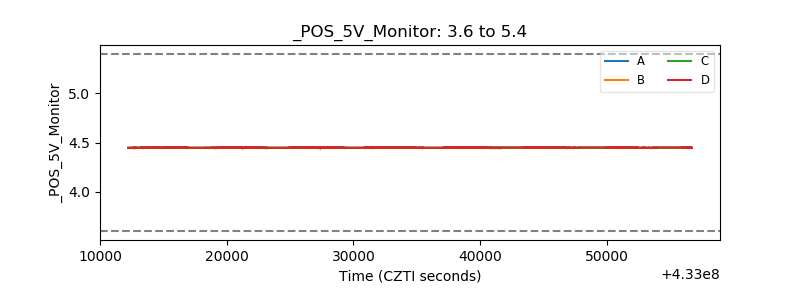 |
| _ROLL_ROT | 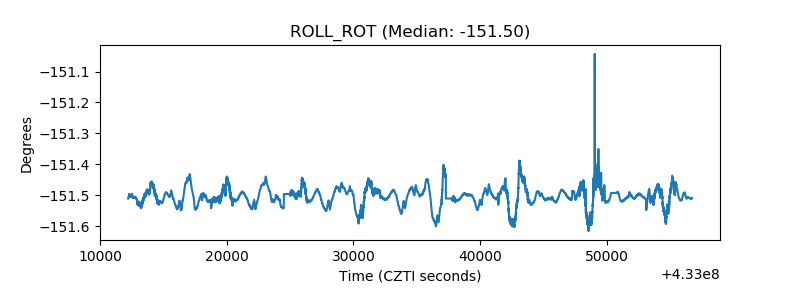 |
| _Roll_DEC | 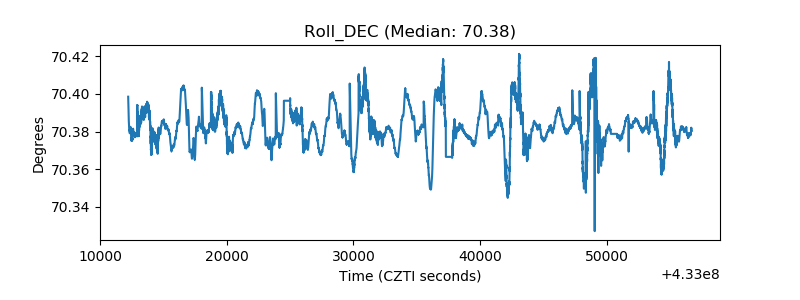 |
| _Roll_RA | 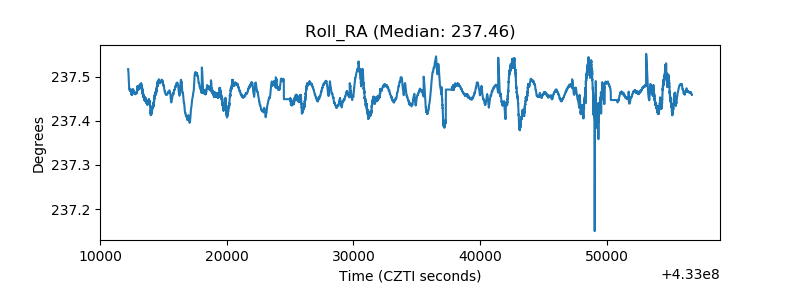 |
| Veto Counter | 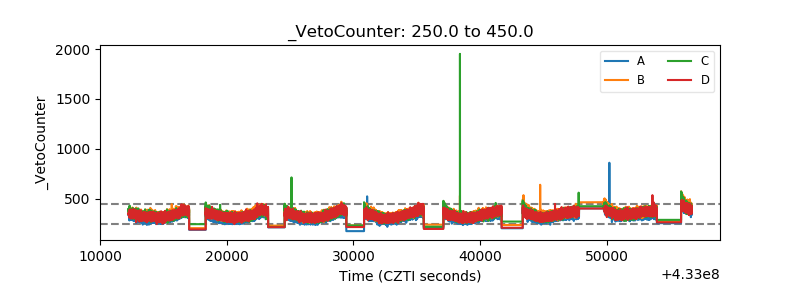 |