| Param | Original file | Final file |
|---|---|---|
| Filename | modeM0/AS1C07_001T10_9000005856_43169cztM0_level2.fits | modeM0/AS1C07_001T10_9000005856_43169cztM0_level2_quad_clean.evt |
| Size (bytes) | 286,678,080 | 80,619,840 |
| Size | 273.4 MB | 76.9 MB |
| Events in quadrant A | 3,001,225 | 549,691 |
| Events in quadrant B | 2,119,647 | 568,805 |
| Events in quadrant C | 2,151,182 | 522,066 |
| Events in quadrant D | 2,974,213 | 471,338 |
| Mode M9 | |||
|---|---|---|---|
| Quadrant | BADHDUFLAG | Total packets | Discarded packets |
| A | 0 | 20 | 0 |
| B | 0 | 20 | 0 |
| C | 0 | 20 | 0 |
| D | 0 | 20 | 0 |
| Mode SS | |||
|---|---|---|---|
| Quadrant | BADHDUFLAG | Total packets | Discarded packets |
| A | 0 | 102 | 4 |
| B | 0 | 102 | 4 |
| C | 0 | 101 | 5 |
| D | 0 | 102 | 4 |
| Mode M0 | |||
|---|---|---|---|
| Quadrant | BADHDUFLAG | Total packets | Discarded packets |
| A | 0 | 12257 | 623 |
| B | 0 | 10041 | 436 |
| C | 0 | 9853 | 456 |
| D | 0 | 12541 | 495 |
| Quadrant | Total seconds | Saturated seconds | Saturation percentage |
|---|---|---|---|
| A | 4687 | 127 | 2.709622% |
| B | 4687 | 6 | 0.128014% |
| C | 4677 | 2 | 0.042762% |
| D | 4678 | 244 | 5.215904% |
Noise dominated data is calculated using 1-second bins in cleaned event files. If a bin has >2000 counts, and if more than 50% of those come from <1% of pixels, then it is considered to be noise-dominated and hence unusable.
| Quadrant | # 1 sec bins | Bins with >0 counts | Bins with >2000 counts | High rate bins dominated by noise | Noise dominated (total time) | Noise dominated (detector-on time) | Marked lightcurve |
|---|---|---|---|---|---|---|---|
| A | 6852 | 4706 | 91 | 91 | 1.33% | 1.93% | 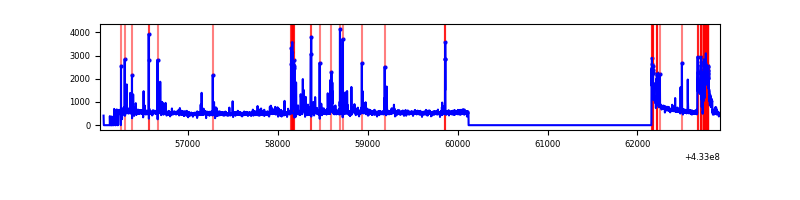 |
| B | 6892 | 4717 | 0 | 0 | 0.00% | 0.00% |  |
| C | 6782 | 4705 | 1 | 1 | 0.01% | 0.02% |  |
| D | 6776 | 4703 | 208 | 208 | 3.07% | 4.42% |  |
Top three noisy pixels from each quadrant. If the there are fewer than three noisy pixels in the level2.evt file, extra rows are filled as -1
| Pixel properties | Quadrant properties | ||||||
|---|---|---|---|---|---|---|---|
| Quadrant | DetID | PixID | Counts | Sigma | Mean | Median | Sigma |
| A | 10 | 83 | 455125 | 4305.0 | 519 | 507 | 105.6 |
| A | 15 | 237 | 362882 | 3431.5 | 519 | 507 | 105.6 |
| A | 15 | 222 | 98194 | 925.05 | 519 | 507 | 105.6 |
| B | 5 | 255 | 61673 | 618.3 | 515 | 502 | 98.9 |
| B | 0 | 186 | 30393 | 302.13 | 515 | 502 | 98.9 |
| B | 12 | 111 | 12188 | 118.12 | 515 | 502 | 98.9 |
| C | 15 | 214 | 193540 | 1681.03 | 495 | 499 | 114.8 |
| C | 7 | 220 | 14272 | 119.94 | 495 | 499 | 114.8 |
| C | 14 | 254 | 7322 | 59.42 | 495 | 499 | 114.8 |
| D | 13 | 249 | 410243 | 3451.0 | 491 | 477 | 118.7 |
| D | 1 | 52 | 367917 | 3094.54 | 491 | 477 | 118.7 |
| D | 12 | 233 | 155881 | 1308.79 | 491 | 477 | 118.7 |
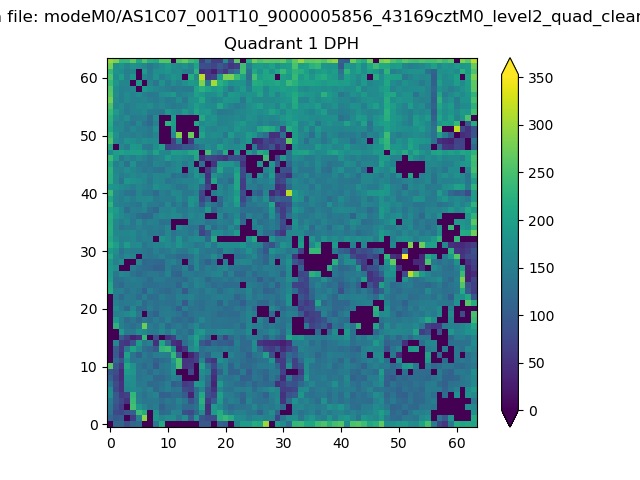
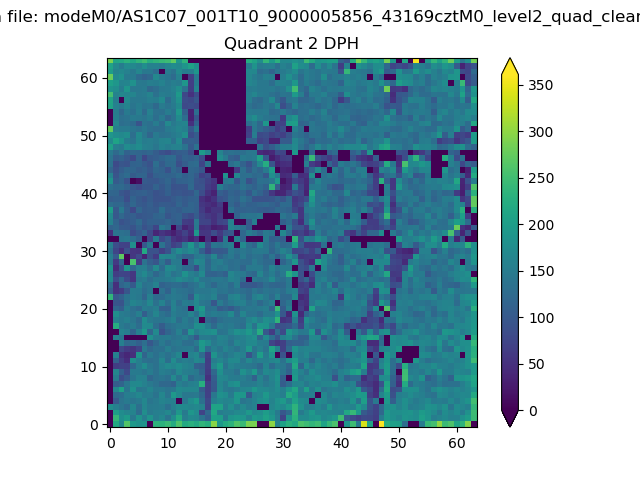
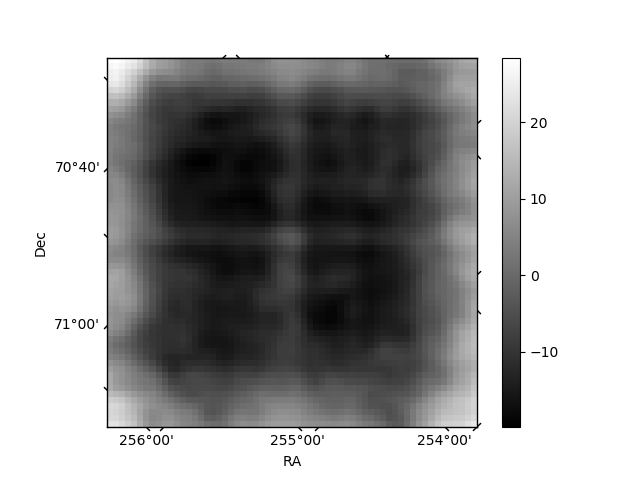
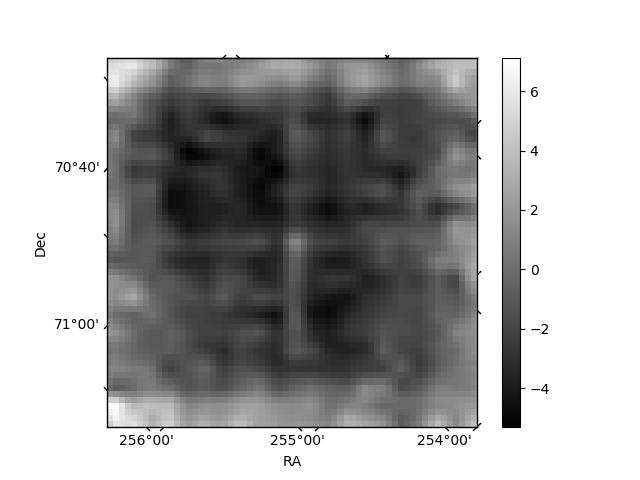
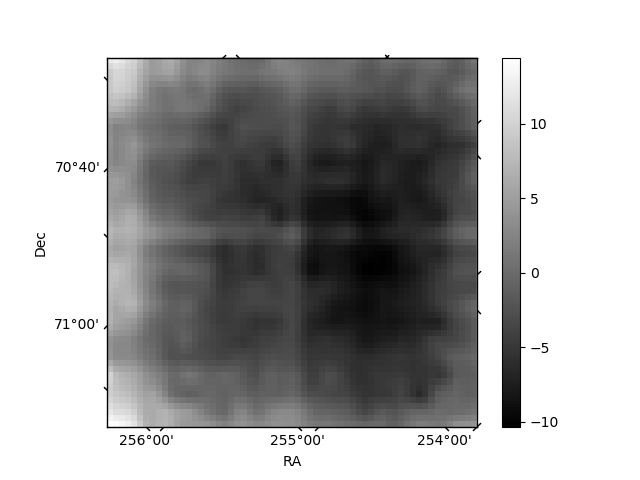
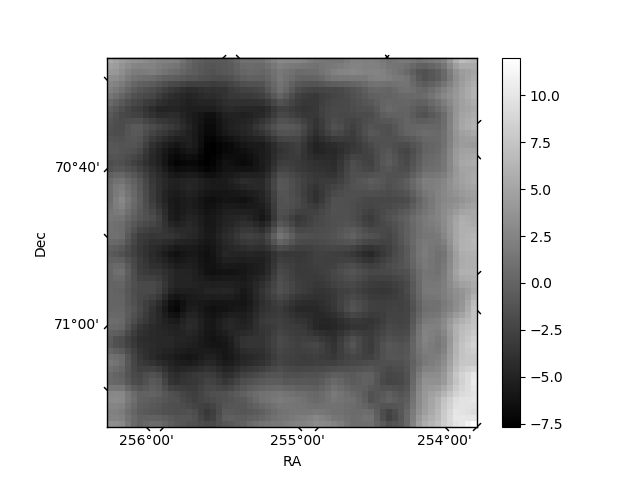
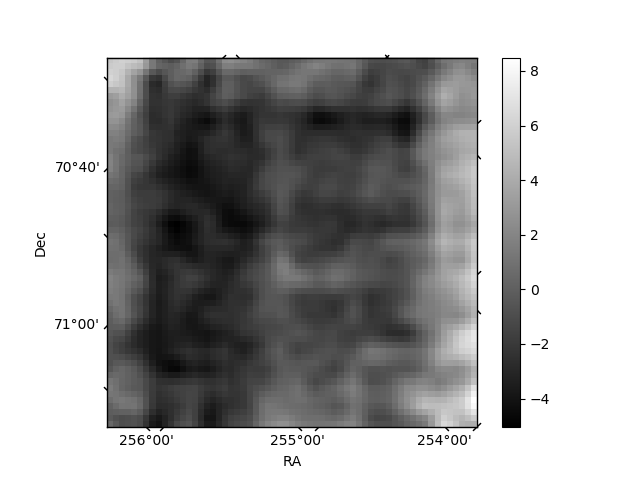
Histogram calculated using DETX and DETY for each event in the final _common_clean file
| Quadrant A | 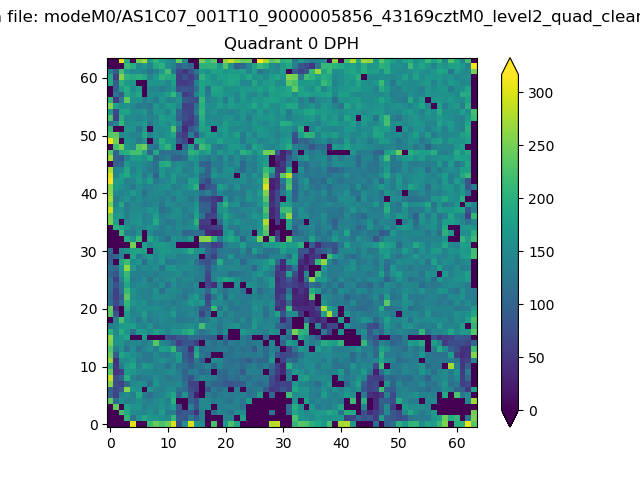 |
 |
Quadrant B |
|---|---|---|---|
| Quadrant D | 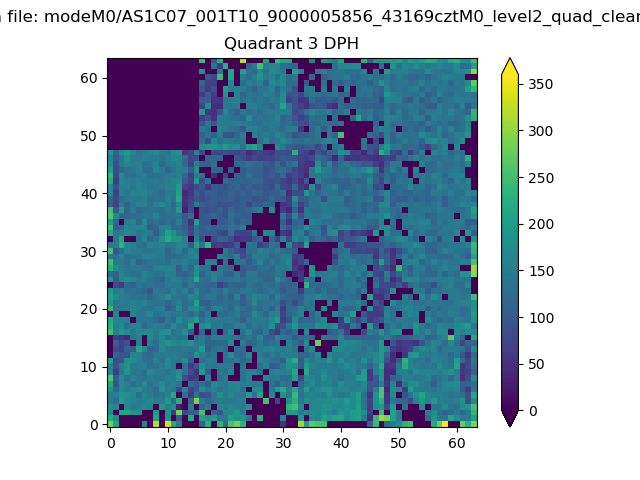 |
 |
Quadrant C |
| Plot type | Count rate plots | Images |
|---|---|---|
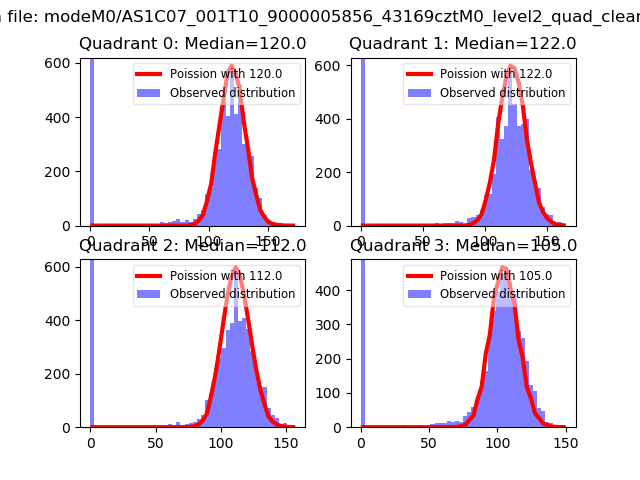
| Comparison with Poisson distribution Blue bars denote a histogram of data divided into 1 sec bins. Red curve is a Poisson curve with rate = median count rate of data. |
 |
 |
| Quadrant-wise count rates Data is divided into 100 sec bins |
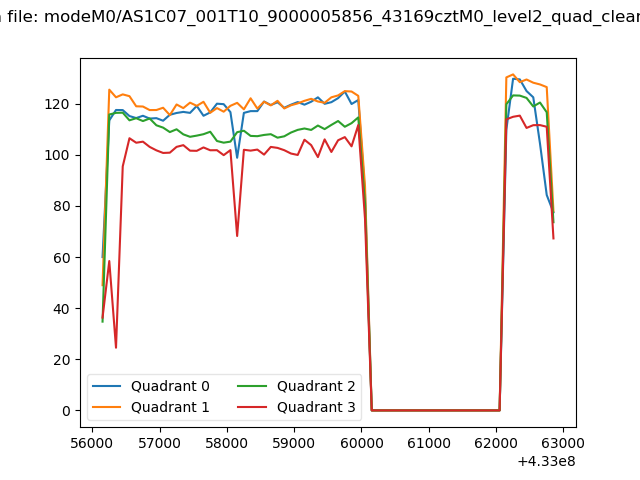 |
|
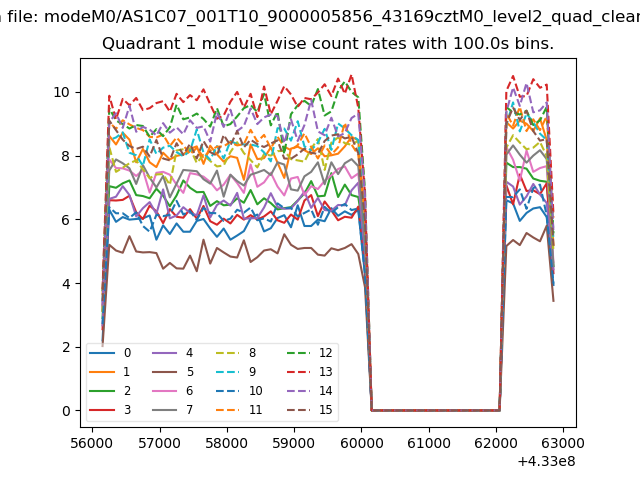
| Module-wise count rates for Quadrant A Data is divided into 100 sec bins |
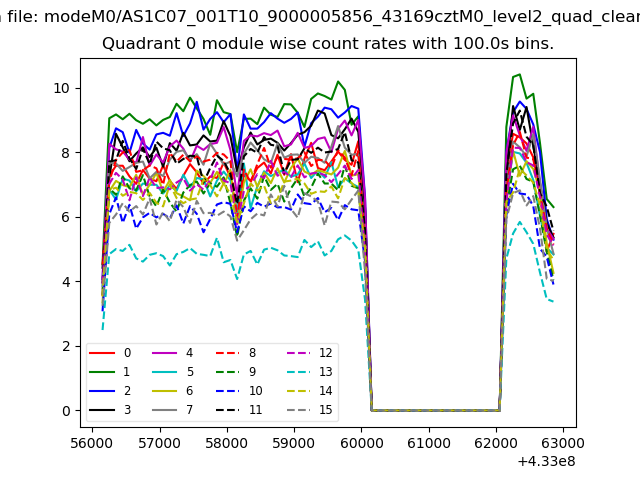 |
 |
| Module-wise count rates for Quadrant B Data is divided into 100 sec bins |
 |
 |
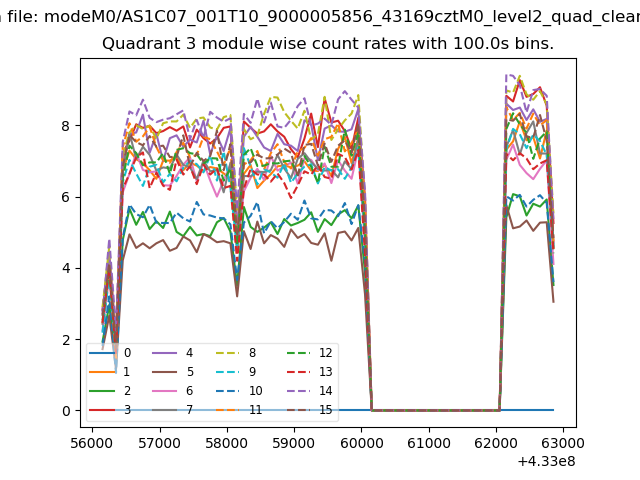
| Module-wise count rates for Quadrant C Data is divided into 100 sec bins |
 |
 |
| Module-wise count rates for Quadrant D Data is divided into 100 sec bins |
 |
 |
| Parameter | Plot |
|---|---|
| CZT HV Monitor |  |
| D_VDD | 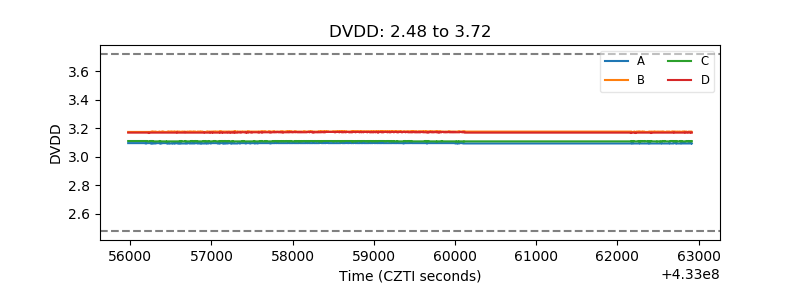 |
| Temperature 1 | 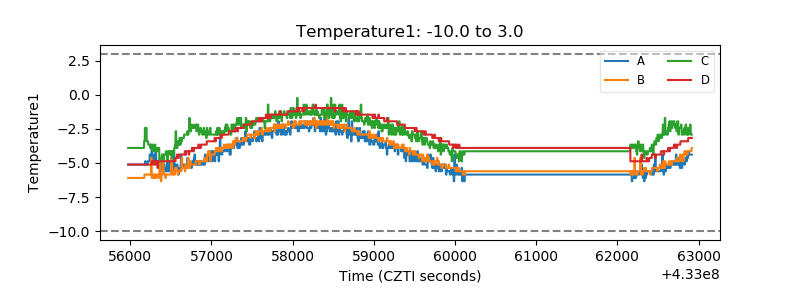 |
| Veto HV Monitor | 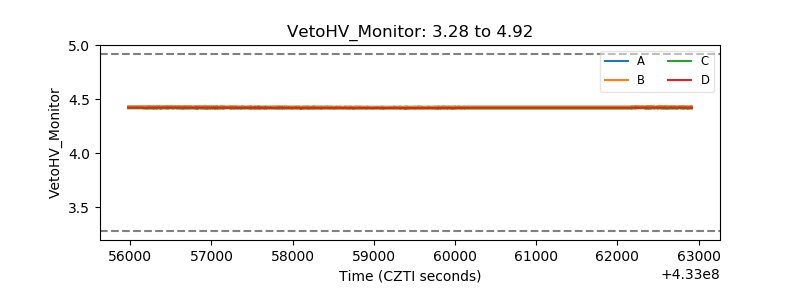 |
| Veto LLD | 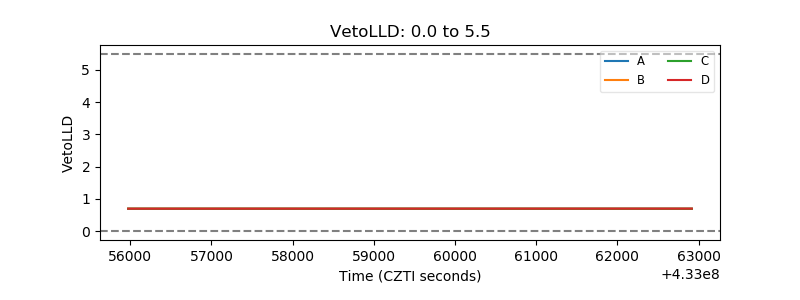 |
| Alpha Counter | 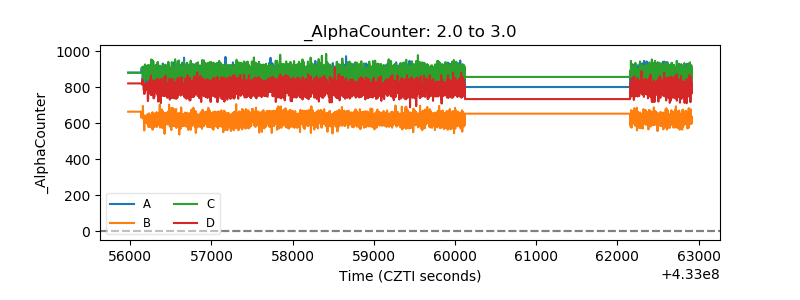 |
| _CPM_Rate | 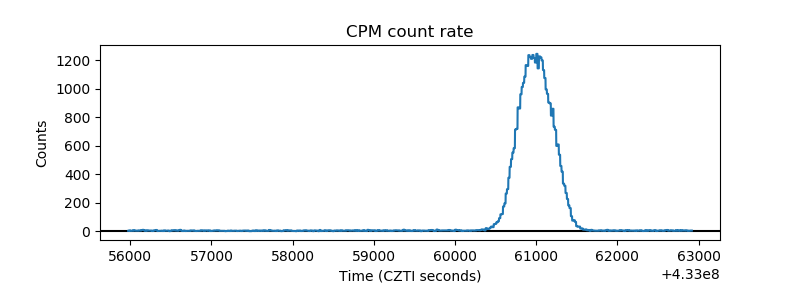 |
| CZT Counter | 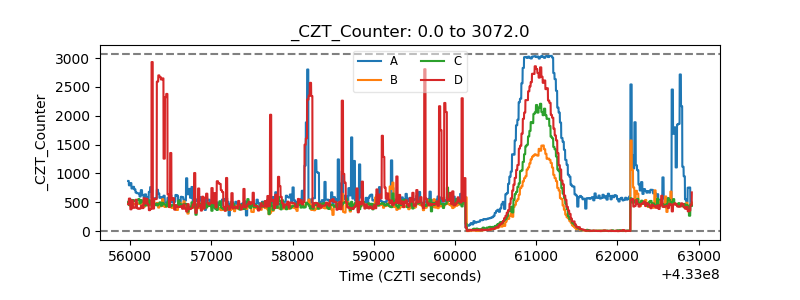 |
| +2.5 Volts monitor | 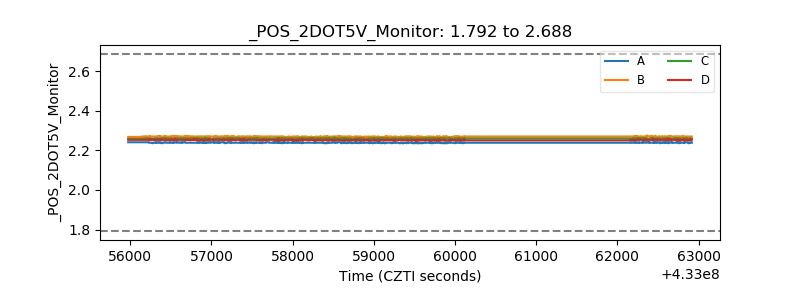 |
| +5 Volts monitor | 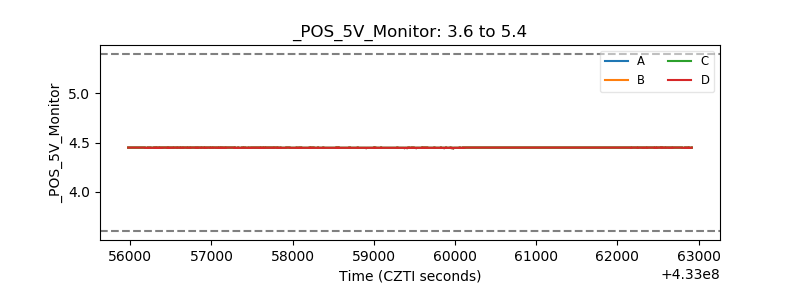 |
| _ROLL_ROT | 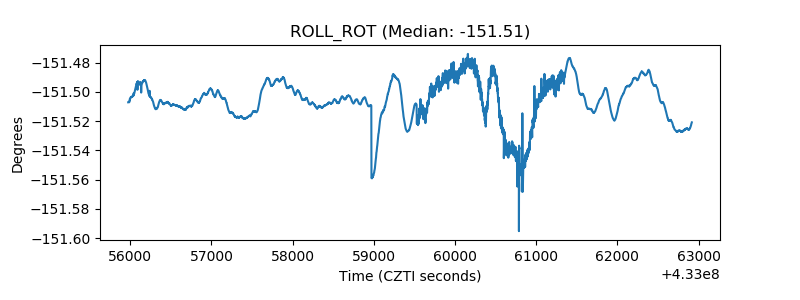 |
| _Roll_DEC | 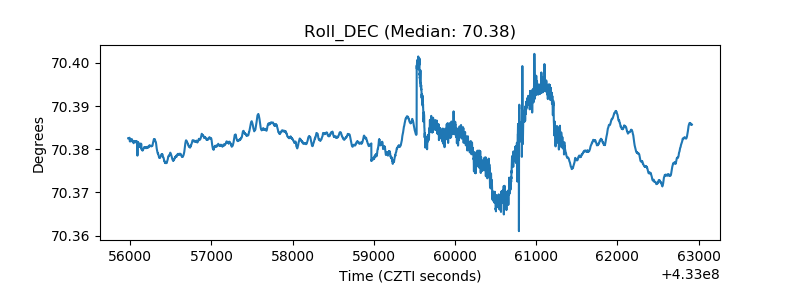 |
| _Roll_RA | 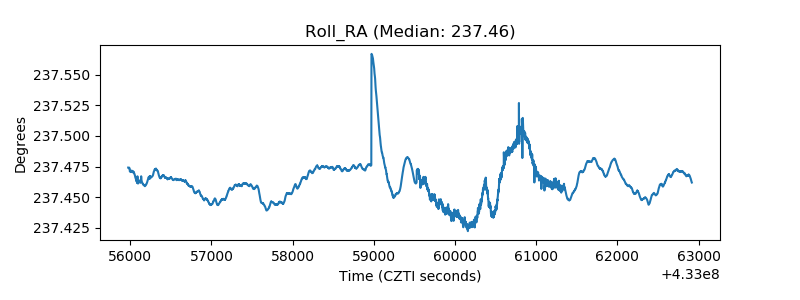 |
| Veto Counter | 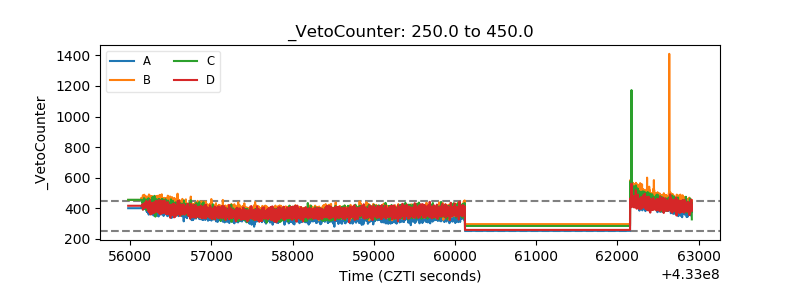 |