| Param | Original file | Final file |
|---|---|---|
| Filename | modeM0/AS1C07_001T10_9000005856_43170cztM0_level2.fits | modeM0/AS1C07_001T10_9000005856_43170cztM0_level2_quad_clean.evt |
| Size (bytes) | 319,083,840 | 86,037,120 |
| Size | 304.3 MB | 82.1 MB |
| Events in quadrant A | 3,625,892 | 580,332 |
| Events in quadrant B | 2,275,965 | 609,072 |
| Events in quadrant C | 2,296,315 | 552,609 |
| Events in quadrant D | 3,231,955 | 520,411 |
| Mode M9 | |||
|---|---|---|---|
| Quadrant | BADHDUFLAG | Total packets | Discarded packets |
| A | 0 | 24 | 0 |
| B | 0 | 24 | 0 |
| C | 0 | 25 | 1 |
| D | 0 | 25 | 0 |
| Mode SS | |||
|---|---|---|---|
| Quadrant | BADHDUFLAG | Total packets | Discarded packets |
| A | 0 | 98 | 0 |
| B | 0 | 98 | 0 |
| C | 0 | 98 | 0 |
| D | 0 | 98 | 0 |
| Mode M0 | |||
|---|---|---|---|
| Quadrant | BADHDUFLAG | Total packets | Discarded packets |
| A | 0 | 13805 | 2 |
| B | 0 | 10068 | 2 |
| C | 0 | 9922 | 2 |
| D | 0 | 12964 | 2 |
| Quadrant | Total seconds | Saturated seconds | Saturation percentage |
|---|---|---|---|
| A | 4895 | 198 | 4.044944% |
| B | 4895 | 6 | 0.122574% |
| C | 4895 | 5 | 0.102145% |
| D | 4895 | 72 | 1.470889% |
Noise dominated data is calculated using 1-second bins in cleaned event files. If a bin has >2000 counts, and if more than 50% of those come from <1% of pixels, then it is considered to be noise-dominated and hence unusable.
| Quadrant | # 1 sec bins | Bins with >0 counts | Bins with >2000 counts | High rate bins dominated by noise | Noise dominated (total time) | Noise dominated (detector-on time) | Marked lightcurve |
|---|---|---|---|---|---|---|---|
| A | 7018 | 4896 | 172 | 172 | 2.45% | 3.51% | 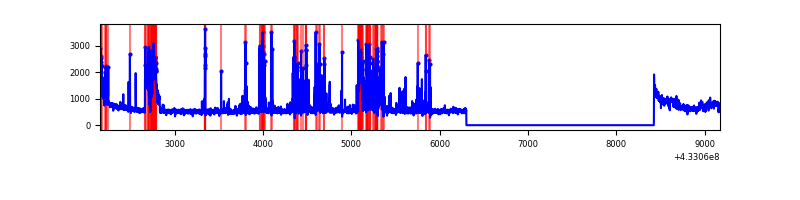 |
| B | 7018 | 4896 | 0 | 0 | 0.00% | 0.00% | 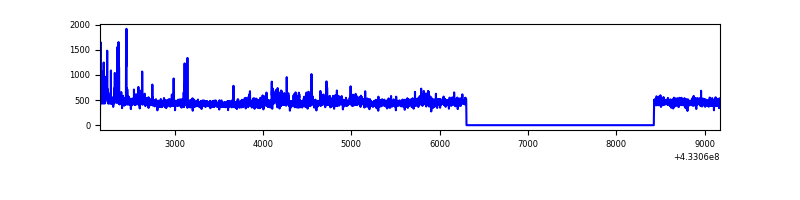 |
| C | 7018 | 4896 | 1 | 1 | 0.01% | 0.02% | 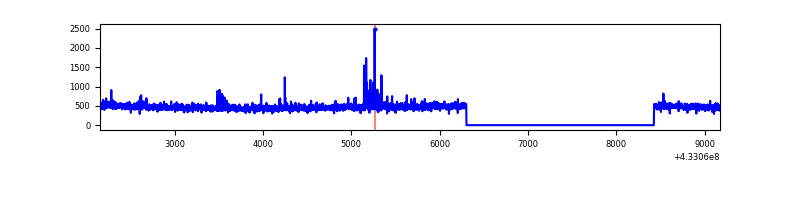 |
| D | 7018 | 4896 | 73 | 73 | 1.04% | 1.49% | 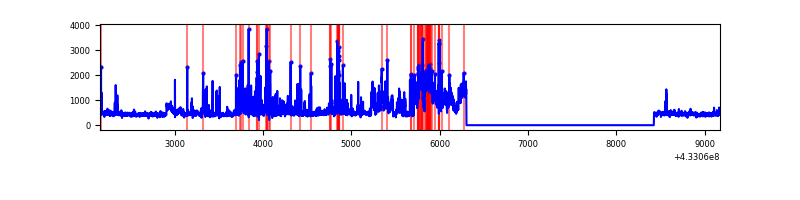 |
Top three noisy pixels from each quadrant. If the there are fewer than three noisy pixels in the level2.evt file, extra rows are filled as -1
| Pixel properties | Quadrant properties | ||||||
|---|---|---|---|---|---|---|---|
| Quadrant | DetID | PixID | Counts | Sigma | Mean | Median | Sigma |
| A | 10 | 83 | 548403 | 4930.05 | 545 | 536 | 111.1 |
| A | 15 | 222 | 544621 | 4896.02 | 545 | 536 | 111.1 |
| A | 15 | 237 | 278117 | 2497.85 | 545 | 536 | 111.1 |
| B | 5 | 255 | 68900 | 650.58 | 543 | 528 | 105.1 |
| B | 0 | 186 | 65417 | 617.44 | 543 | 528 | 105.1 |
| B | 12 | 111 | 12380 | 112.78 | 543 | 528 | 105.1 |
| C | 15 | 214 | 209980 | 1743.87 | 521 | 525 | 120.1 |
| C | 14 | 254 | 39880 | 327.66 | 521 | 525 | 120.1 |
| C | 15 | 111 | 8348 | 65.13 | 521 | 525 | 120.1 |
| D | 1 | 52 | 844123 | 6547.71 | 531 | 515 | 128.8 |
| D | 12 | 217 | 194723 | 1507.36 | 531 | 515 | 128.8 |
| D | 10 | 118 | 50474 | 387.76 | 531 | 515 | 128.8 |
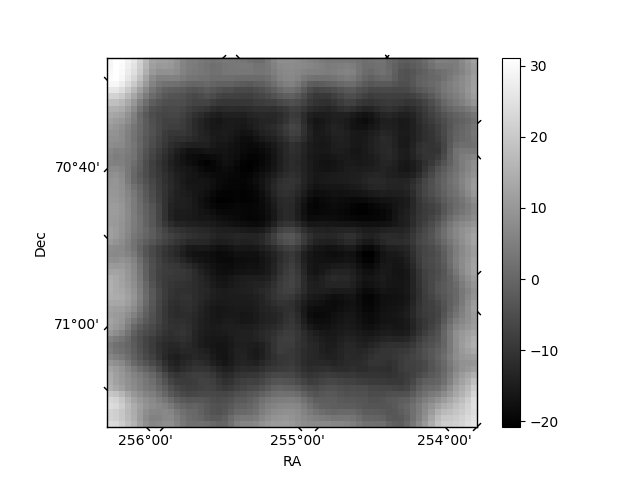
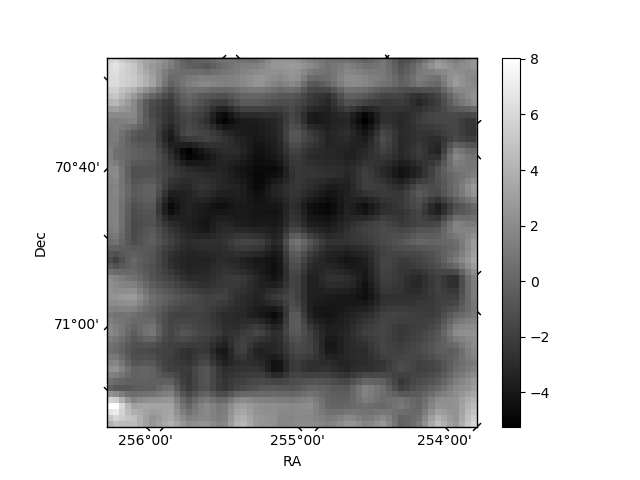
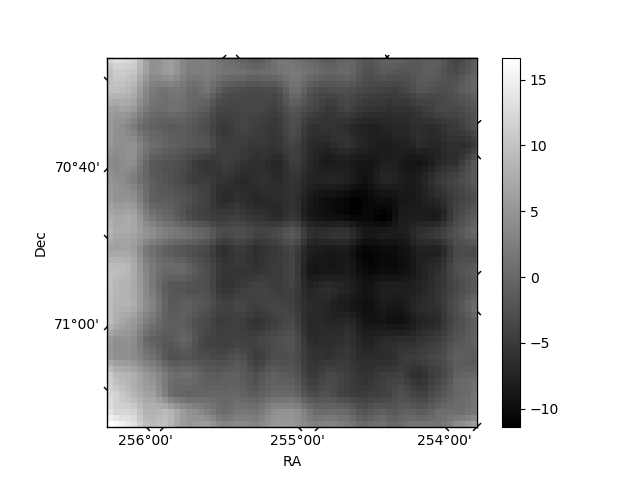
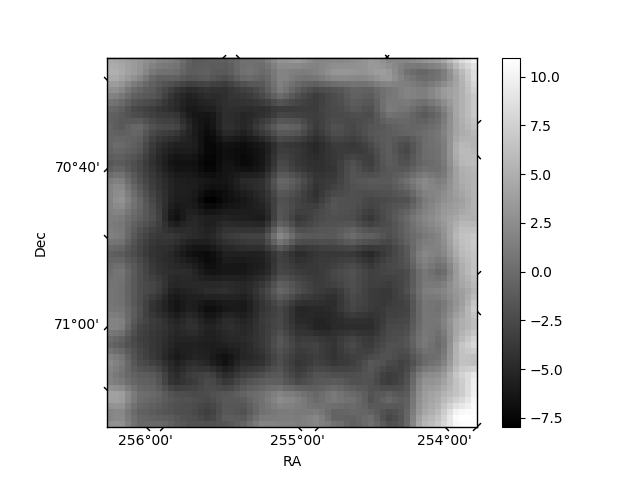
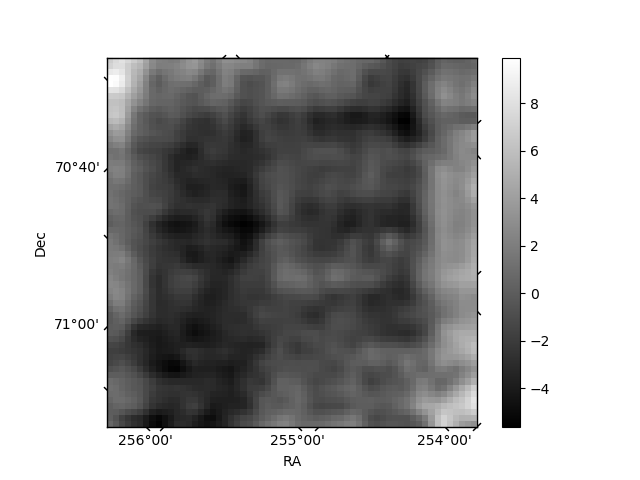
Histogram calculated using DETX and DETY for each event in the final _common_clean file
| Quadrant A | 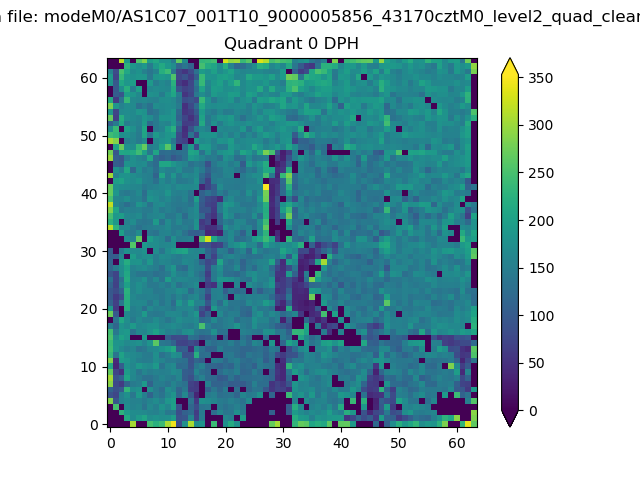 |
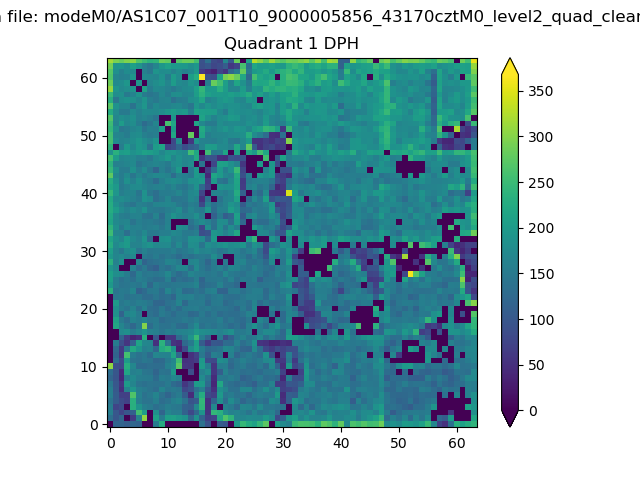 |
Quadrant B |
|---|---|---|---|
| Quadrant D | 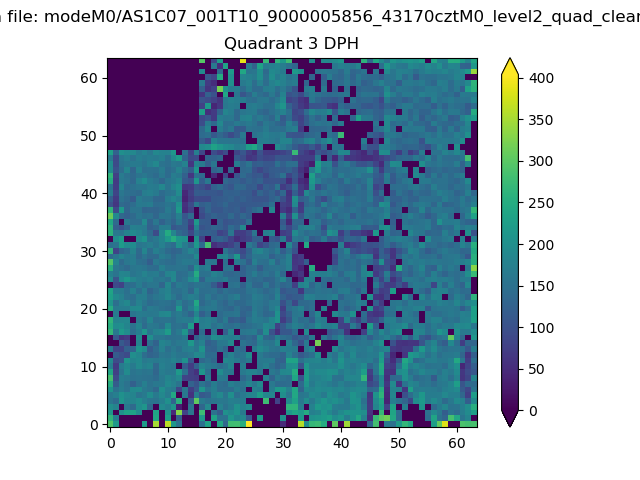 |
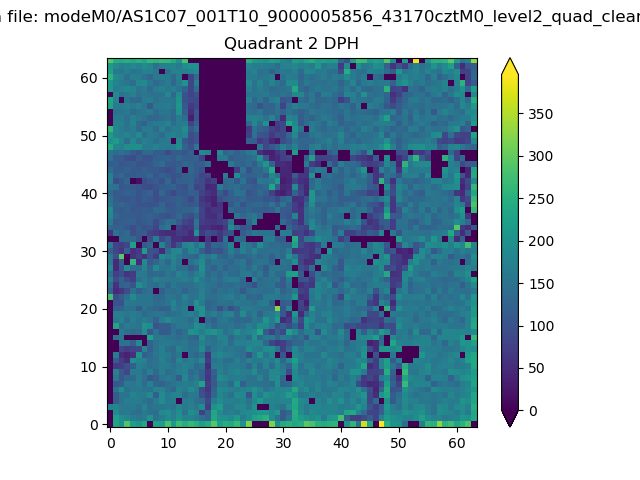 |
Quadrant C |
| Plot type | Count rate plots | Images |
|---|---|---|
| Comparison with Poisson distribution Blue bars denote a histogram of data divided into 1 sec bins. Red curve is a Poisson curve with rate = median count rate of data. |
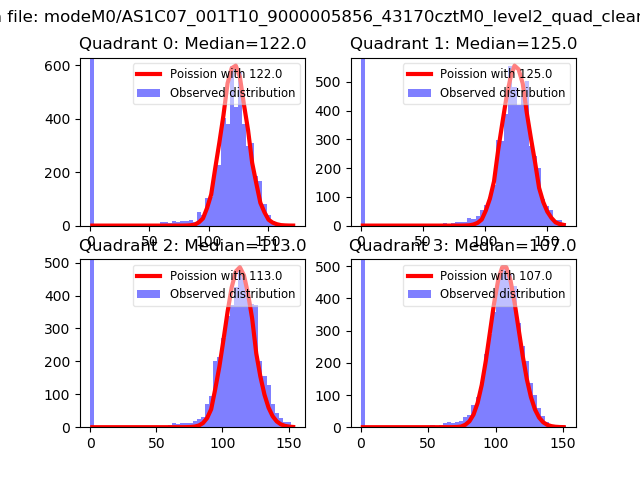 |
 |
| Quadrant-wise count rates Data is divided into 100 sec bins |
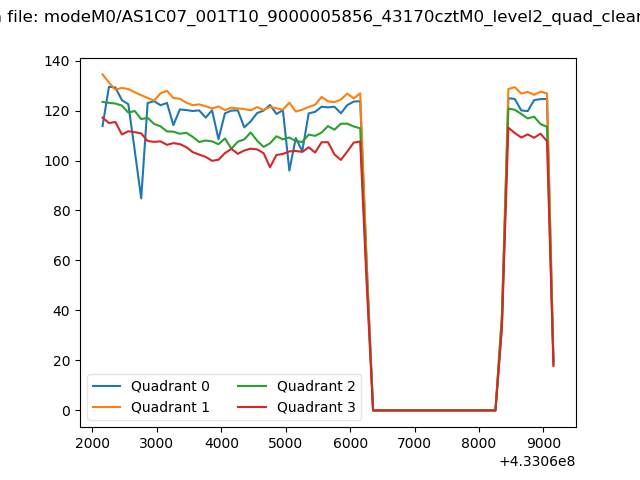 |
|
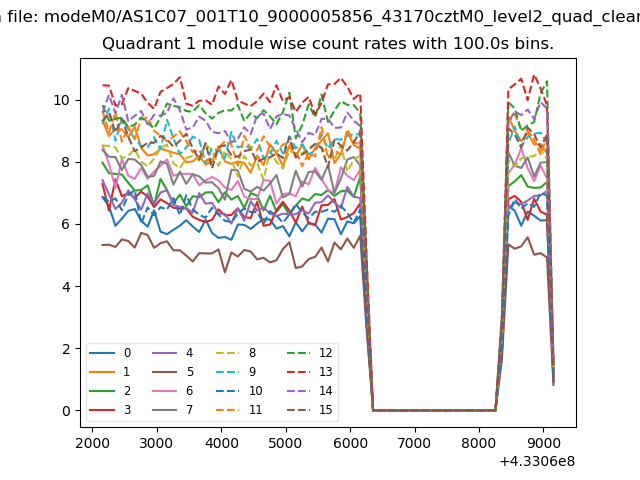
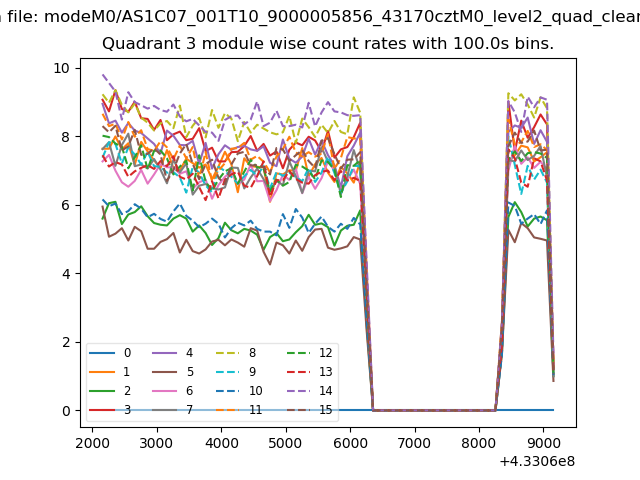
| Module-wise count rates for Quadrant A Data is divided into 100 sec bins |
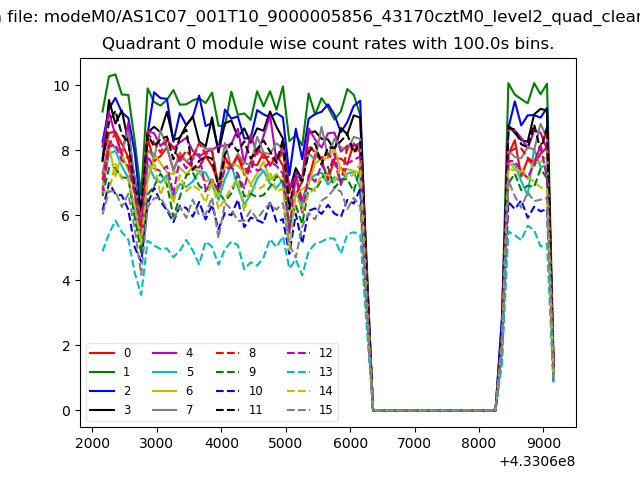 |
 |
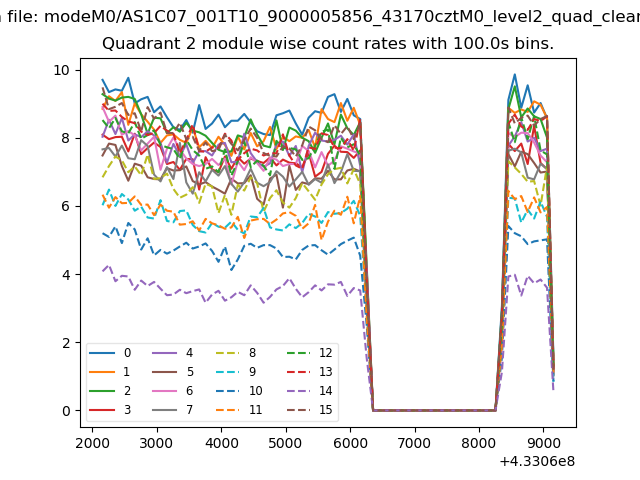
| Module-wise count rates for Quadrant B Data is divided into 100 sec bins |
 |
 |
| Module-wise count rates for Quadrant C Data is divided into 100 sec bins |
 |
 |
| Module-wise count rates for Quadrant D Data is divided into 100 sec bins |
 |
 |
| Parameter | Plot |
|---|---|
| CZT HV Monitor | 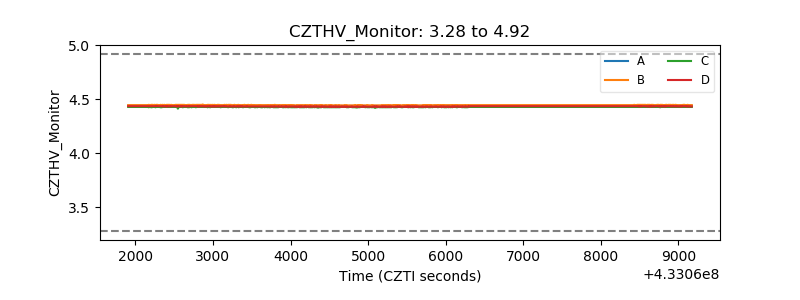 |
| D_VDD | 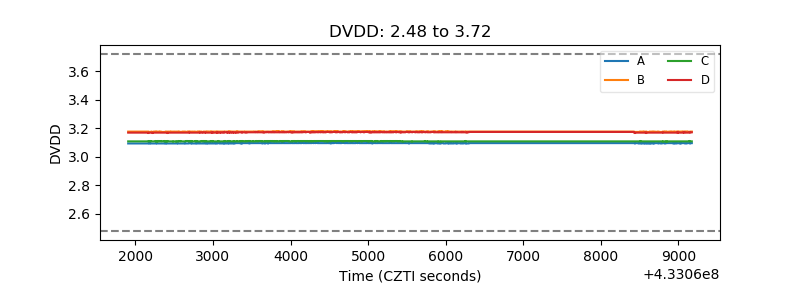 |
| Temperature 1 | 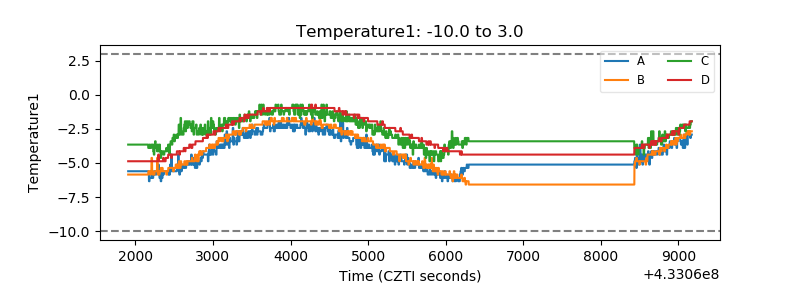 |
| Veto HV Monitor |  |
| Veto LLD | 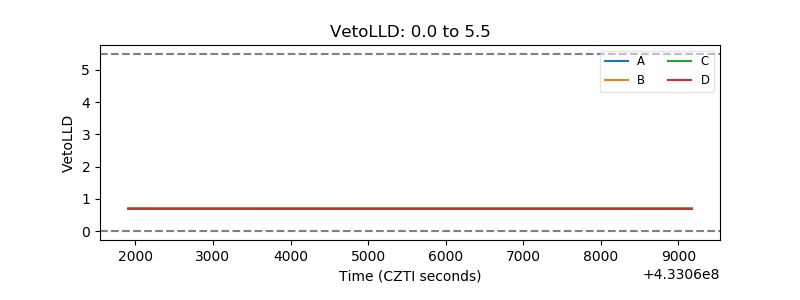 |
| Alpha Counter | 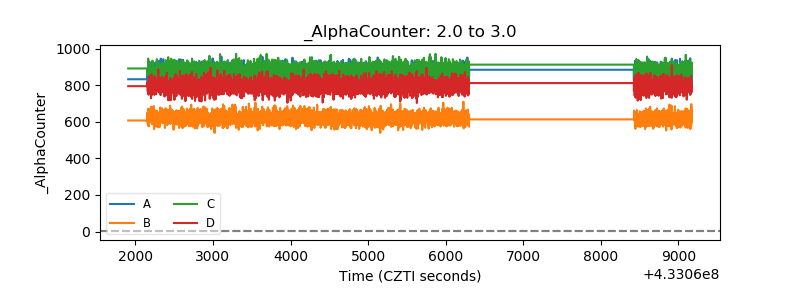 |
| _CPM_Rate | 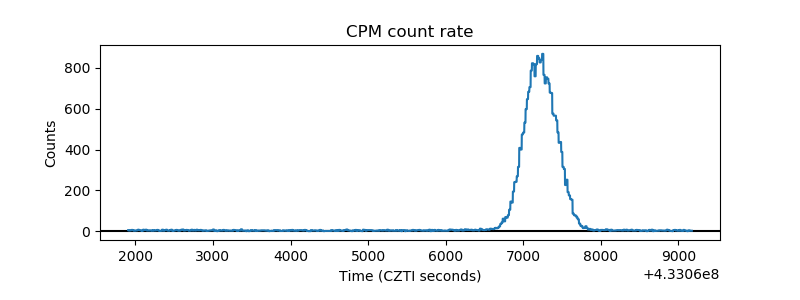 |
| CZT Counter | 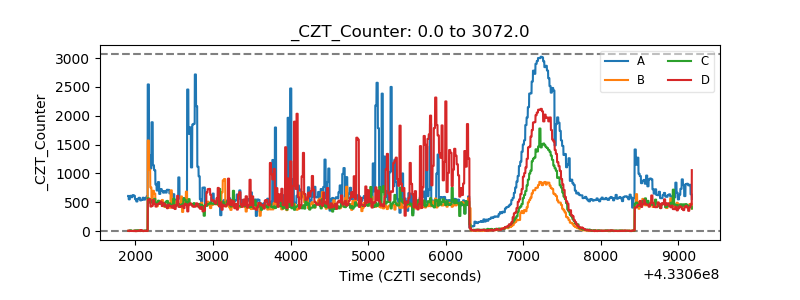 |
| +2.5 Volts monitor | 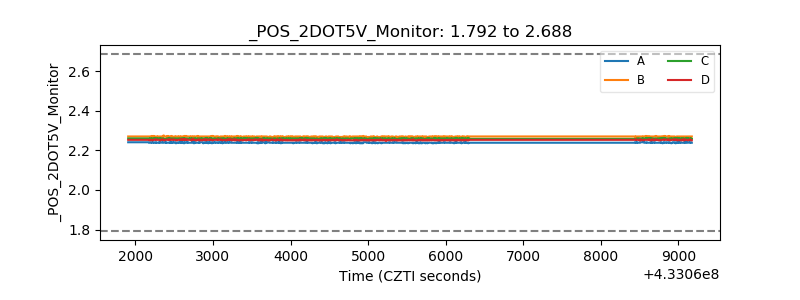 |
| +5 Volts monitor | 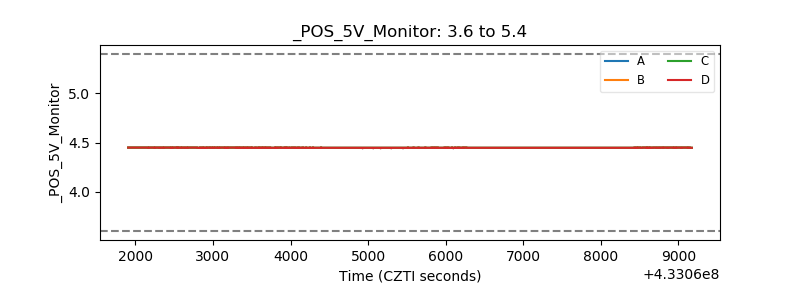 |
| _ROLL_ROT | 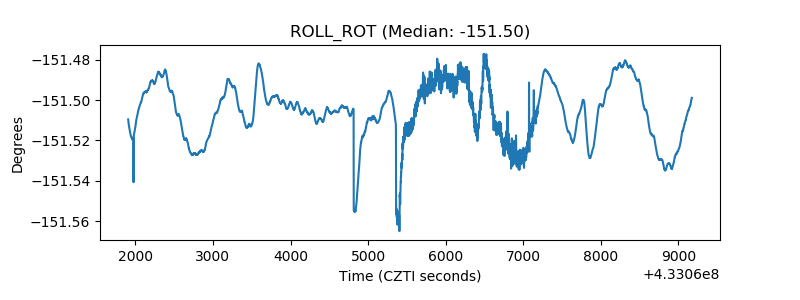 |
| _Roll_DEC | 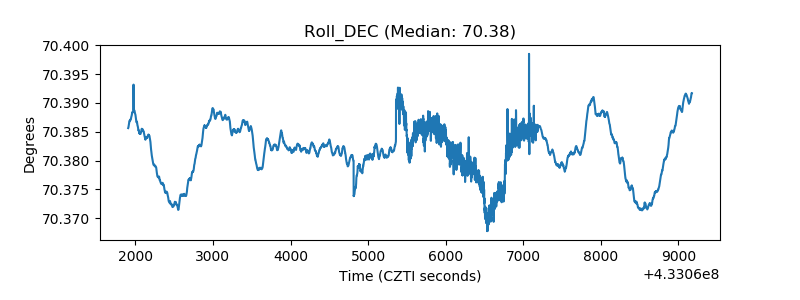 |
| _Roll_RA | 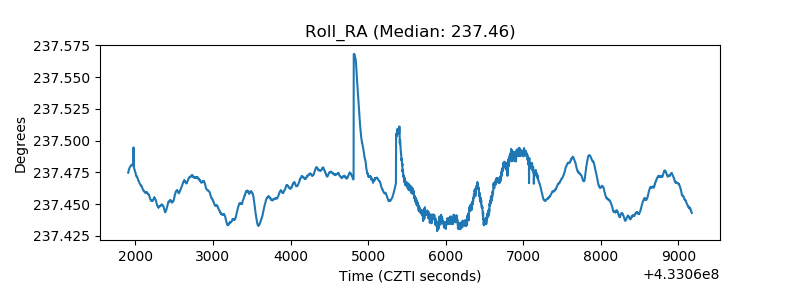 |
| Veto Counter | 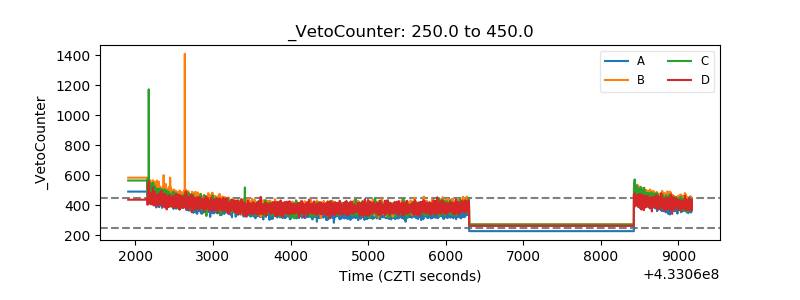 |