| Param | Original file | Final file |
|---|---|---|
| Filename | modeM0/AS1C07_001T10_9000005856_43171cztM0_level2.fits | modeM0/AS1C07_001T10_9000005856_43171cztM0_level2_quad_clean.evt |
| Size (bytes) | 341,991,360 | 82,569,600 |
| Size | 326.1 MB | 78.7 MB |
| Events in quadrant A | 3,829,376 | 573,456 |
| Events in quadrant B | 3,745,159 | 531,116 |
| Events in quadrant C | 2,250,637 | 540,525 |
| Events in quadrant D | 2,453,356 | 512,368 |
| Mode M9 | |||
|---|---|---|---|
| Quadrant | BADHDUFLAG | Total packets | Discarded packets |
| A | 0 | 28 | 1 |
| B | 0 | 29 | 0 |
| C | 0 | 29 | 1 |
| D | 0 | 29 | 1 |
| Mode SS | |||
|---|---|---|---|
| Quadrant | BADHDUFLAG | Total packets | Discarded packets |
| A | 0 | 100 | 0 |
| B | 0 | 100 | 0 |
| C | 0 | 100 | 0 |
| D | 0 | 100 | 0 |
| Mode M0 | |||
|---|---|---|---|
| Quadrant | BADHDUFLAG | Total packets | Discarded packets |
| A | 0 | 14566 | 2 |
| B | 0 | 14383 | 2 |
| C | 0 | 9861 | 4 |
| D | 0 | 10630 | 4 |
| Quadrant | Total seconds | Saturated seconds | Saturation percentage |
|---|---|---|---|
| A | 4887 | 135 | 2.762431% |
| B | 4887 | 587 | 12.011459% |
| C | 4886 | 5 | 0.102333% |
| D | 4886 | 34 | 0.695866% |
Noise dominated data is calculated using 1-second bins in cleaned event files. If a bin has >2000 counts, and if more than 50% of those come from <1% of pixels, then it is considered to be noise-dominated and hence unusable.
| Quadrant | # 1 sec bins | Bins with >0 counts | Bins with >2000 counts | High rate bins dominated by noise | Noise dominated (total time) | Noise dominated (detector-on time) | Marked lightcurve |
|---|---|---|---|---|---|---|---|
| A | 7041 | 4888 | 85 | 85 | 1.21% | 1.74% | 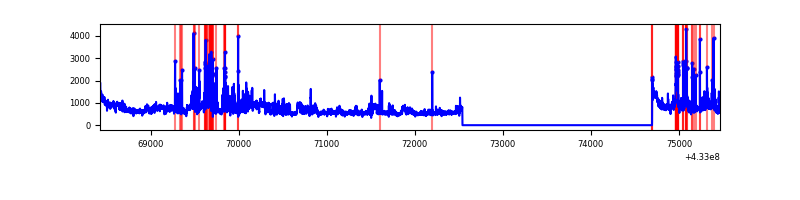 |
| B | 7041 | 4888 | 503 | 503 | 7.14% | 10.29% | 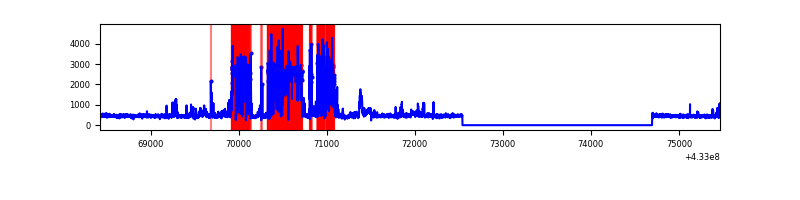 |
| C | 7041 | 4888 | 1 | 1 | 0.01% | 0.02% | 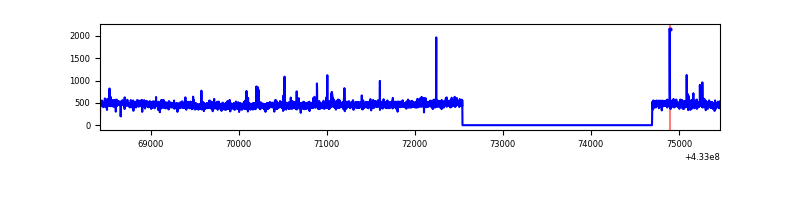 |
| D | 7041 | 4888 | 31 | 31 | 0.44% | 0.63% | 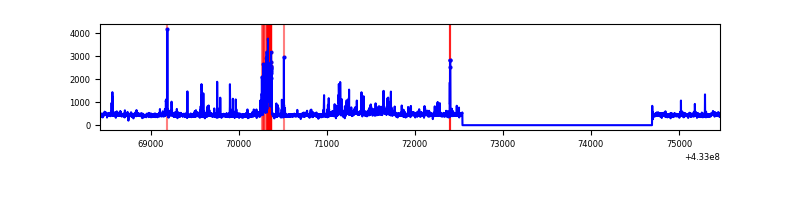 |
Top three noisy pixels from each quadrant. If the there are fewer than three noisy pixels in the level2.evt file, extra rows are filled as -1
| Pixel properties | Quadrant properties | ||||||
|---|---|---|---|---|---|---|---|
| Quadrant | DetID | PixID | Counts | Sigma | Mean | Median | Sigma |
| A | 15 | 222 | 819318 | 7572.85 | 535 | 525 | 108.1 |
| A | 10 | 83 | 564565 | 5216.69 | 535 | 525 | 108.1 |
| A | 15 | 237 | 293789 | 2712.34 | 535 | 525 | 108.1 |
| B | 0 | 229 | 1658461 | 17473.67 | 497 | 484 | 94.9 |
| B | 0 | 186 | 59739 | 624.5 | 497 | 484 | 94.9 |
| B | 0 | 230 | 52887 | 552.28 | 497 | 484 | 94.9 |
| C | 15 | 214 | 209520 | 1754.66 | 514 | 517 | 119.1 |
| C | 14 | 254 | 24696 | 202.99 | 514 | 517 | 119.1 |
| C | 15 | 111 | 7337 | 57.26 | 514 | 517 | 119.1 |
| D | 1 | 52 | 171307 | 1351.66 | 524 | 509 | 126.4 |
| D | 12 | 0 | 127822 | 1007.53 | 524 | 509 | 126.4 |
| D | 12 | 233 | 56282 | 441.38 | 524 | 509 | 126.4 |
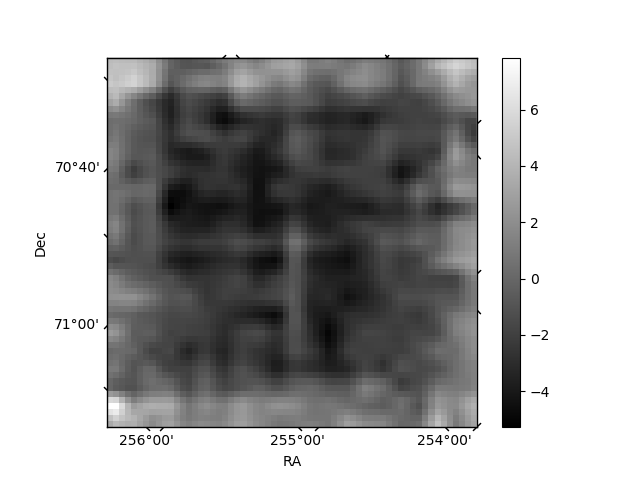
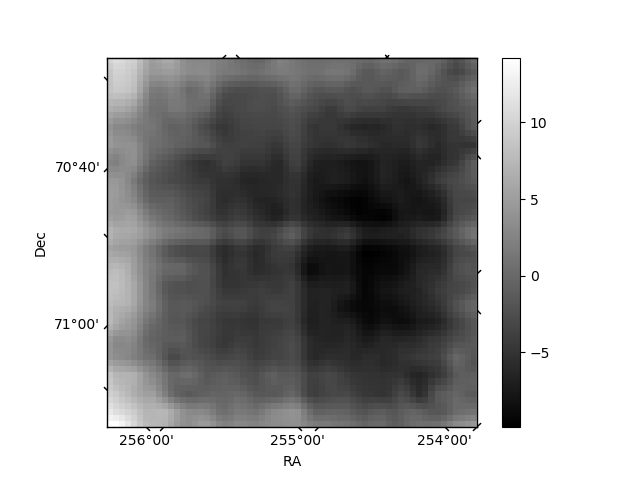
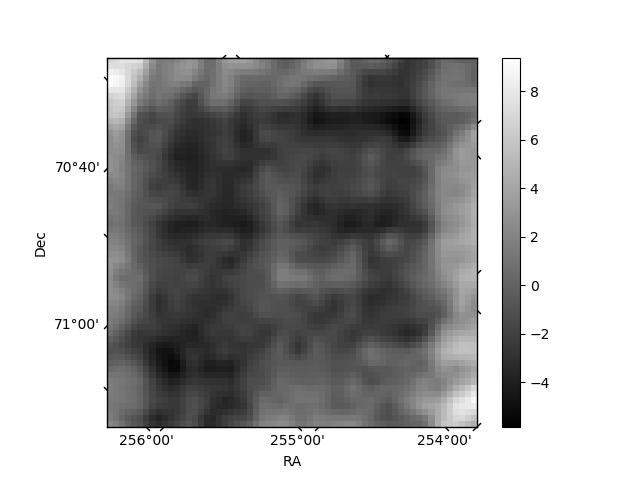
Histogram calculated using DETX and DETY for each event in the final _common_clean file
| Quadrant A | 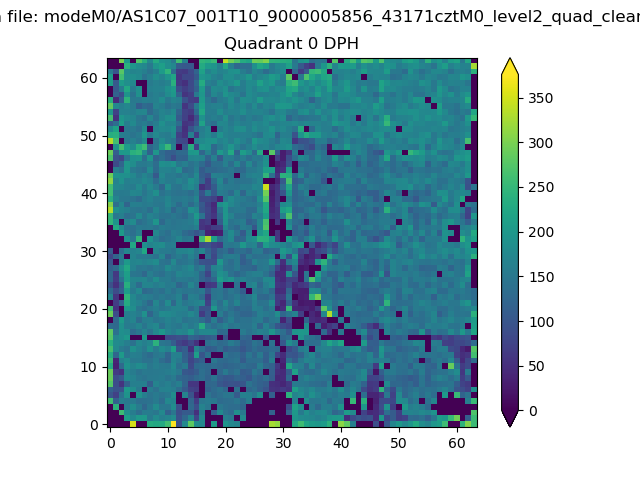 |
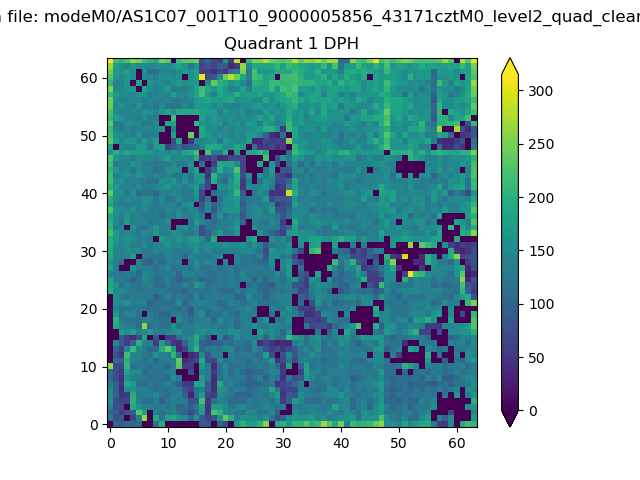 |
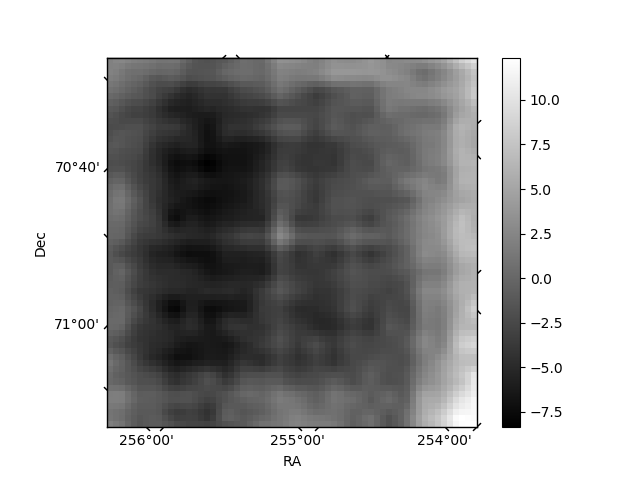
Quadrant B |
|---|---|---|---|
| Quadrant D | 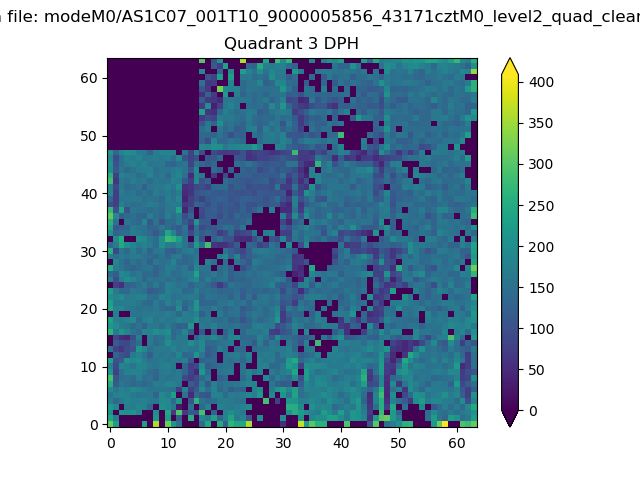 |
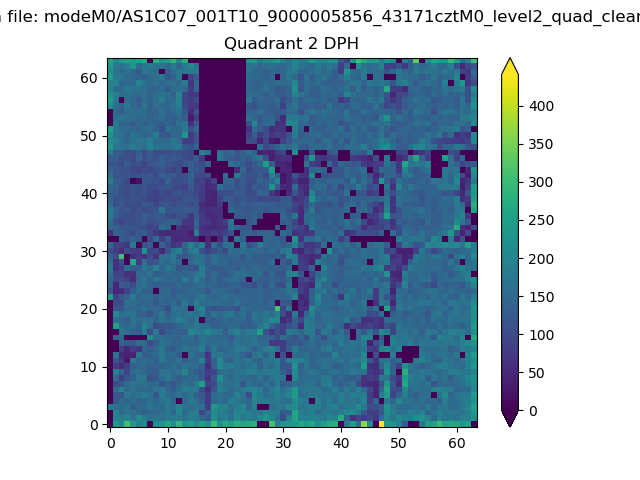 |
Quadrant C |
| Plot type | Count rate plots | Images |
|---|---|---|
| Comparison with Poisson distribution Blue bars denote a histogram of data divided into 1 sec bins. Red curve is a Poisson curve with rate = median count rate of data. |
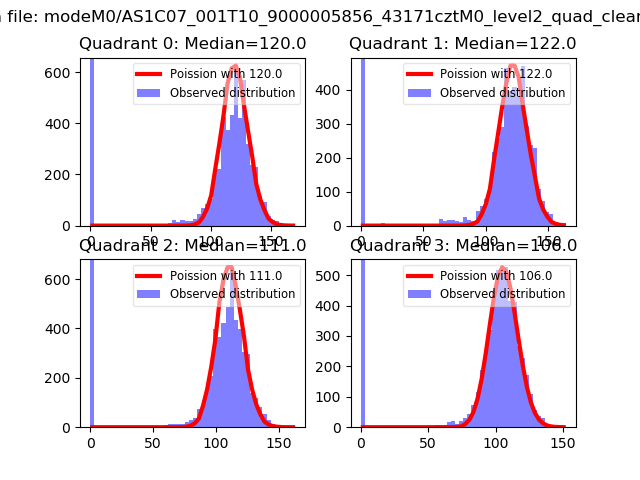 |
 |
| Quadrant-wise count rates Data is divided into 100 sec bins |
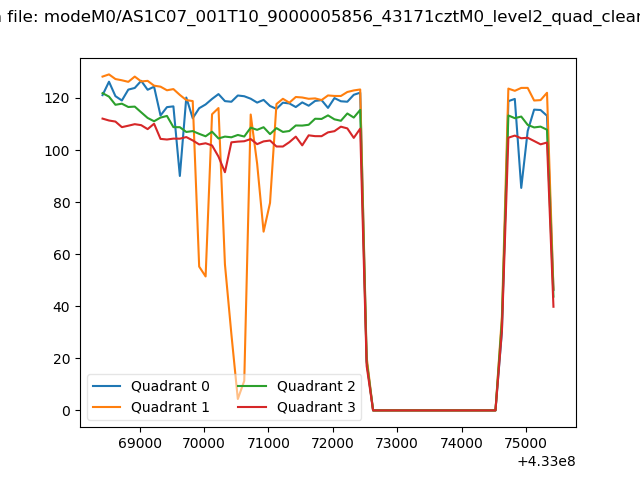 |
|
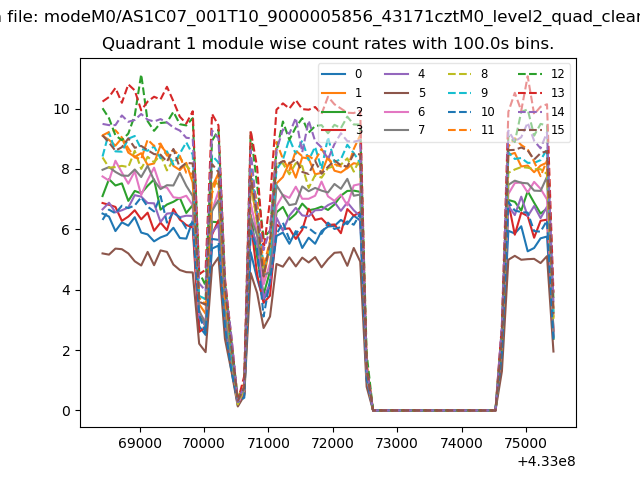
| Module-wise count rates for Quadrant A Data is divided into 100 sec bins |
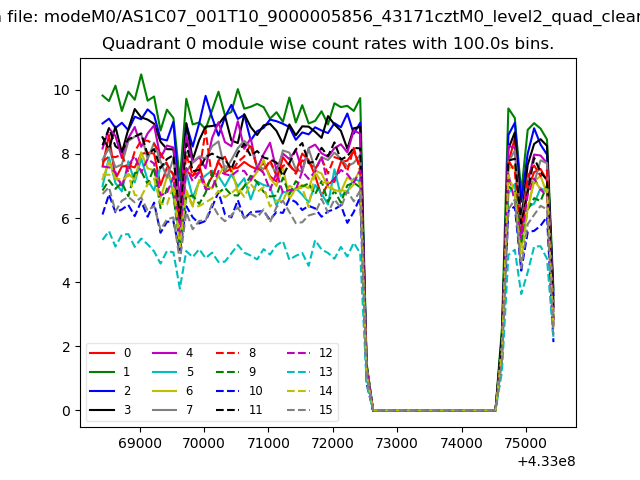 |
 |
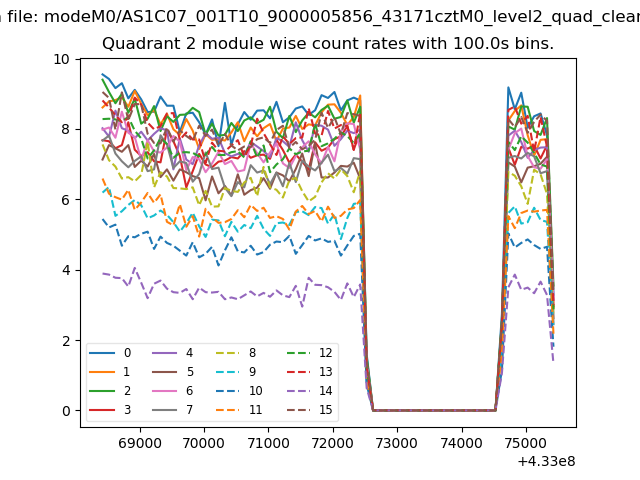
| Module-wise count rates for Quadrant B Data is divided into 100 sec bins |
 |
 |
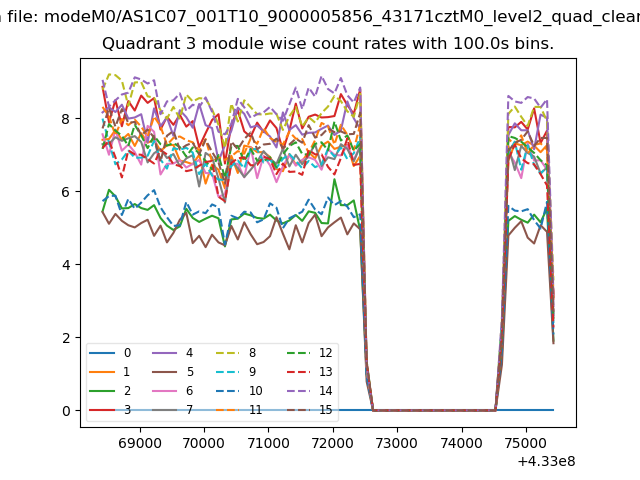
| Module-wise count rates for Quadrant C Data is divided into 100 sec bins |
 |
 |
| Module-wise count rates for Quadrant D Data is divided into 100 sec bins |
 |
 |
| Parameter | Plot |
|---|---|
| CZT HV Monitor | 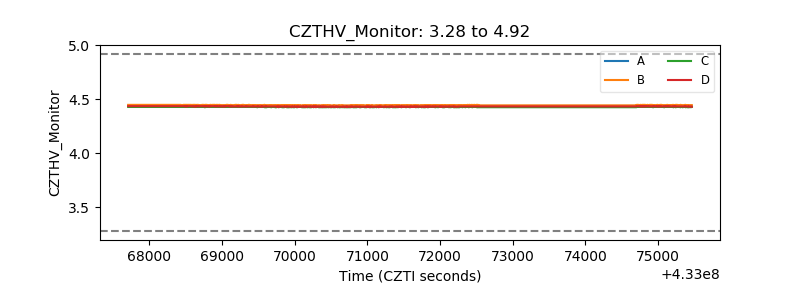 |
| D_VDD | 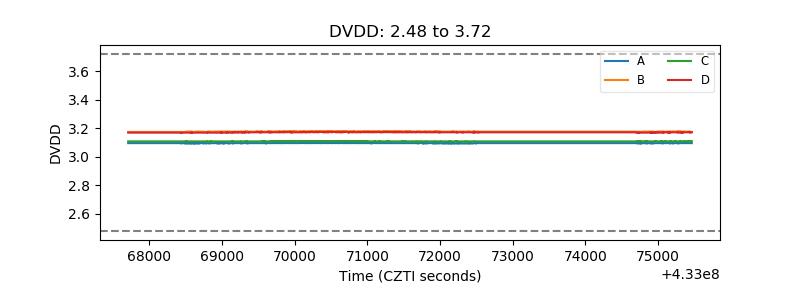 |
| Temperature 1 | 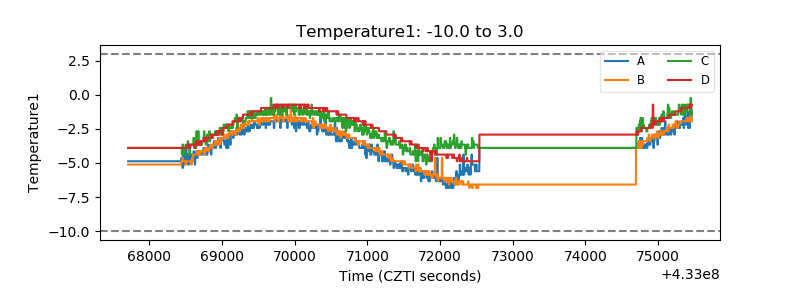 |
| Veto HV Monitor | 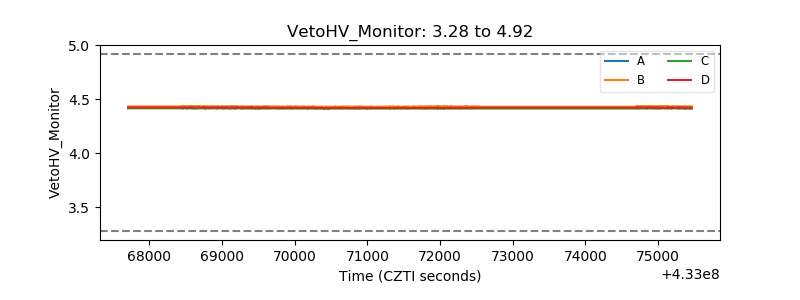 |
| Veto LLD | 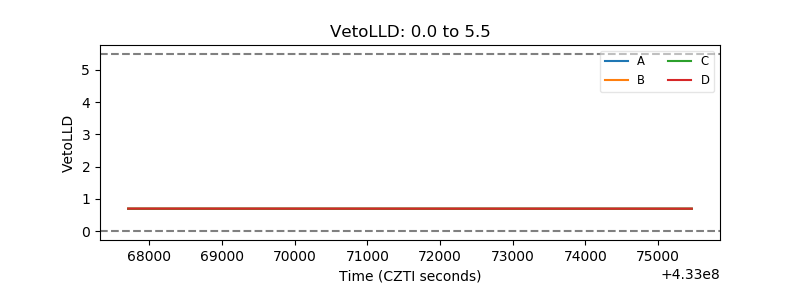 |
| Alpha Counter | 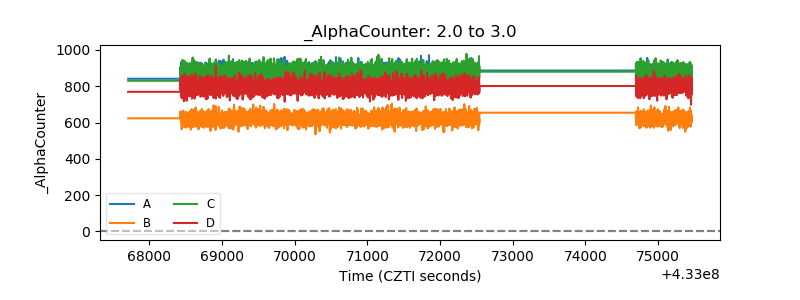 |
| _CPM_Rate | 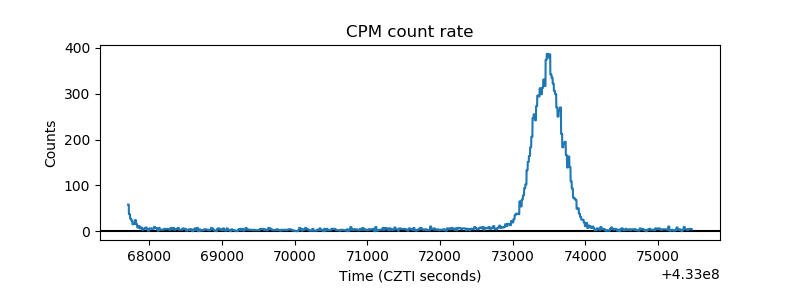 |
| CZT Counter | 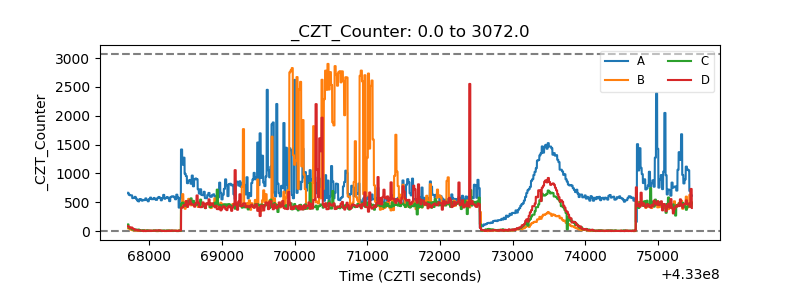 |
| +2.5 Volts monitor | 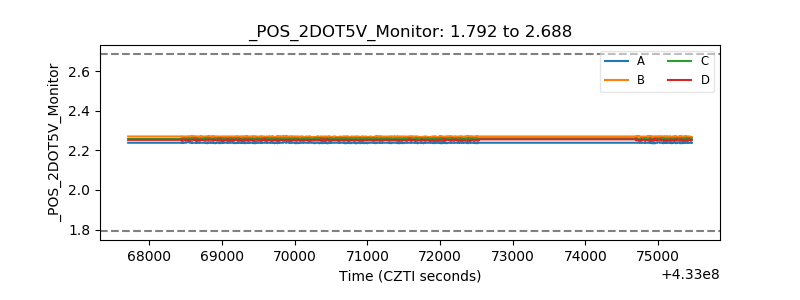 |
| +5 Volts monitor | 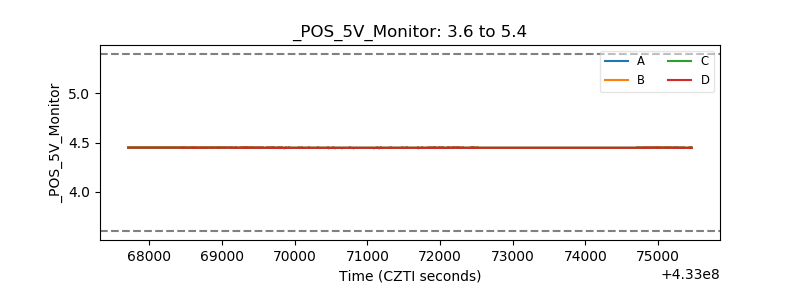 |
| _ROLL_ROT | 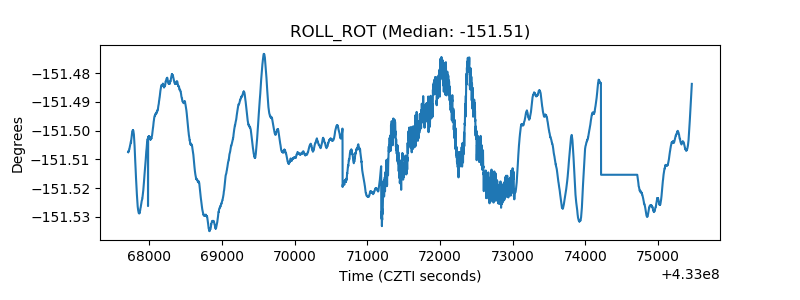 |
| _Roll_DEC | 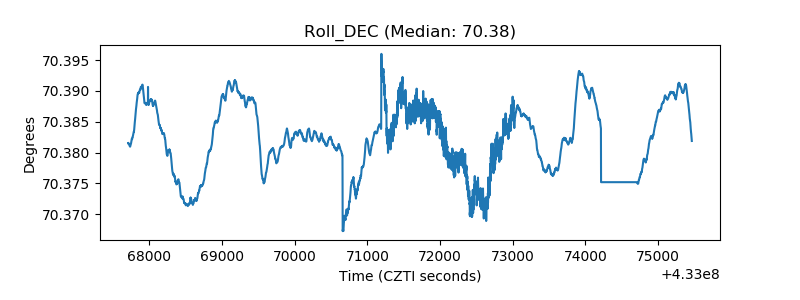 |
| _Roll_RA |  |
| Veto Counter | 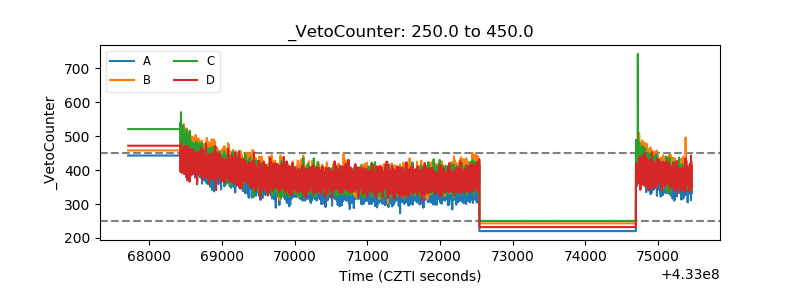 |