| Param | Original file | Final file |
|---|---|---|
| Filename | modeM0/AS1C07_001T10_9000005856_43173cztM0_level2.fits | modeM0/AS1C07_001T10_9000005856_43173cztM0_level2_quad_clean.evt |
| Size (bytes) | 408,536,640 | 84,409,920 |
| Size | 389.6 MB | 80.5 MB |
| Events in quadrant A | 4,425,209 | 556,977 |
| Events in quadrant B | 4,302,907 | 584,176 |
| Events in quadrant C | 2,850,037 | 537,562 |
| Events in quadrant D | 3,129,840 | 503,337 |
| Mode M9 | |||
|---|---|---|---|
| Quadrant | BADHDUFLAG | Total packets | Discarded packets |
| A | 0 | 17 | 0 |
| B | 0 | 18 | 0 |
| C | 0 | 18 | 0 |
| D | 0 | 18 | 0 |
| Mode SS | |||
|---|---|---|---|
| Quadrant | BADHDUFLAG | Total packets | Discarded packets |
| A | 0 | 110 | 0 |
| B | 0 | 110 | 0 |
| C | 0 | 110 | 0 |
| D | 0 | 110 | 0 |
| Mode M0 | |||
|---|---|---|---|
| Quadrant | BADHDUFLAG | Total packets | Discarded packets |
| A | 0 | 16686 | 2 |
| B | 0 | 16680 | 2 |
| C | 0 | 12090 | 2 |
| D | 0 | 13116 | 2 |
| Quadrant | Total seconds | Saturated seconds | Saturation percentage |
|---|---|---|---|
| A | 5332 | 391 | 7.333083% |
| B | 5332 | 248 | 4.651163% |
| C | 5332 | 182 | 3.413353% |
| D | 5332 | 255 | 4.782446% |
Noise dominated data is calculated using 1-second bins in cleaned event files. If a bin has >2000 counts, and if more than 50% of those come from <1% of pixels, then it is considered to be noise-dominated and hence unusable.
| Quadrant | # 1 sec bins | Bins with >0 counts | Bins with >2000 counts | High rate bins dominated by noise | Noise dominated (total time) | Noise dominated (detector-on time) | Marked lightcurve |
|---|---|---|---|---|---|---|---|
| A | 7093 | 5332 | 301 | 301 | 4.24% | 5.65% | 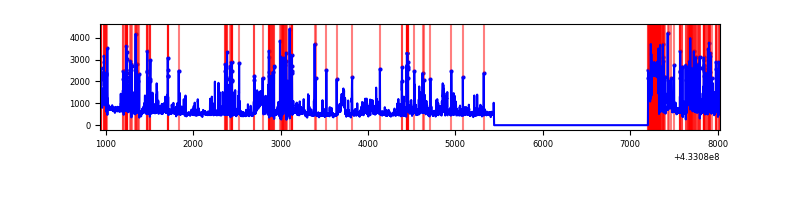 |
| B | 7094 | 5333 | 190 | 190 | 2.68% | 3.56% | 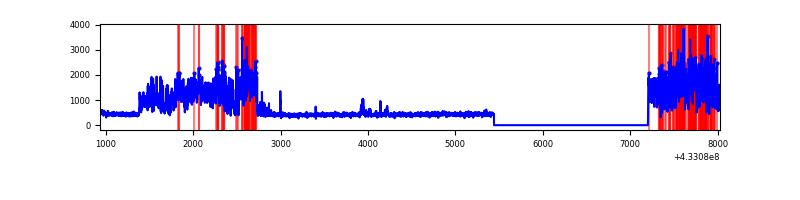 |
| C | 7094 | 5333 | 166 | 166 | 2.34% | 3.11% | 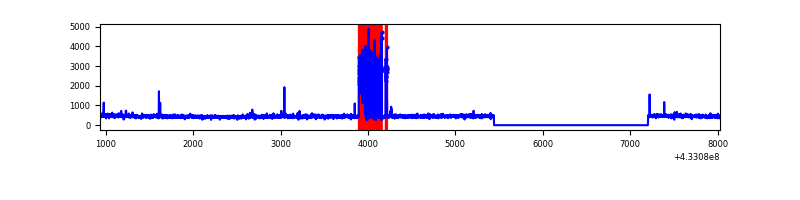 |
| D | 7094 | 5333 | 225 | 225 | 3.17% | 4.22% | 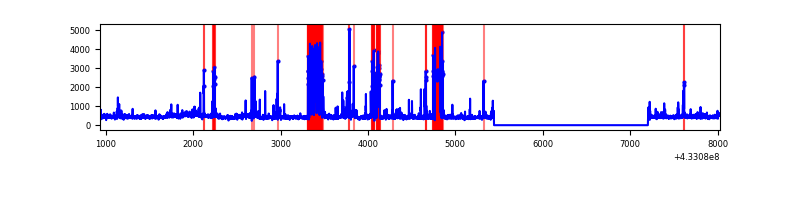 |
Top three noisy pixels from each quadrant. If the there are fewer than three noisy pixels in the level2.evt file, extra rows are filled as -1
| Pixel properties | Quadrant properties | ||||||
|---|---|---|---|---|---|---|---|
| Quadrant | DetID | PixID | Counts | Sigma | Mean | Median | Sigma |
| A | 15 | 222 | 1027030 | 9208.78 | 543 | 532 | 111.5 |
| A | 10 | 83 | 560105 | 5019.97 | 543 | 532 | 111.5 |
| A | 12 | 189 | 452862 | 4057.88 | 543 | 532 | 111.5 |
| B | 0 | 186 | 2054774 | 19360.03 | 553 | 537 | 106.1 |
| B | 0 | 229 | 38590 | 358.63 | 553 | 537 | 106.1 |
| B | 5 | 255 | 24827 | 228.92 | 553 | 537 | 106.1 |
| C | 15 | 111 | 528580 | 4261.06 | 534 | 537 | 123.9 |
| C | 15 | 214 | 219105 | 1763.74 | 534 | 537 | 123.9 |
| C | 14 | 254 | 14629 | 113.72 | 534 | 537 | 123.9 |
| D | 1 | 52 | 843231 | 6392.65 | 538 | 521 | 131.8 |
| D | 13 | 249 | 102654 | 774.76 | 538 | 521 | 131.8 |
| D | 7 | 96 | 43548 | 326.39 | 538 | 521 | 131.8 |
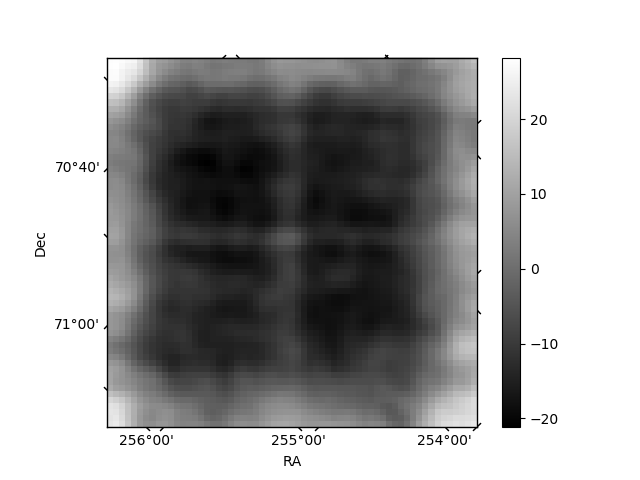
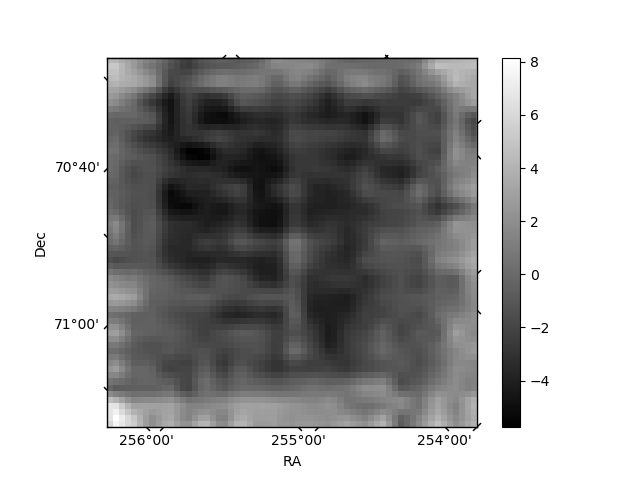
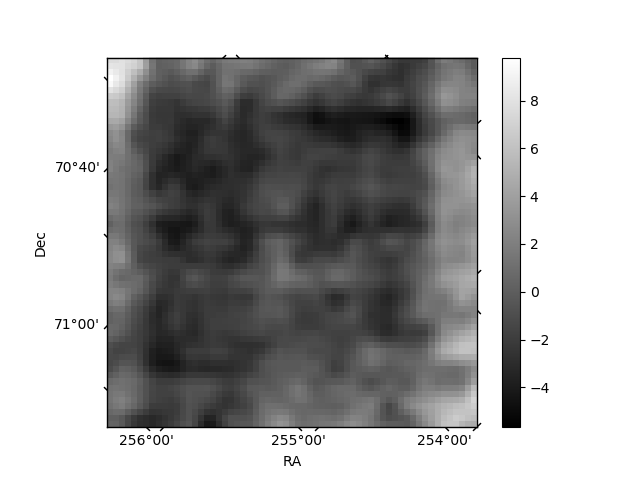
Histogram calculated using DETX and DETY for each event in the final _common_clean file
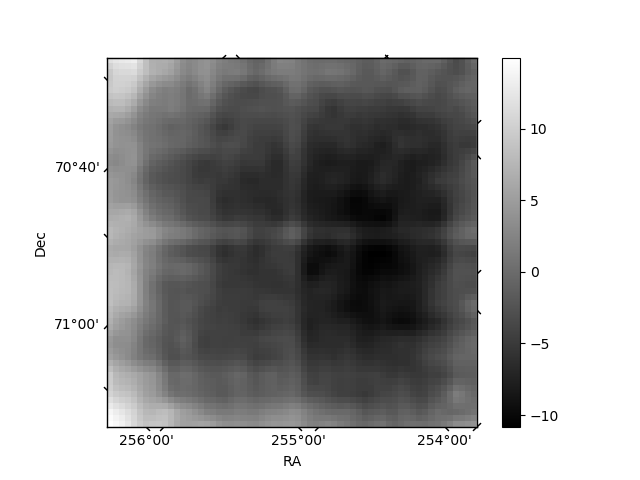
| Quadrant A | 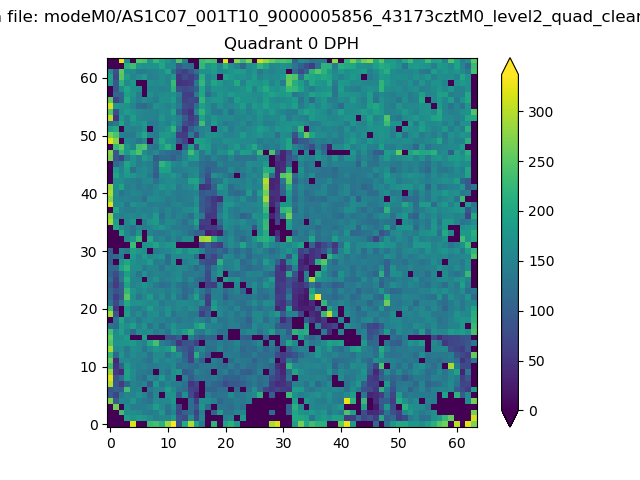 |
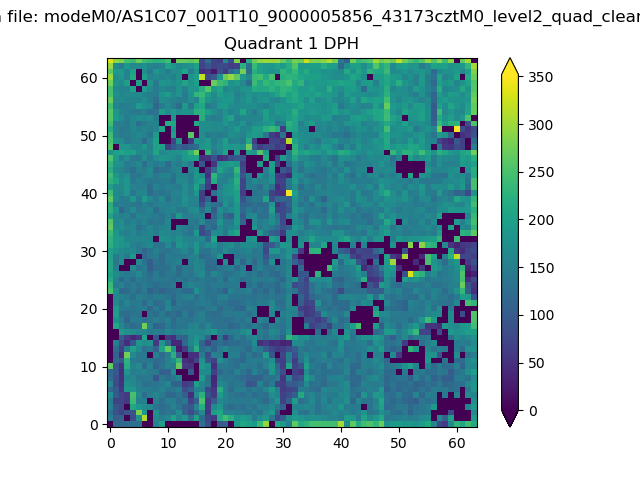 |
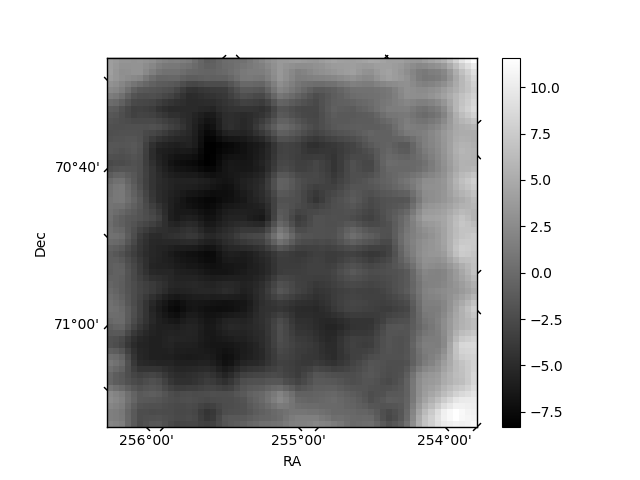
Quadrant B |
|---|---|---|---|
| Quadrant D |  |
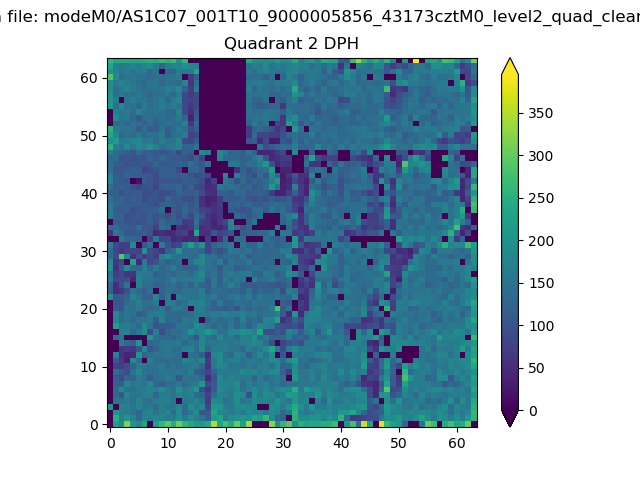 |
Quadrant C |
| Plot type | Count rate plots | Images |
|---|---|---|
| Comparison with Poisson distribution Blue bars denote a histogram of data divided into 1 sec bins. Red curve is a Poisson curve with rate = median count rate of data. |
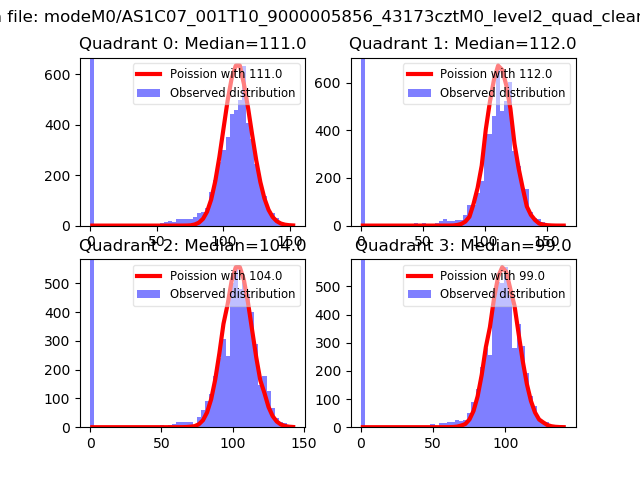 |
 |
| Quadrant-wise count rates Data is divided into 100 sec bins |
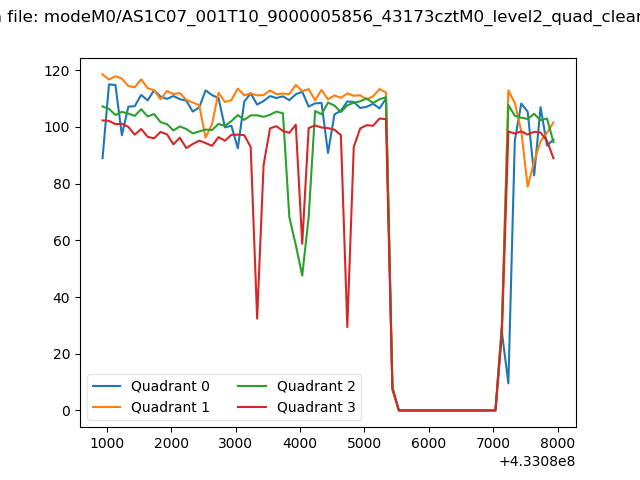 |
|
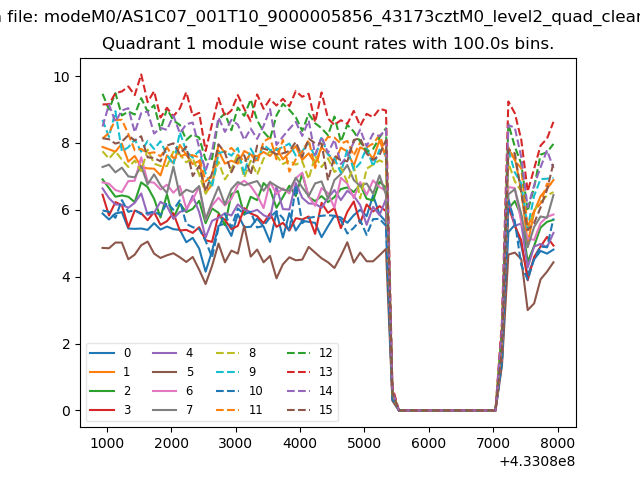
| Module-wise count rates for Quadrant A Data is divided into 100 sec bins |
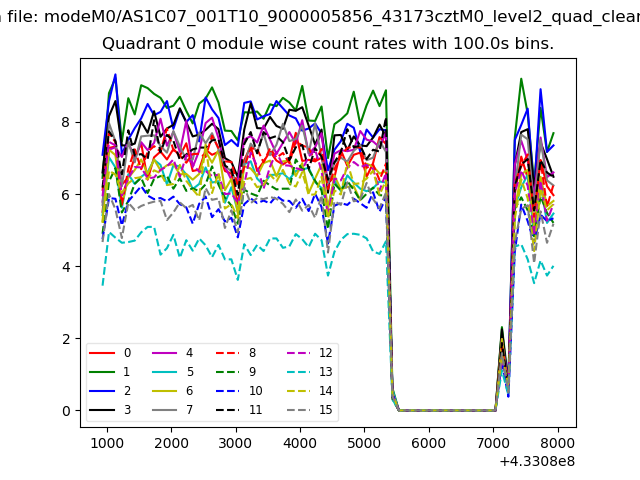 |
 |
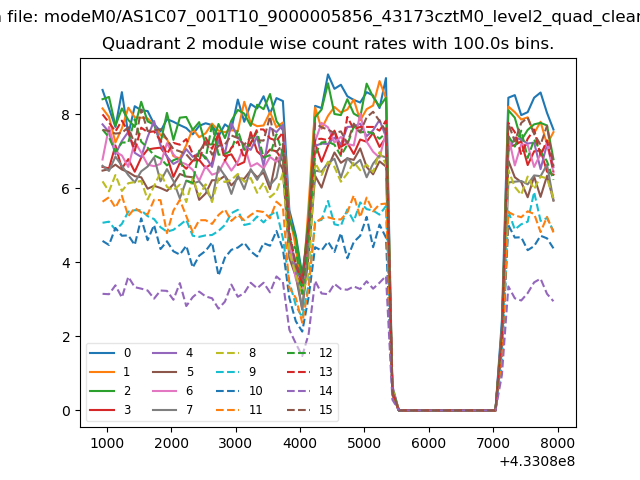
| Module-wise count rates for Quadrant B Data is divided into 100 sec bins |
 |
 |
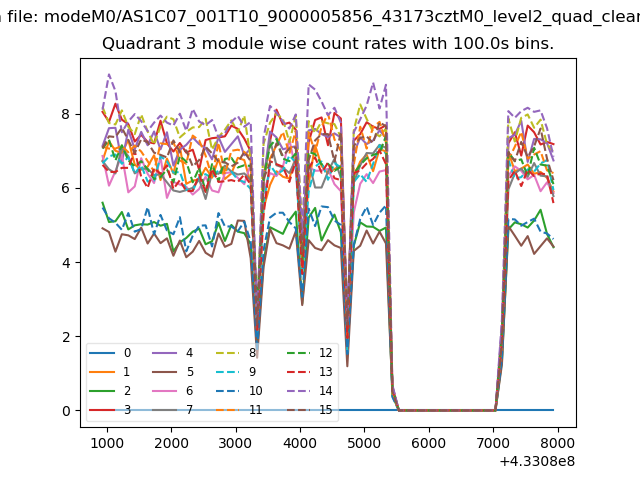
| Module-wise count rates for Quadrant C Data is divided into 100 sec bins |
 |
 |
| Module-wise count rates for Quadrant D Data is divided into 100 sec bins |
 |
 |
| Parameter | Plot |
|---|---|
| CZT HV Monitor | 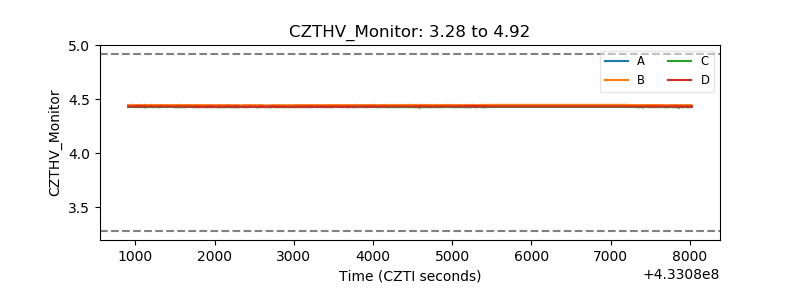 |
| D_VDD | 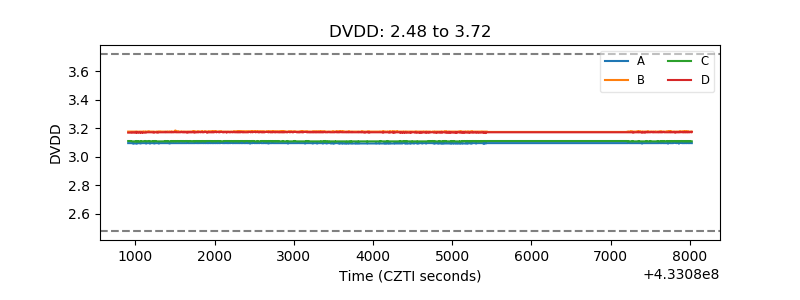 |
| Temperature 1 | 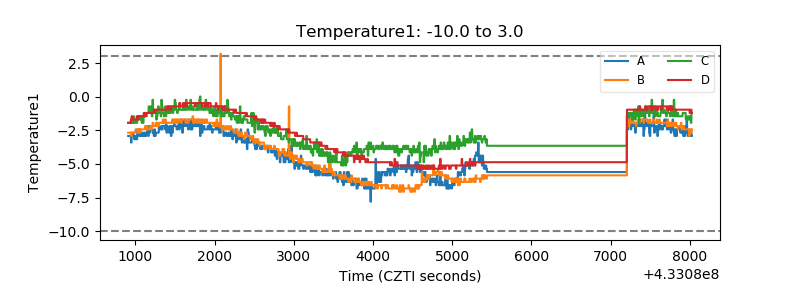 |
| Veto HV Monitor |  |
| Veto LLD | 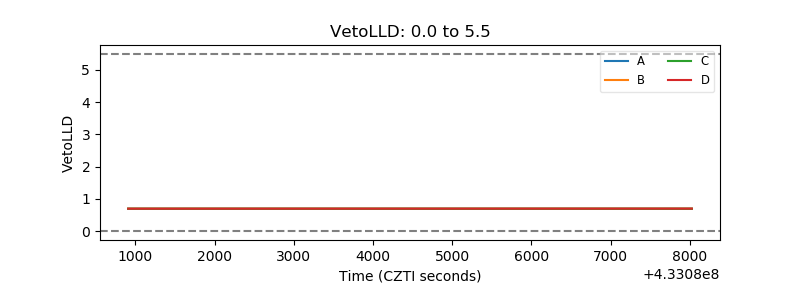 |
| Alpha Counter | 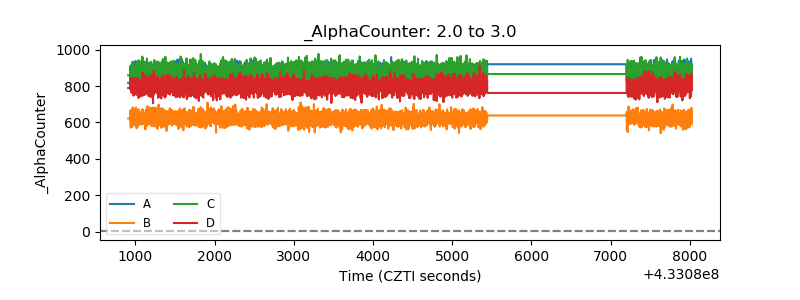 |
| _CPM_Rate | 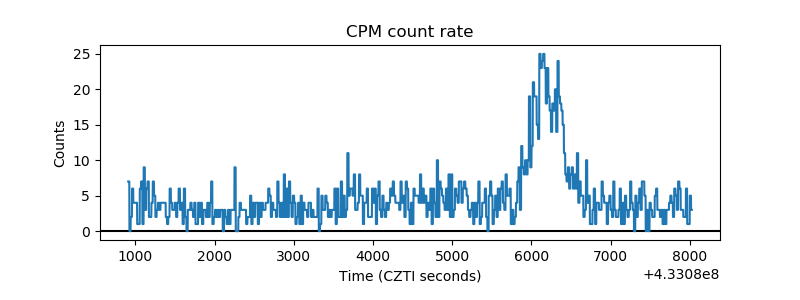 |
| CZT Counter | 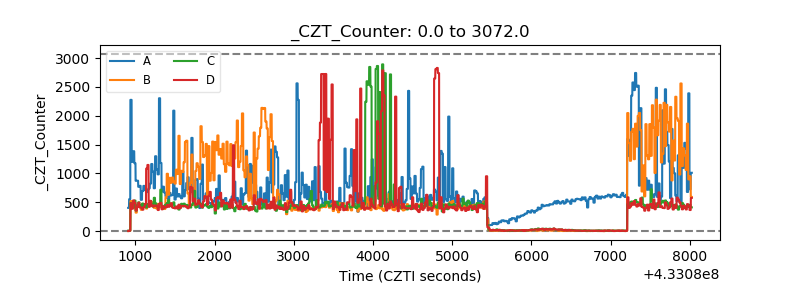 |
| +2.5 Volts monitor | 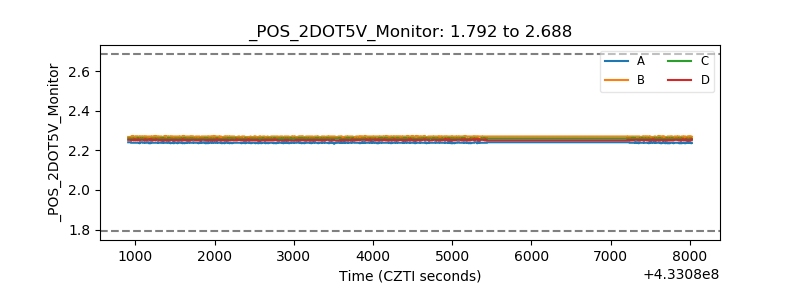 |
| +5 Volts monitor | 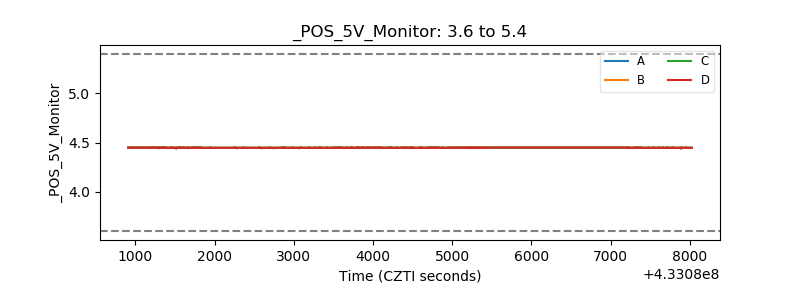 |
| _ROLL_ROT | 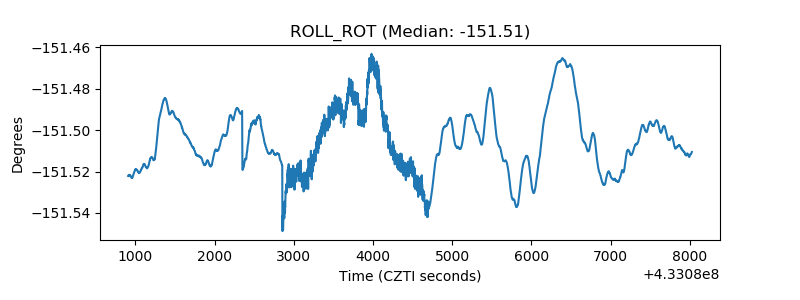 |
| _Roll_DEC | 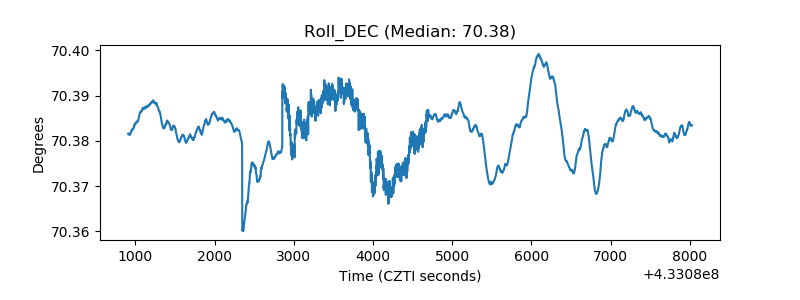 |
| _Roll_RA | 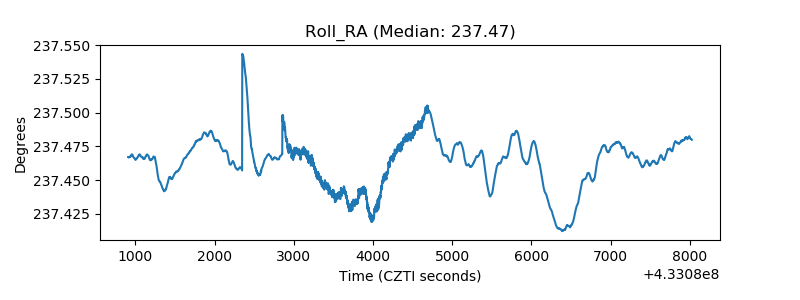 |
| Veto Counter | 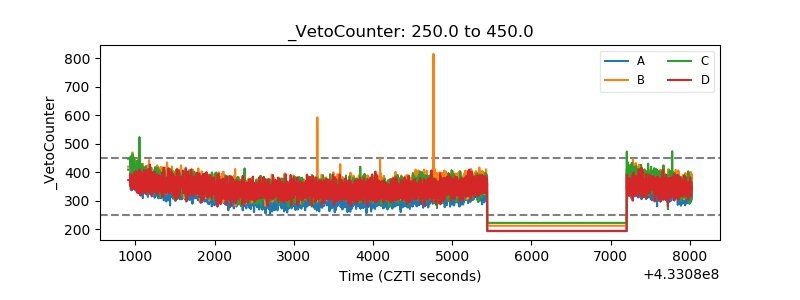 |