| Param | Original file | Final file |
|---|---|---|
| Filename | modeM0/AS1C07_001T10_9000005856_43174cztM0_level2.fits | modeM0/AS1C07_001T10_9000005856_43174cztM0_level2_quad_clean.evt |
| Size (bytes) | 437,328,000 | 89,035,200 |
| Size | 417.1 MB | 84.9 MB |
| Events in quadrant A | 6,071,100 | 528,718 |
| Events in quadrant B | 3,977,717 | 615,873 |
| Events in quadrant C | 2,582,621 | 594,278 |
| Events in quadrant D | 3,109,194 | 554,292 |
| Mode M9 | |||
|---|---|---|---|
| Quadrant | BADHDUFLAG | Total packets | Discarded packets |
| A | 0 | 17 | 0 |
| B | 0 | 18 | 0 |
| C | 0 | 18 | 0 |
| D | 0 | 18 | 0 |
| Mode SS | |||
|---|---|---|---|
| Quadrant | BADHDUFLAG | Total packets | Discarded packets |
| A | 0 | 118 | 0 |
| B | 0 | 118 | 0 |
| C | 0 | 118 | 0 |
| D | 0 | 118 | 0 |
| Mode M0 | |||
|---|---|---|---|
| Quadrant | BADHDUFLAG | Total packets | Discarded packets |
| A | 0 | 21832 | 2 |
| B | 0 | 16038 | 2 |
| C | 0 | 11596 | 3 |
| D | 0 | 13443 | 2 |
| Quadrant | Total seconds | Saturated seconds | Saturation percentage |
|---|---|---|---|
| A | 5754 | 1075 | 18.682656% |
| B | 5754 | 303 | 5.265902% |
| C | 5753 | 4 | 0.069529% |
| D | 5753 | 150 | 2.607335% |
Noise dominated data is calculated using 1-second bins in cleaned event files. If a bin has >2000 counts, and if more than 50% of those come from <1% of pixels, then it is considered to be noise-dominated and hence unusable.
| Quadrant | # 1 sec bins | Bins with >0 counts | Bins with >2000 counts | High rate bins dominated by noise | Noise dominated (total time) | Noise dominated (detector-on time) | Marked lightcurve |
|---|---|---|---|---|---|---|---|
| A | 7186 | 5755 | 857 | 857 | 11.93% | 14.89% | 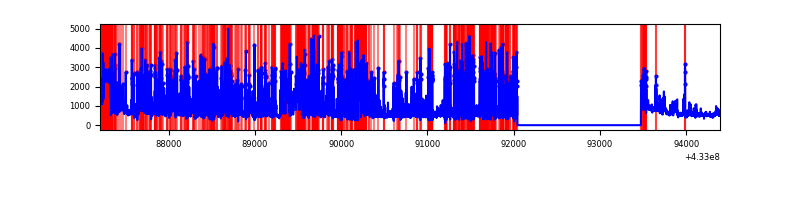 |
| B | 7186 | 5755 | 226 | 226 | 3.15% | 3.93% | 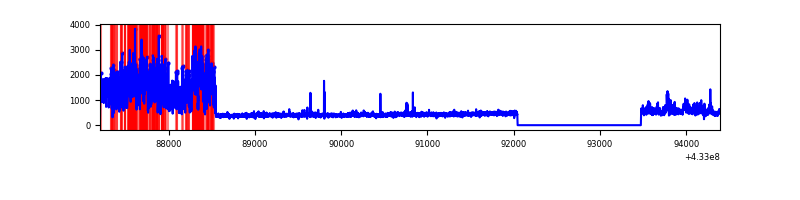 |
| C | 7185 | 5754 | 0 | 0 | 0.00% | 0.00% | 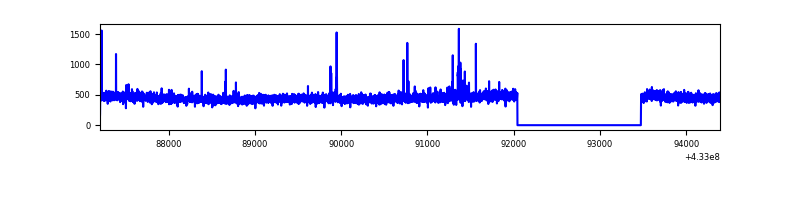 |
| D | 7185 | 5754 | 111 | 111 | 1.54% | 1.93% | 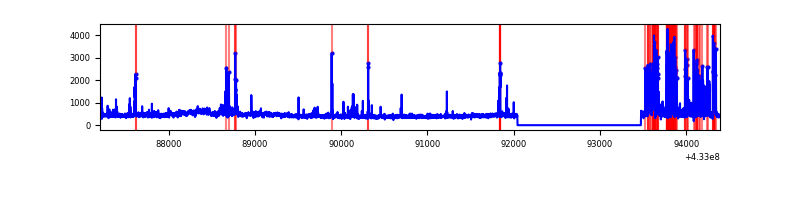 |
Top three noisy pixels from each quadrant. If the there are fewer than three noisy pixels in the level2.evt file, extra rows are filled as -1
| Pixel properties | Quadrant properties | ||||||
|---|---|---|---|---|---|---|---|
| Quadrant | DetID | PixID | Counts | Sigma | Mean | Median | Sigma |
| A | 15 | 222 | 2987808 | 26832.72 | 543 | 532 | 111.3 |
| A | 10 | 83 | 563987 | 5061.14 | 543 | 532 | 111.3 |
| A | 15 | 237 | 335298 | 3006.98 | 543 | 532 | 111.3 |
| B | 0 | 186 | 1571474 | 13716.73 | 596 | 579 | 114.5 |
| B | 4 | 67 | 22710 | 193.24 | 596 | 579 | 114.5 |
| B | 12 | 111 | 14381 | 120.52 | 596 | 579 | 114.5 |
| C | 15 | 214 | 238308 | 1708.49 | 590 | 593 | 139.1 |
| C | 14 | 254 | 35147 | 248.34 | 590 | 593 | 139.1 |
| C | 15 | 111 | 9610 | 64.81 | 590 | 593 | 139.1 |
| D | 12 | 233 | 499535 | 3462.74 | 589 | 571 | 144.1 |
| D | 1 | 52 | 228262 | 1580.14 | 589 | 571 | 144.1 |
| D | 1 | 47 | 57027 | 391.8 | 589 | 571 | 144.1 |
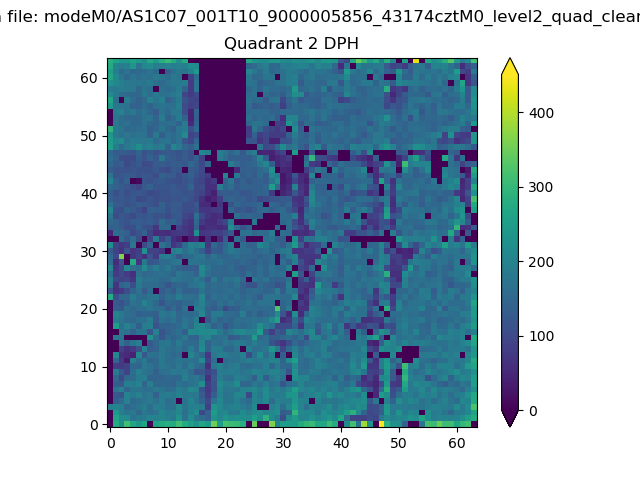
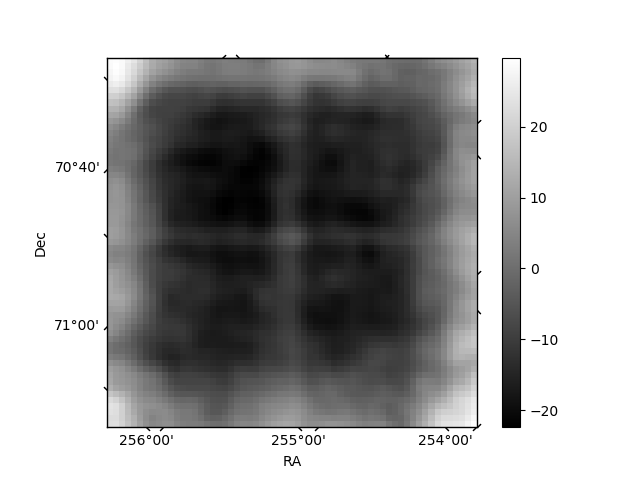
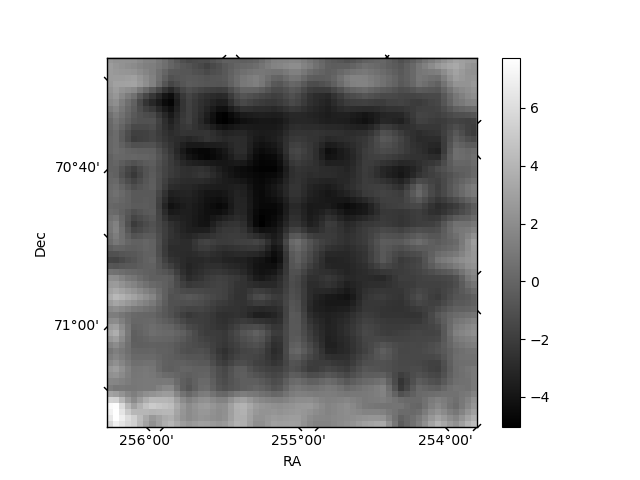
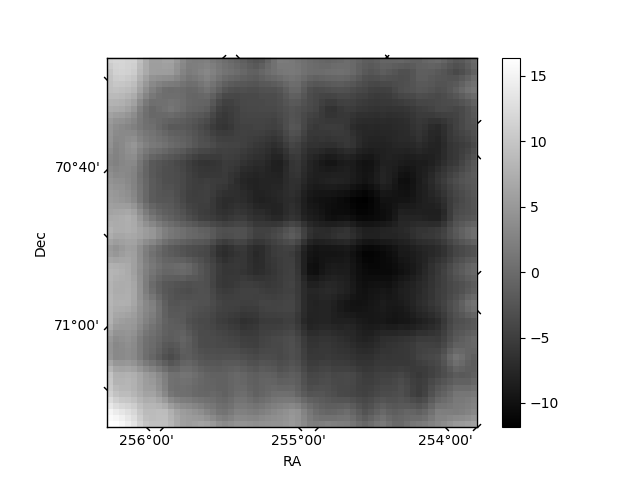
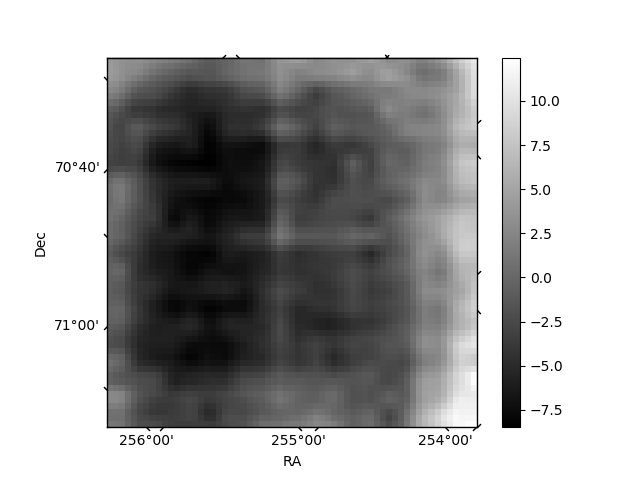
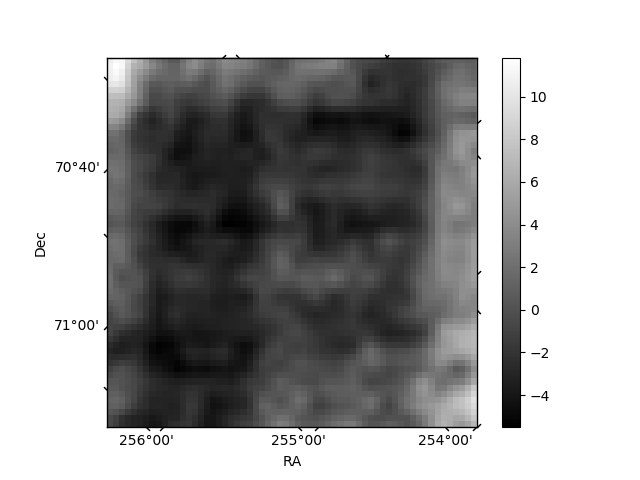
Histogram calculated using DETX and DETY for each event in the final _common_clean file
| Quadrant A | 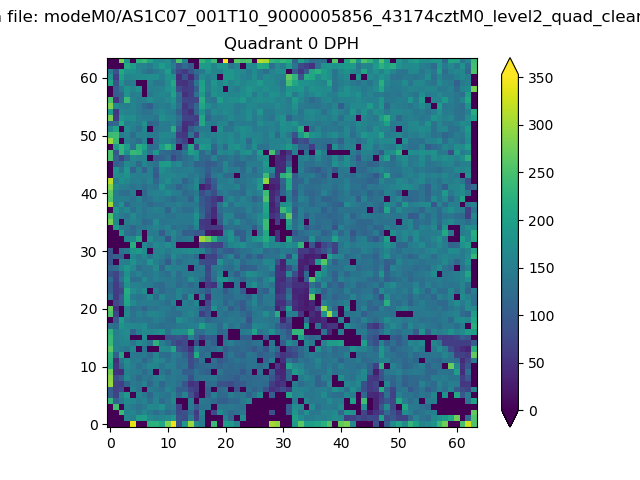 |
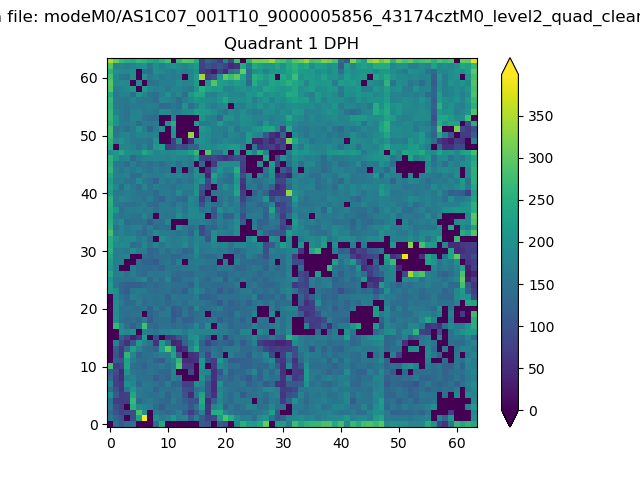 |
Quadrant B |
|---|---|---|---|
| Quadrant D | 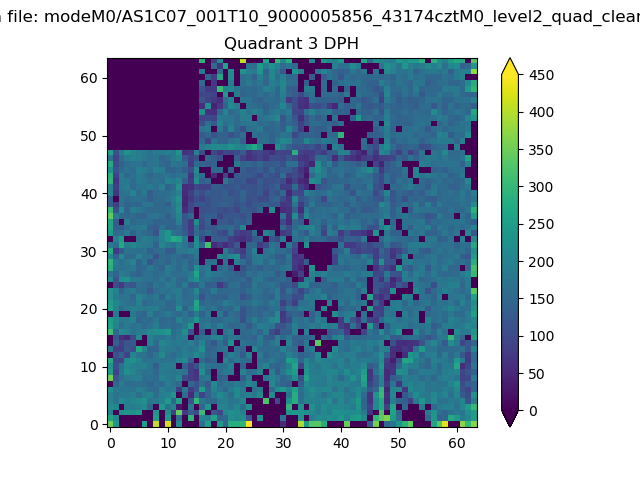 |
 |
Quadrant C |
| Plot type | Count rate plots | Images |
|---|---|---|
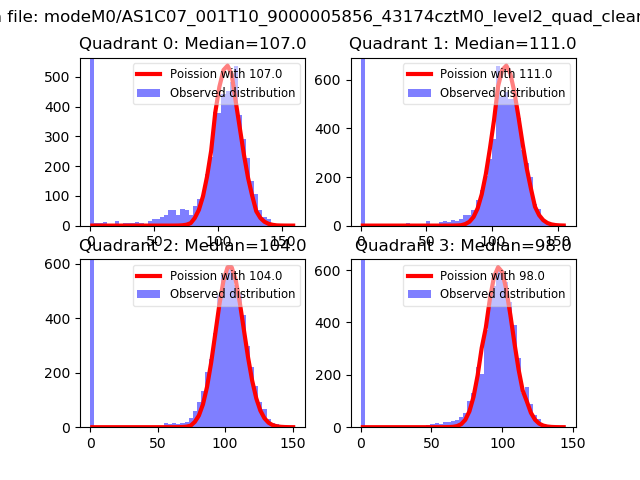
| Comparison with Poisson distribution Blue bars denote a histogram of data divided into 1 sec bins. Red curve is a Poisson curve with rate = median count rate of data. |
 |
 |
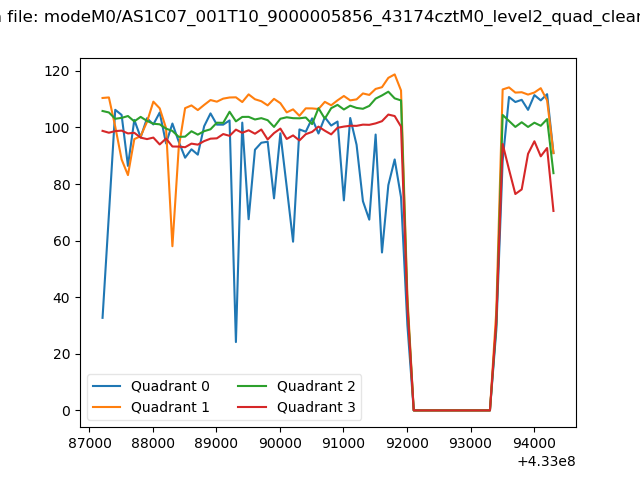
| Quadrant-wise count rates Data is divided into 100 sec bins |
 |
|
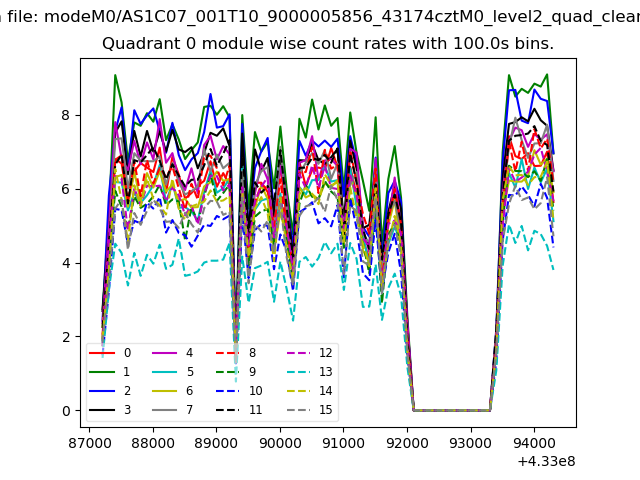
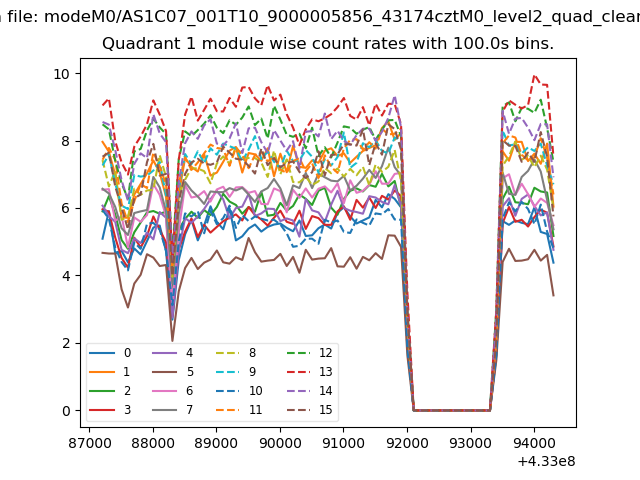
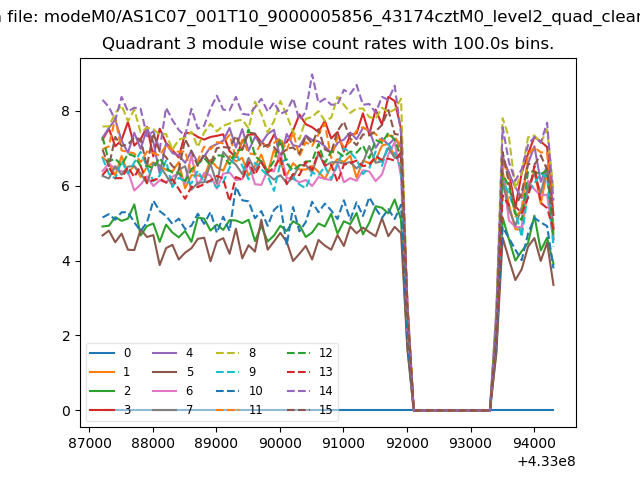
| Module-wise count rates for Quadrant A Data is divided into 100 sec bins |
 |
 |
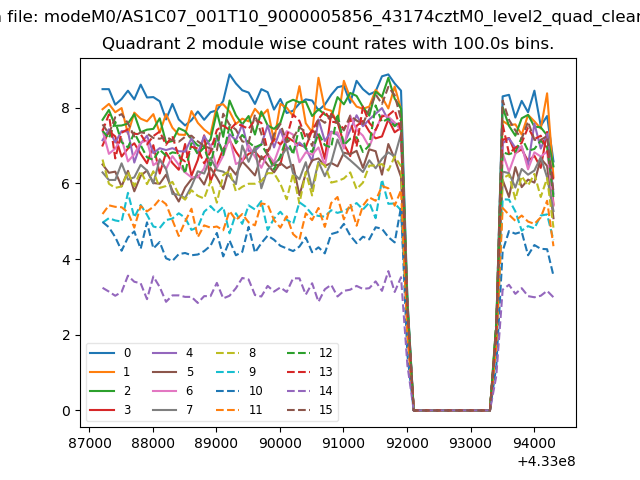
| Module-wise count rates for Quadrant B Data is divided into 100 sec bins |
 |
 |
| Module-wise count rates for Quadrant C Data is divided into 100 sec bins |
 |
 |
| Module-wise count rates for Quadrant D Data is divided into 100 sec bins |
 |
 |
| Parameter | Plot |
|---|---|
| CZT HV Monitor | 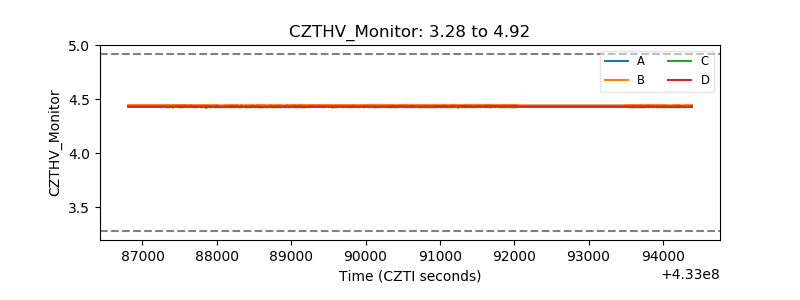 |
| D_VDD | 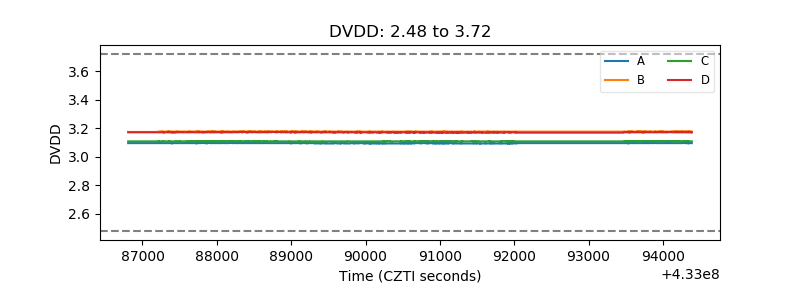 |
| Temperature 1 | 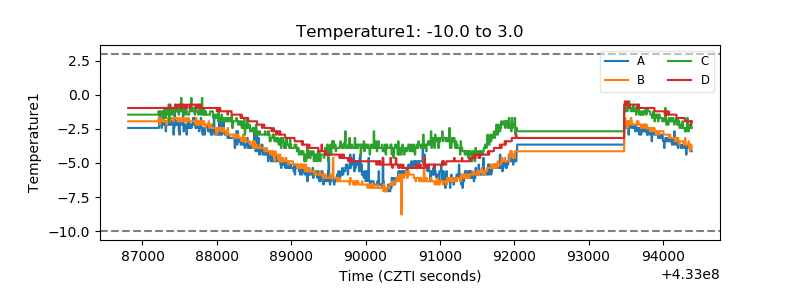 |
| Veto HV Monitor | 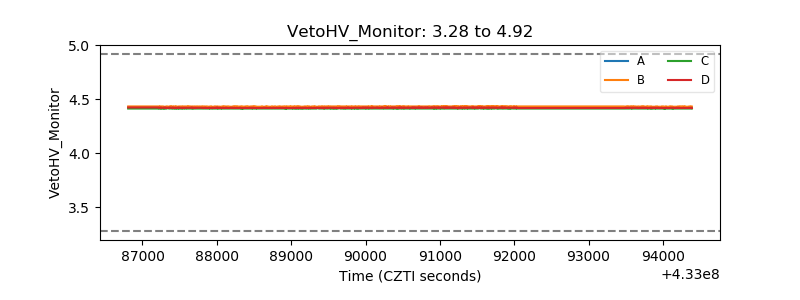 |
| Veto LLD | 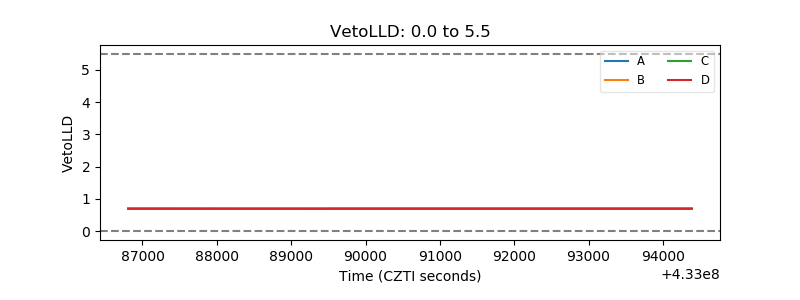 |
| Alpha Counter | 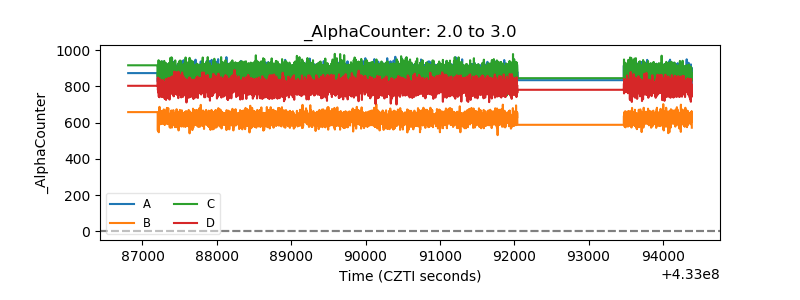 |
| _CPM_Rate |  |
| CZT Counter | 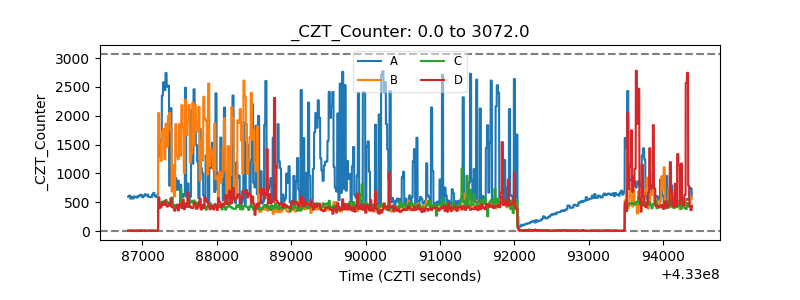 |
| +2.5 Volts monitor | 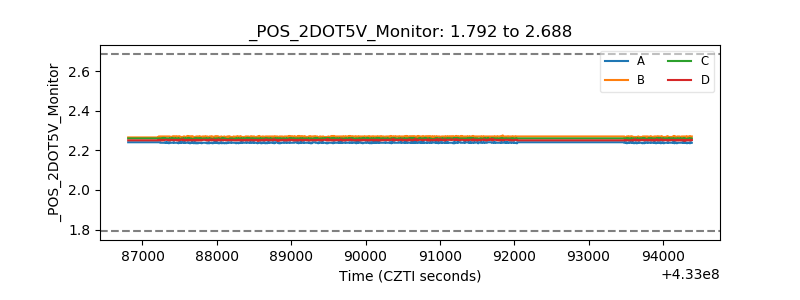 |
| +5 Volts monitor | 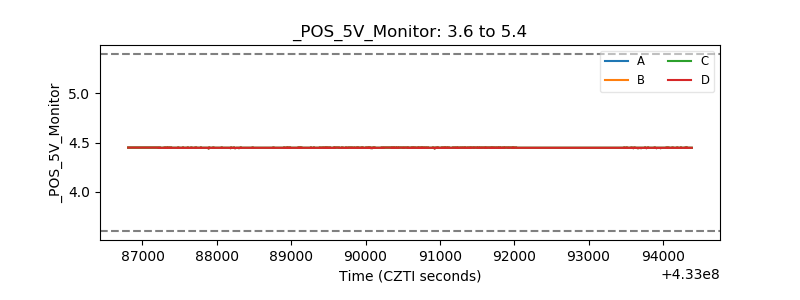 |
| _ROLL_ROT | 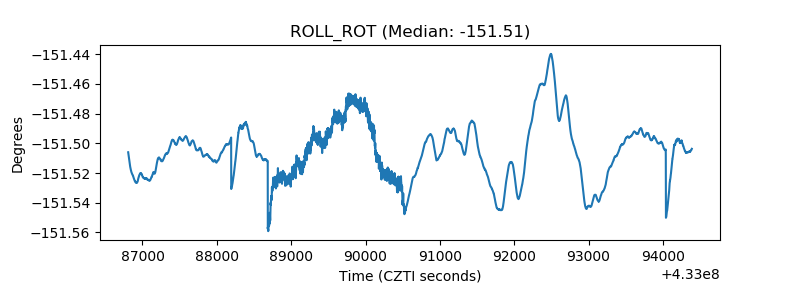 |
| _Roll_DEC | 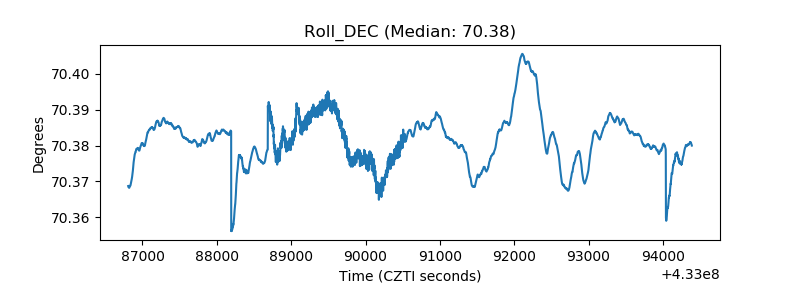 |
| _Roll_RA | 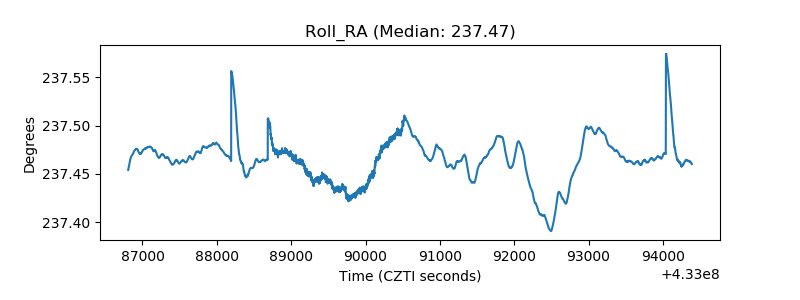 |
| Veto Counter | 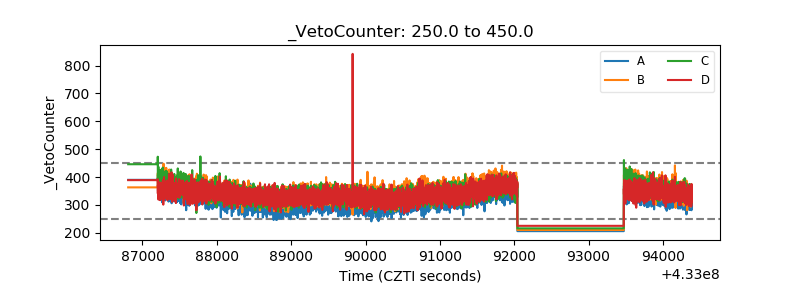 |