| Param | Original file | Final file |
|---|---|---|
| Filename | modeM0/AS1C07_001T10_9000005856_43178cztM0_level2.fits | modeM0/AS1C07_001T10_9000005856_43178cztM0_level2_quad_clean.evt |
| Size (bytes) | 1,032,816,960 | 241,007,040 |
| Size | 985.0 MB | 229.8 MB |
| Events in quadrant A | 12,657,601 | 1,466,451 |
| Events in quadrant B | 7,353,978 | 1,685,642 |
| Events in quadrant C | 8,638,056 | 1,588,529 |
| Events in quadrant D | 8,371,576 | 1,478,641 |
| Mode M9 | |||
|---|---|---|---|
| Quadrant | BADHDUFLAG | Total packets | Discarded packets |
| A | 0 | 46 | 0 |
| B | 0 | 47 | 0 |
| C | 0 | 47 | 0 |
| D | 0 | 47 | 0 |
| Mode SS | |||
|---|---|---|---|
| Quadrant | BADHDUFLAG | Total packets | Discarded packets |
| A | 0 | 318 | 0 |
| B | 0 | 318 | 0 |
| C | 0 | 318 | 0 |
| D | 0 | 318 | 0 |
| Mode M0 | |||
|---|---|---|---|
| Quadrant | BADHDUFLAG | Total packets | Discarded packets |
| A | 0 | 47678 | 5 |
| B | 0 | 33474 | 4 |
| C | 0 | 36194 | 4 |
| D | 0 | 36653 | 4 |
| Quadrant | Total seconds | Saturated seconds | Saturation percentage |
|---|---|---|---|
| A | 15620 | 1753 | 11.222791% |
| B | 15620 | 140 | 0.896287% |
| C | 15620 | 264 | 1.690141% |
| D | 15620 | 387 | 2.477593% |
Noise dominated data is calculated using 1-second bins in cleaned event files. If a bin has >2000 counts, and if more than 50% of those come from <1% of pixels, then it is considered to be noise-dominated and hence unusable.
| Quadrant | # 1 sec bins | Bins with >0 counts | Bins with >2000 counts | High rate bins dominated by noise | Noise dominated (total time) | Noise dominated (detector-on time) | Marked lightcurve |
|---|---|---|---|---|---|---|---|
| A | 19766 | 15623 | 1622 | 1622 | 8.21% | 10.38% | 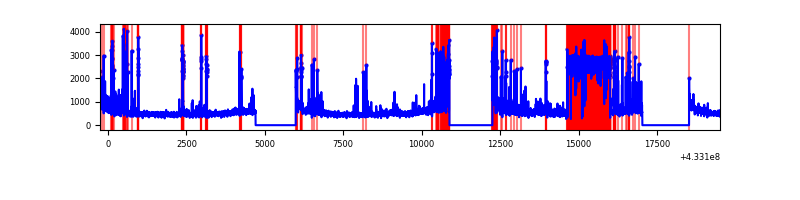 |
| B | 19766 | 15623 | 116 | 116 | 0.59% | 0.74% | 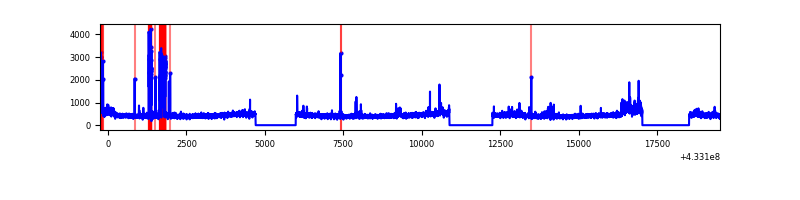 |
| C | 19766 | 15623 | 267 | 267 | 1.35% | 1.71% | 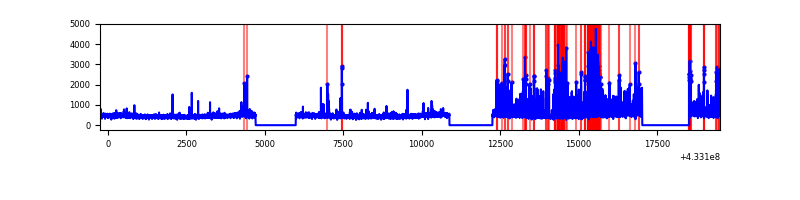 |
| D | 19766 | 15623 | 397 | 397 | 2.01% | 2.54% | 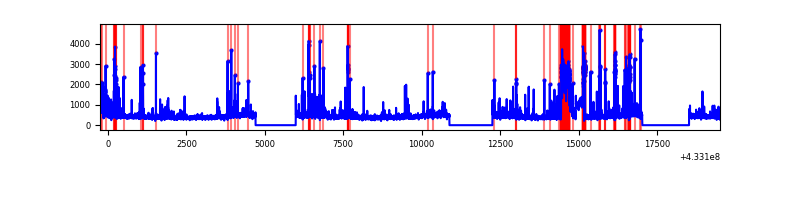 |
Top three noisy pixels from each quadrant. If the there are fewer than three noisy pixels in the level2.evt file, extra rows are filled as -1
| Pixel properties | Quadrant properties | ||||||
|---|---|---|---|---|---|---|---|
| Quadrant | DetID | PixID | Counts | Sigma | Mean | Median | Sigma |
| A | 15 | 222 | 4250645 | 13474.19 | 1550 | 1514 | 315.4 |
| A | 10 | 83 | 1428467 | 4524.93 | 1550 | 1514 | 315.4 |
| A | 15 | 237 | 445543 | 1408.04 | 1550 | 1514 | 315.4 |
| B | 0 | 229 | 450436 | 1417.56 | 1647 | 1600 | 316.6 |
| B | 0 | 186 | 247021 | 775.11 | 1647 | 1600 | 316.6 |
| B | 0 | 189 | 132126 | 412.24 | 1647 | 1600 | 316.6 |
| C | 0 | 239 | 1536717 | 4087.17 | 1606 | 1614 | 375.6 |
| C | 15 | 214 | 641797 | 1704.47 | 1606 | 1614 | 375.6 |
| C | 4 | 254 | 83488 | 217.99 | 1606 | 1614 | 375.6 |
| D | 13 | 249 | 1055532 | 2685.52 | 1610 | 1561 | 392.5 |
| D | 1 | 52 | 754889 | 1919.48 | 1610 | 1561 | 392.5 |
| D | 12 | 233 | 170340 | 430.05 | 1610 | 1561 | 392.5 |
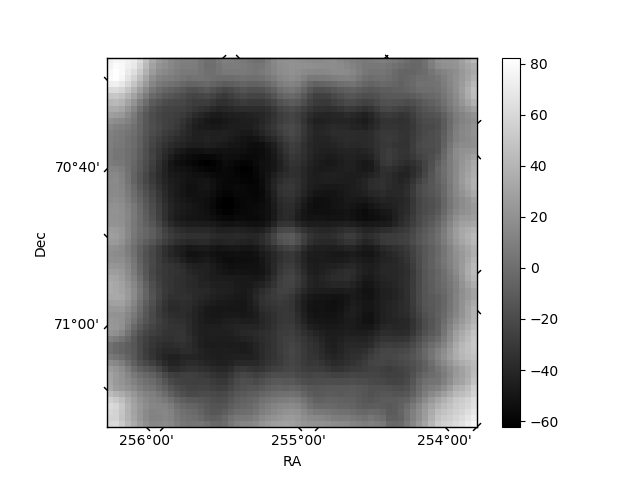
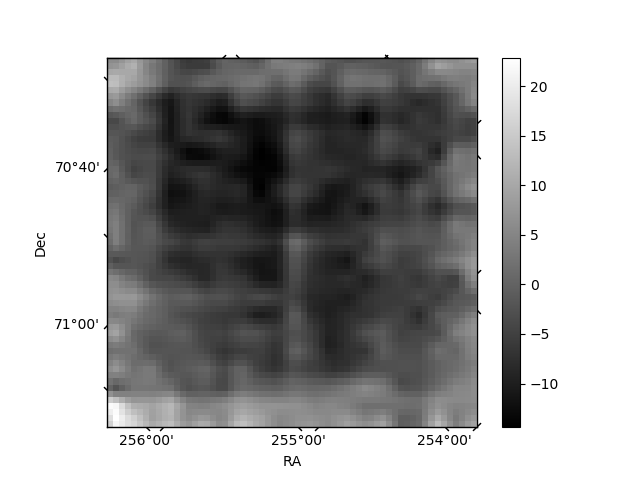
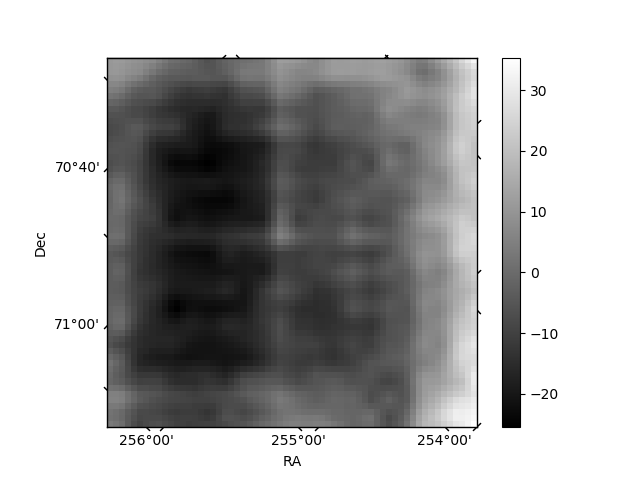
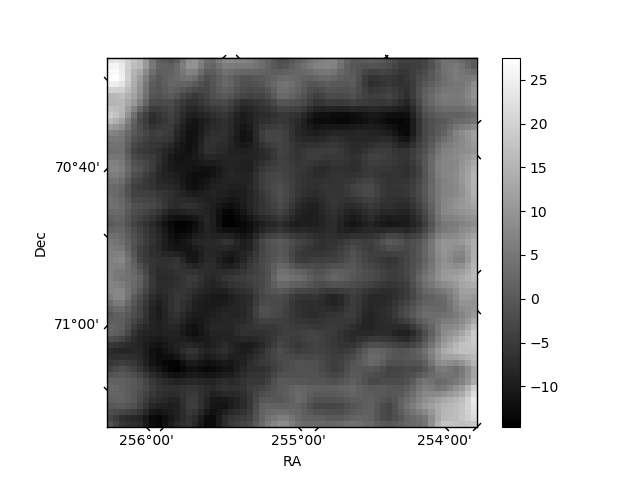
Histogram calculated using DETX and DETY for each event in the final _common_clean file
| Quadrant A | 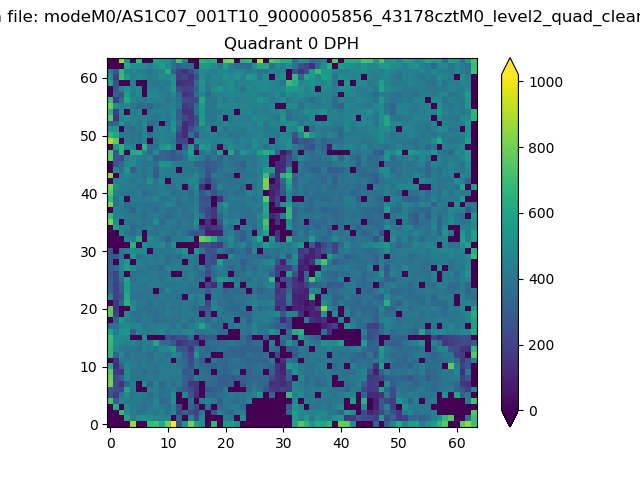 |
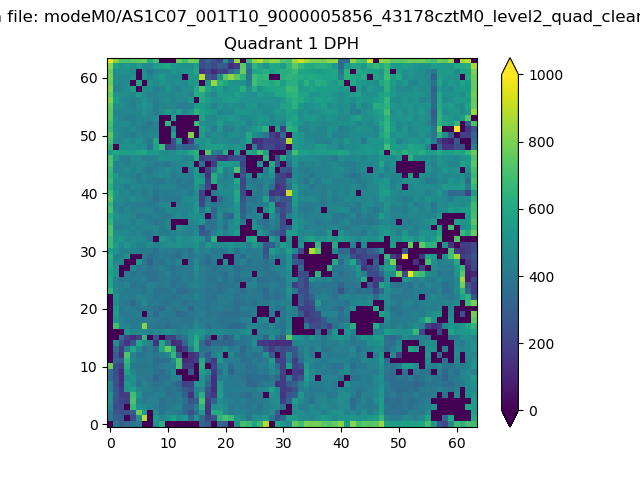 |
Quadrant B |
|---|---|---|---|
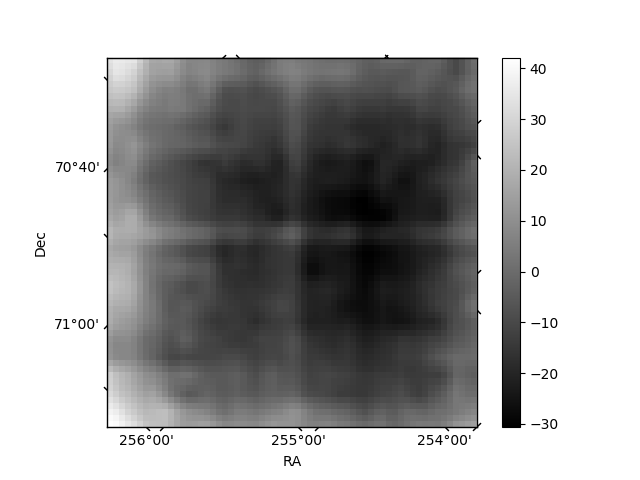
| Quadrant D | 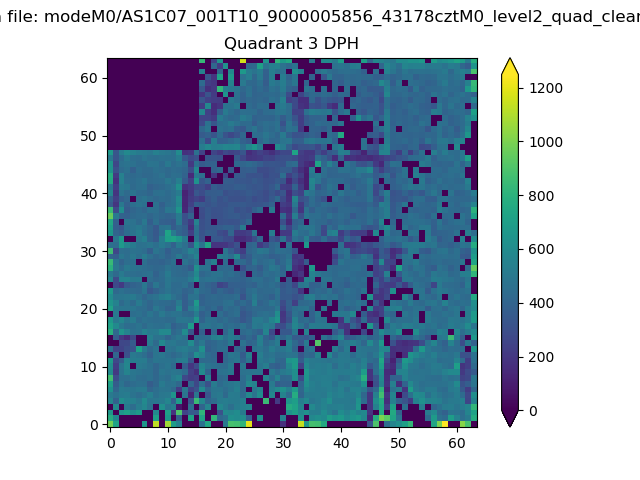 |
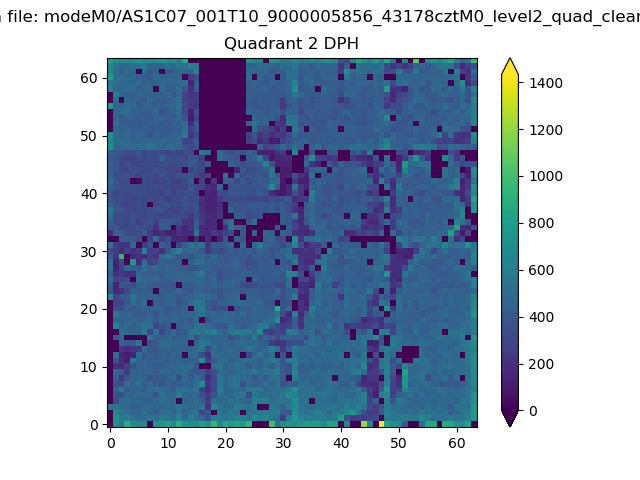 |
Quadrant C |
| Plot type | Count rate plots | Images |
|---|---|---|
| Comparison with Poisson distribution Blue bars denote a histogram of data divided into 1 sec bins. Red curve is a Poisson curve with rate = median count rate of data. |
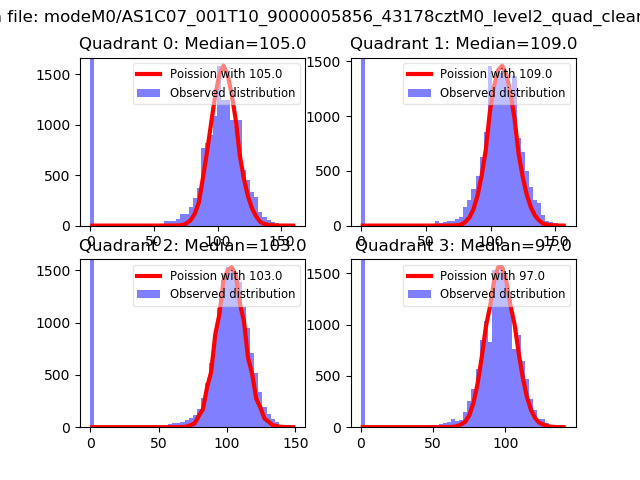 |
 |
| Quadrant-wise count rates Data is divided into 100 sec bins |
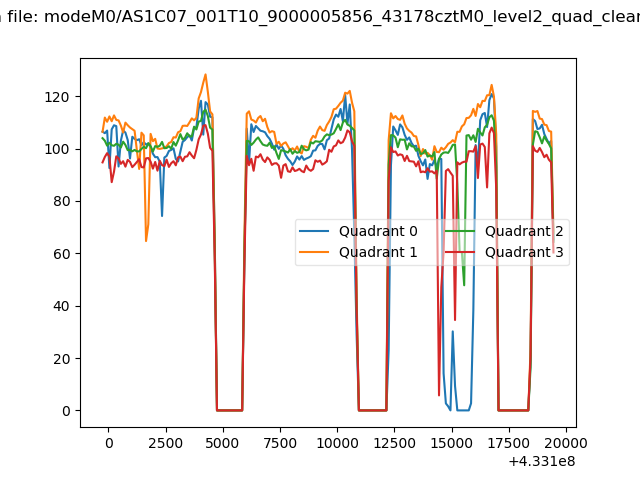 |
|
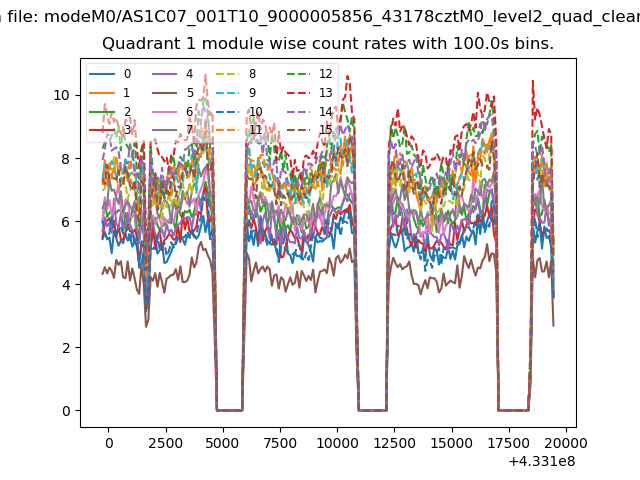
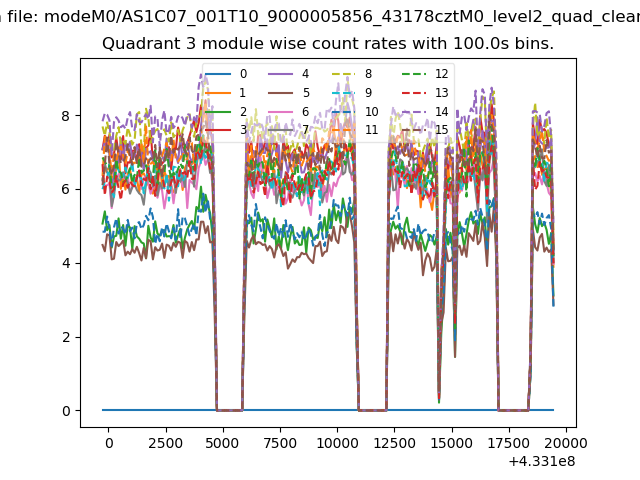
| Module-wise count rates for Quadrant A Data is divided into 100 sec bins |
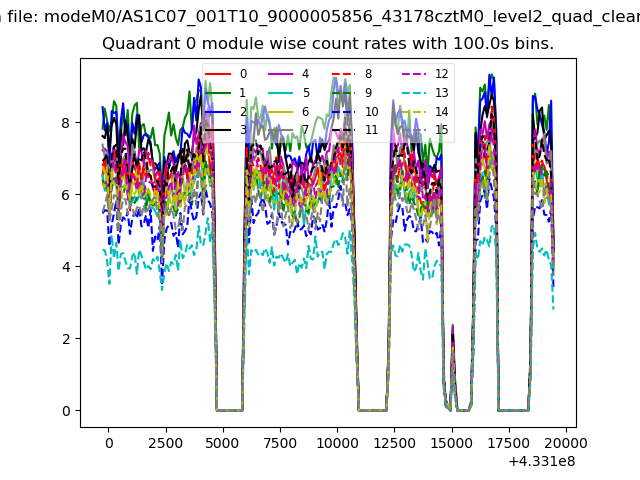 |
 |
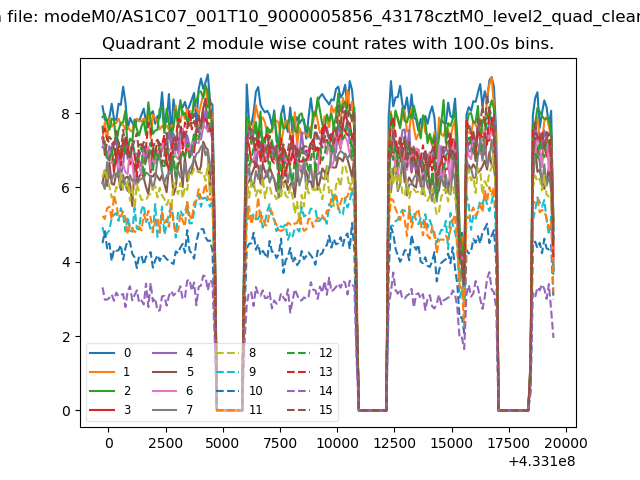
| Module-wise count rates for Quadrant B Data is divided into 100 sec bins |
 |
 |
| Module-wise count rates for Quadrant C Data is divided into 100 sec bins |
 |
 |
| Module-wise count rates for Quadrant D Data is divided into 100 sec bins |
 |
 |
| Parameter | Plot |
|---|---|
| CZT HV Monitor | 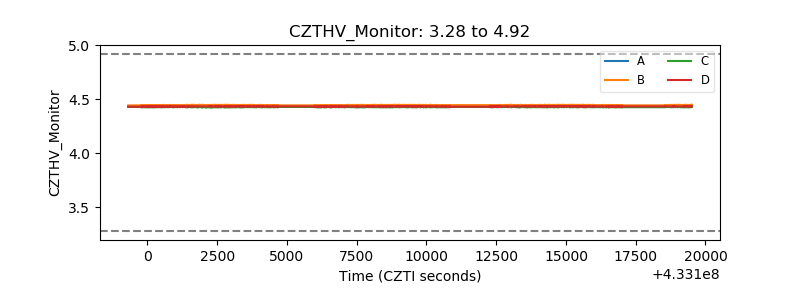 |
| D_VDD | 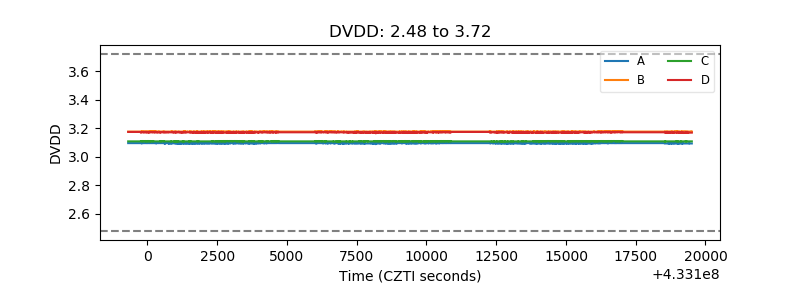 |
| Temperature 1 | 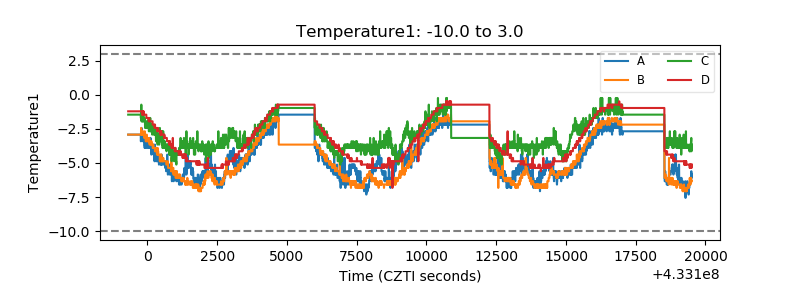 |
| Veto HV Monitor | 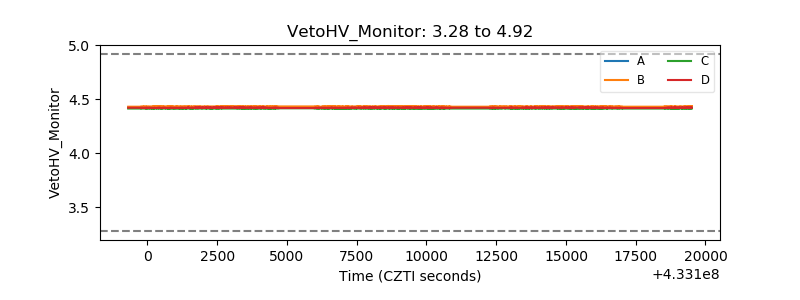 |
| Veto LLD | 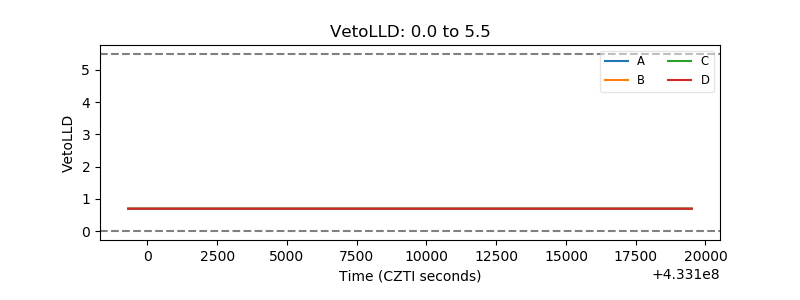 |
| Alpha Counter | 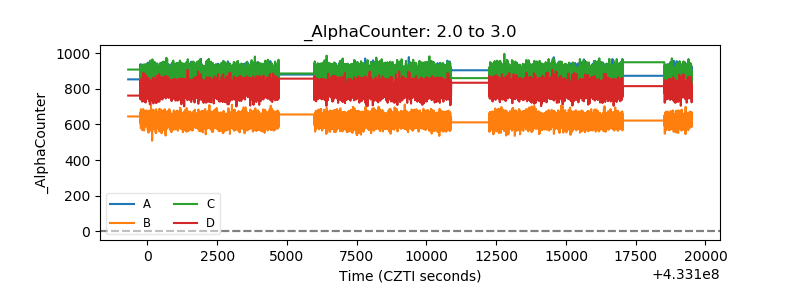 |
| _CPM_Rate | 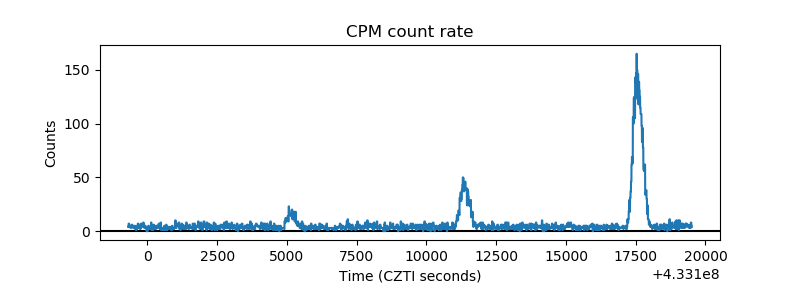 |
| CZT Counter | 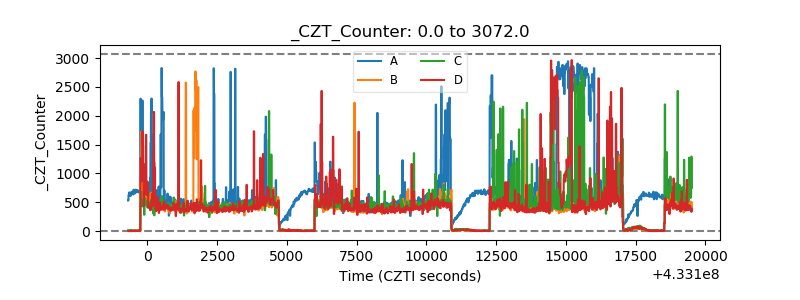 |
| +2.5 Volts monitor | 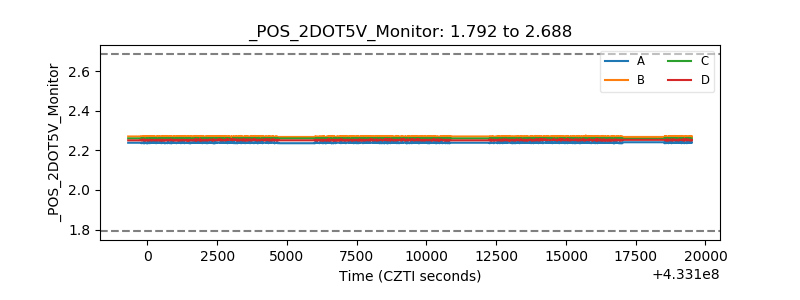 |
| +5 Volts monitor | 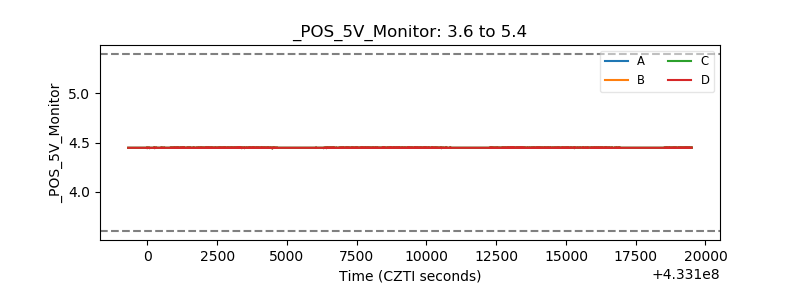 |
| _ROLL_ROT | 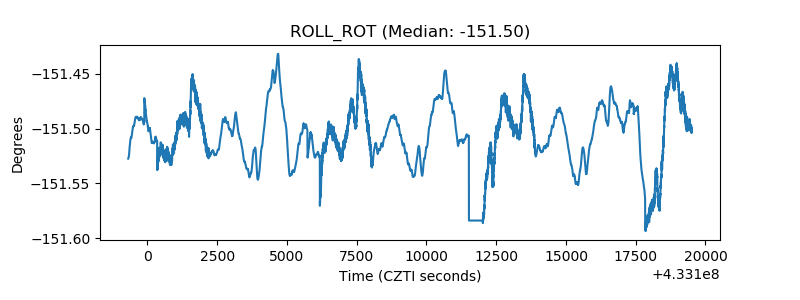 |
| _Roll_DEC | 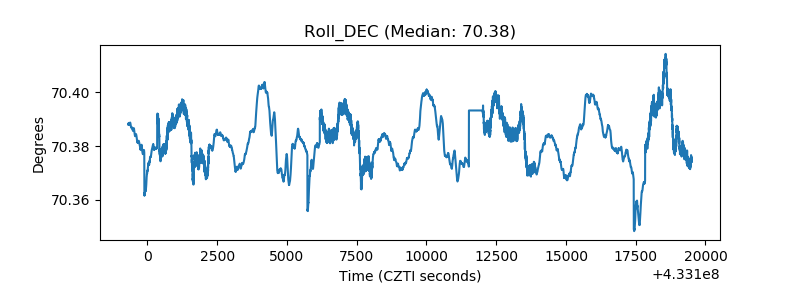 |
| _Roll_RA | 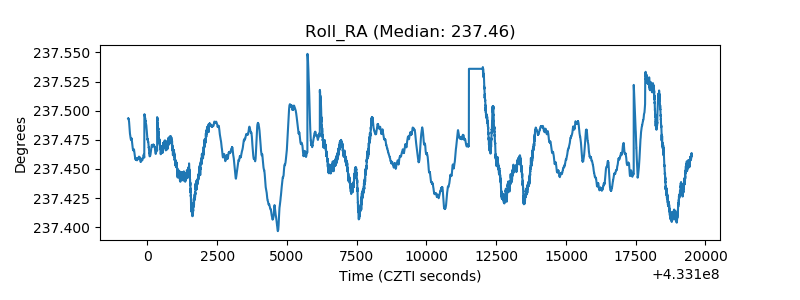 |
| Veto Counter | 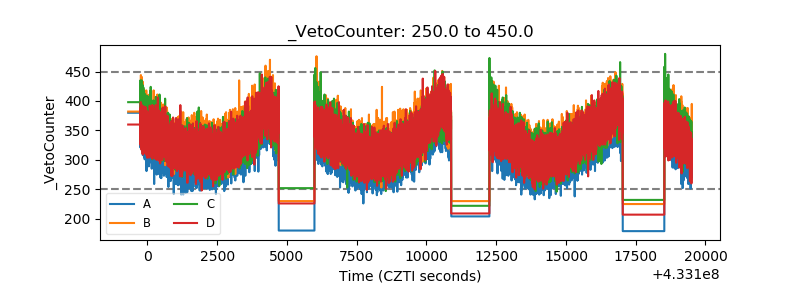 |