| Param | Original file | Final file |
|---|---|---|
| Filename | modeM0/AS1C07_001T10_9000005856_43179cztM0_level2.fits | modeM0/AS1C07_001T10_9000005856_43179cztM0_level2_quad_clean.evt |
| Size (bytes) | 350,985,600 | 90,103,680 |
| Size | 334.7 MB | 85.9 MB |
| Events in quadrant A | 3,226,549 | 595,181 |
| Events in quadrant B | 2,741,555 | 612,523 |
| Events in quadrant C | 4,080,008 | 580,300 |
| Events in quadrant D | 2,505,345 | 546,046 |
| Mode M9 | |||
|---|---|---|---|
| Quadrant | BADHDUFLAG | Total packets | Discarded packets |
| A | 0 | 23 | 0 |
| B | 0 | 24 | 0 |
| C | 0 | 24 | 0 |
| D | 0 | 24 | 0 |
| Mode SS | |||
|---|---|---|---|
| Quadrant | BADHDUFLAG | Total packets | Discarded packets |
| A | 0 | 114 | 0 |
| B | 0 | 114 | 0 |
| C | 0 | 114 | 0 |
| D | 0 | 114 | 0 |
| Mode M0 | |||
|---|---|---|---|
| Quadrant | BADHDUFLAG | Total packets | Discarded packets |
| A | 0 | 13321 | 2 |
| B | 0 | 12337 | 2 |
| C | 0 | 15998 | 2 |
| D | 0 | 11814 | 2 |
| Quadrant | Total seconds | Saturated seconds | Saturation percentage |
|---|---|---|---|
| A | 5638 | 58 | 1.028734% |
| B | 5638 | 32 | 0.567577% |
| C | 5638 | 94 | 1.667258% |
| D | 5638 | 15 | 0.266052% |
Noise dominated data is calculated using 1-second bins in cleaned event files. If a bin has >2000 counts, and if more than 50% of those come from <1% of pixels, then it is considered to be noise-dominated and hence unusable.
| Quadrant | # 1 sec bins | Bins with >0 counts | Bins with >2000 counts | High rate bins dominated by noise | Noise dominated (total time) | Noise dominated (detector-on time) | Marked lightcurve |
|---|---|---|---|---|---|---|---|
| A | 7250 | 5639 | 36 | 36 | 0.50% | 0.64% | 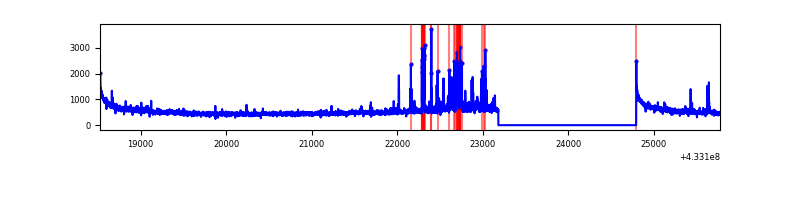 |
| B | 7250 | 5639 | 20 | 20 | 0.28% | 0.35% | 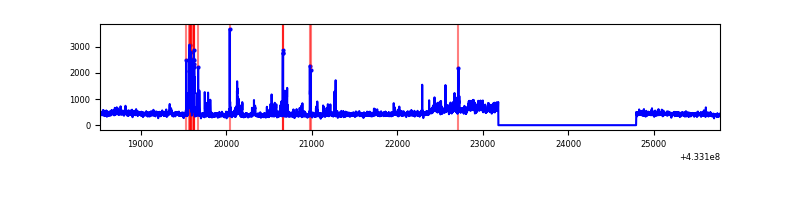 |
| C | 7250 | 5639 | 85 | 85 | 1.17% | 1.51% | 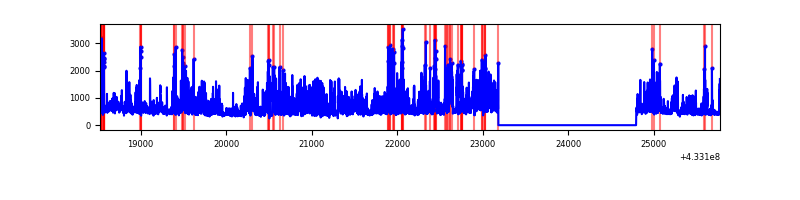 |
| D | 7250 | 5639 | 12 | 12 | 0.17% | 0.21% | 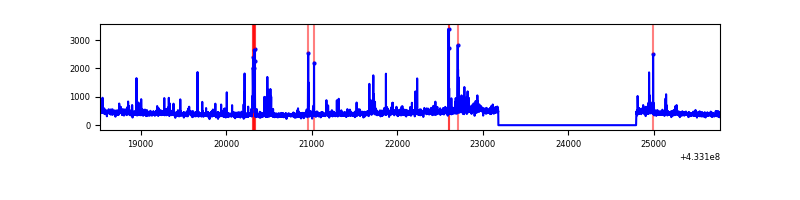 |
Top three noisy pixels from each quadrant. If the there are fewer than three noisy pixels in the level2.evt file, extra rows are filled as -1
| Pixel properties | Quadrant properties | ||||||
|---|---|---|---|---|---|---|---|
| Quadrant | DetID | PixID | Counts | Sigma | Mean | Median | Sigma |
| A | 10 | 83 | 584112 | 4755.24 | 595 | 582 | 122.7 |
| A | 13 | 248 | 147801 | 1199.7 | 595 | 582 | 122.7 |
| A | 15 | 237 | 91464 | 740.6 | 595 | 582 | 122.7 |
| B | 0 | 189 | 207155 | 1775.2 | 595 | 578 | 116.4 |
| B | 0 | 186 | 156716 | 1341.76 | 595 | 578 | 116.4 |
| B | 5 | 255 | 36137 | 305.57 | 595 | 578 | 116.4 |
| C | 0 | 239 | 1544226 | 11477.89 | 578 | 580 | 134.5 |
| C | 15 | 214 | 235583 | 1747.38 | 578 | 580 | 134.5 |
| C | 14 | 254 | 18285 | 131.65 | 578 | 580 | 134.5 |
| D | 1 | 52 | 87369 | 600.25 | 582 | 565 | 144.6 |
| D | 1 | 47 | 69491 | 476.62 | 582 | 565 | 144.6 |
| D | 7 | 96 | 39167 | 266.93 | 582 | 565 | 144.6 |
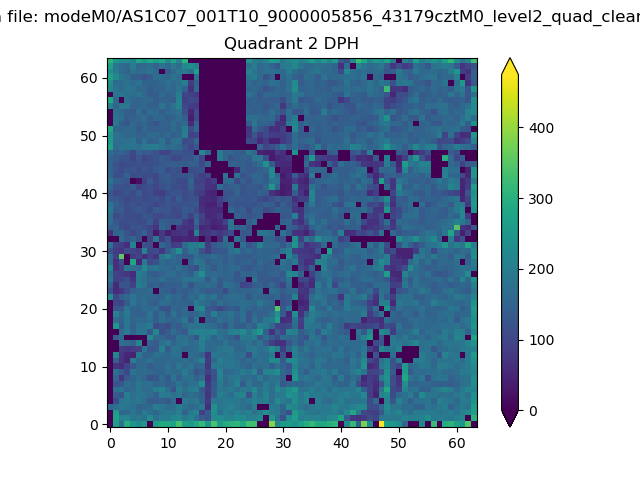
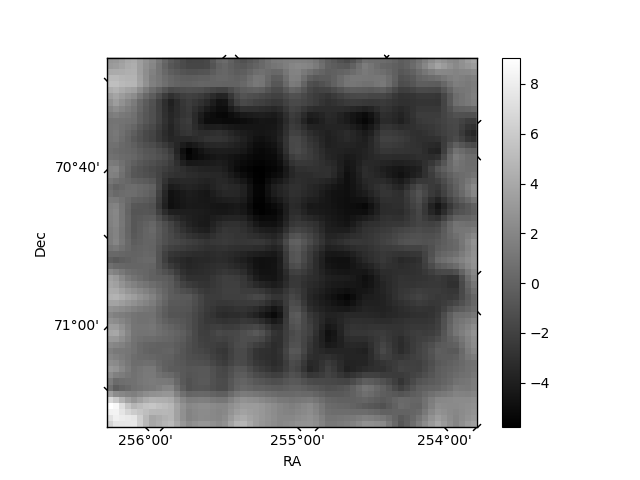
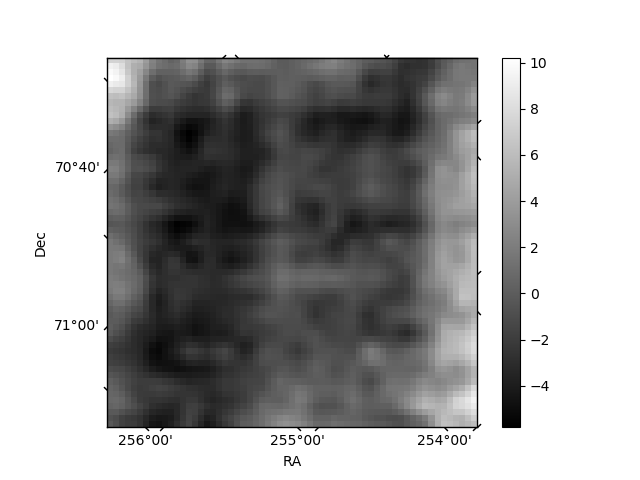
Histogram calculated using DETX and DETY for each event in the final _common_clean file
| Quadrant A | 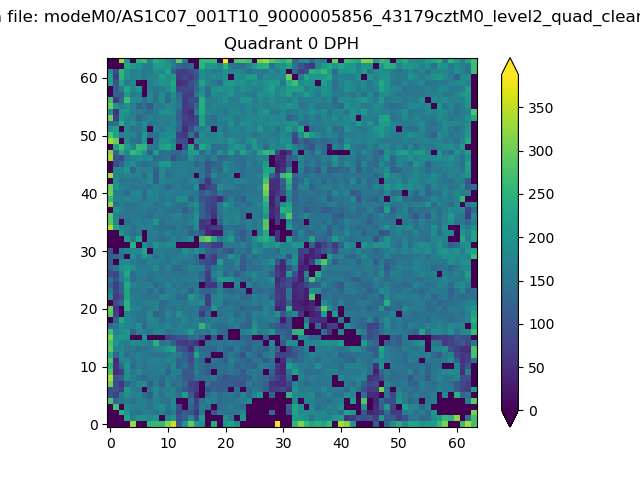 |
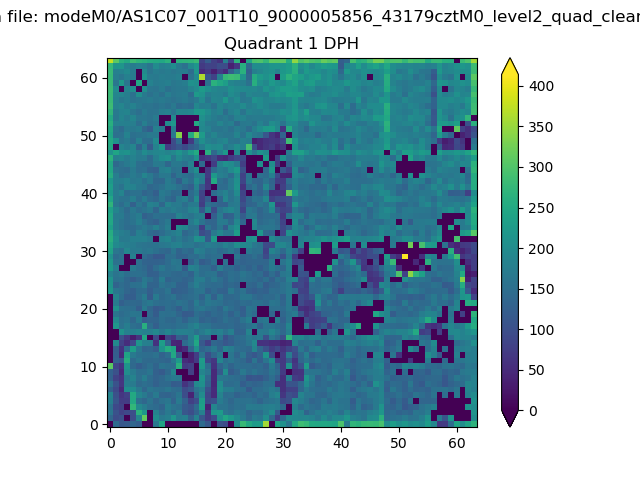 |
Quadrant B |
|---|---|---|---|
| Quadrant D | 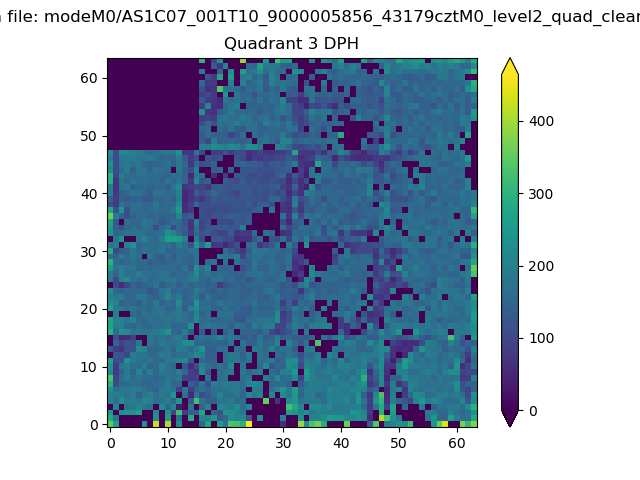 |
 |
Quadrant C |
| Plot type | Count rate plots | Images |
|---|---|---|
| Comparison with Poisson distribution Blue bars denote a histogram of data divided into 1 sec bins. Red curve is a Poisson curve with rate = median count rate of data. |
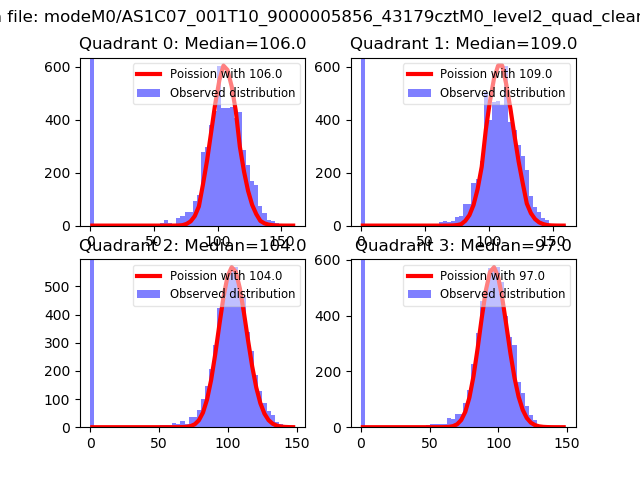 |
 |
| Quadrant-wise count rates Data is divided into 100 sec bins |
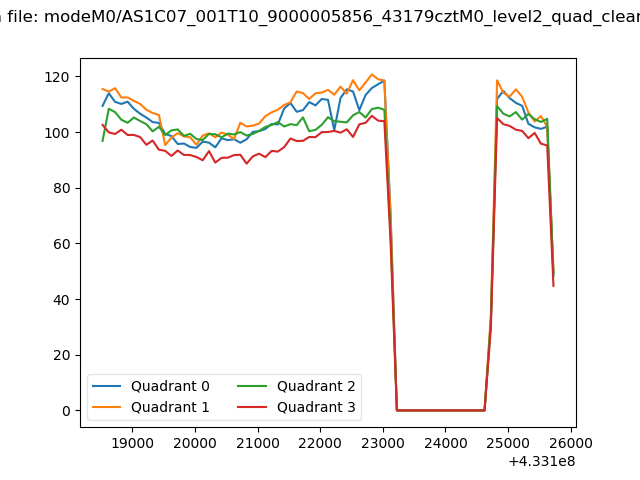 |
|
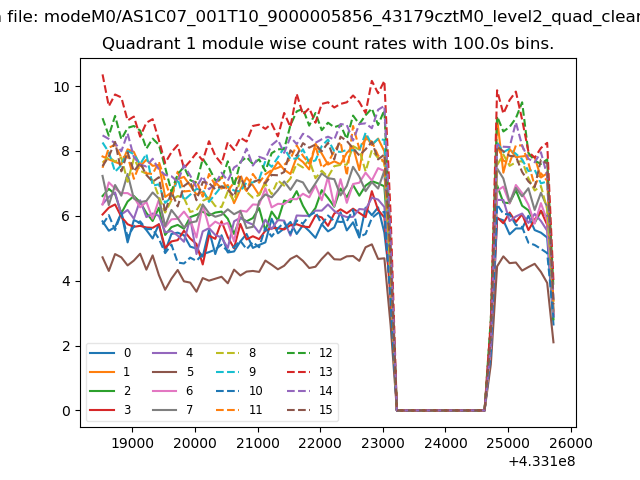
| Module-wise count rates for Quadrant A Data is divided into 100 sec bins |
 |
 |
| Module-wise count rates for Quadrant B Data is divided into 100 sec bins |
 |
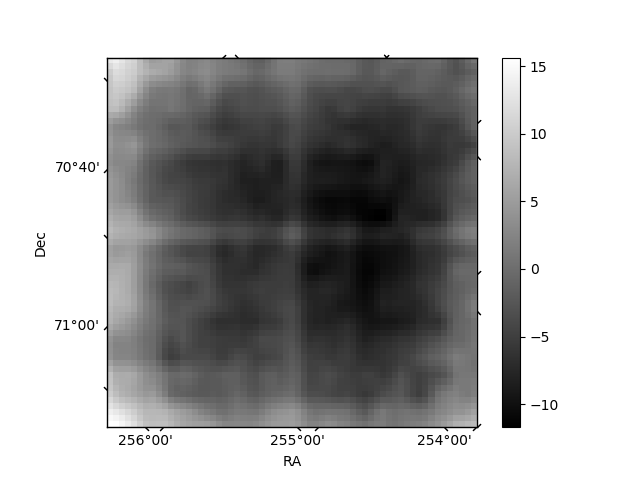 |
| Module-wise count rates for Quadrant C Data is divided into 100 sec bins |
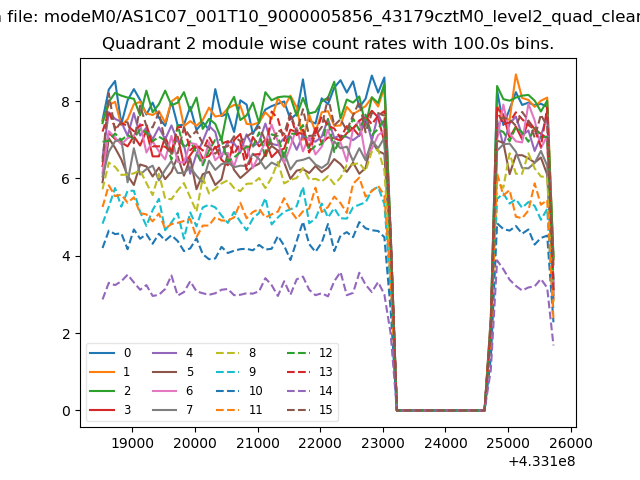 |
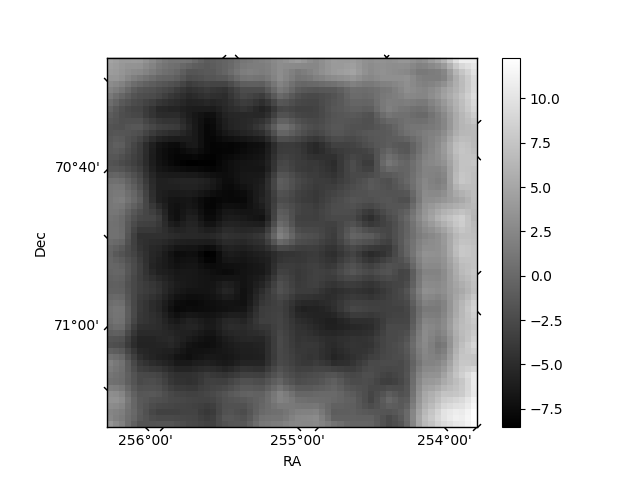 |
| Module-wise count rates for Quadrant D Data is divided into 100 sec bins |
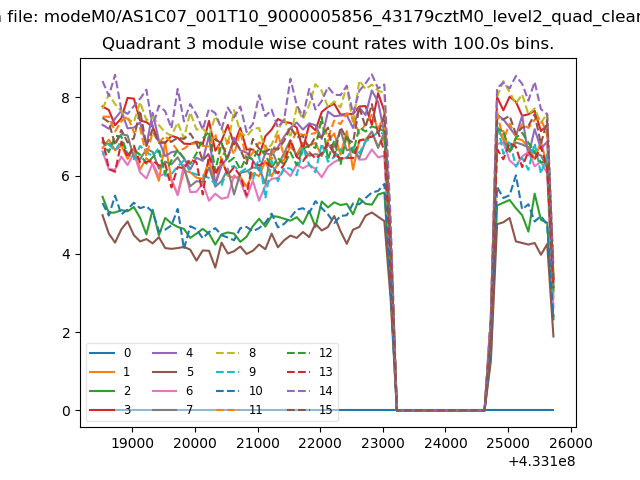 |
 |
| Parameter | Plot |
|---|---|
| CZT HV Monitor | 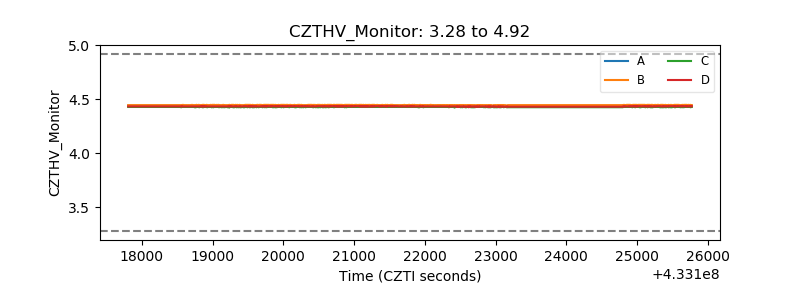 |
| D_VDD | 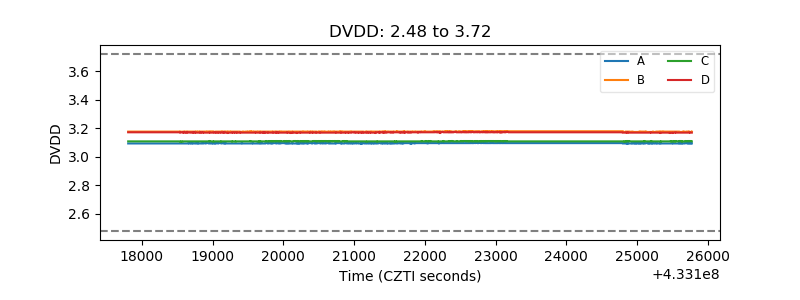 |
| Temperature 1 | 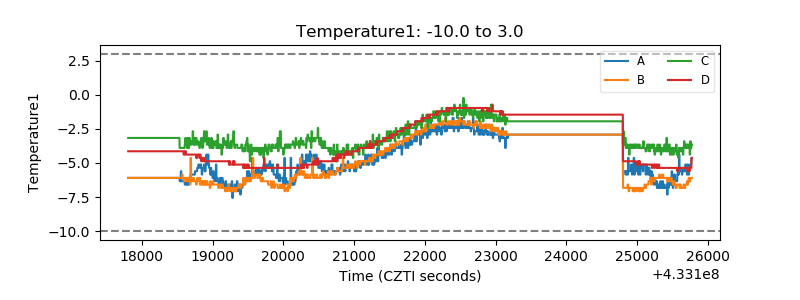 |
| Veto HV Monitor | 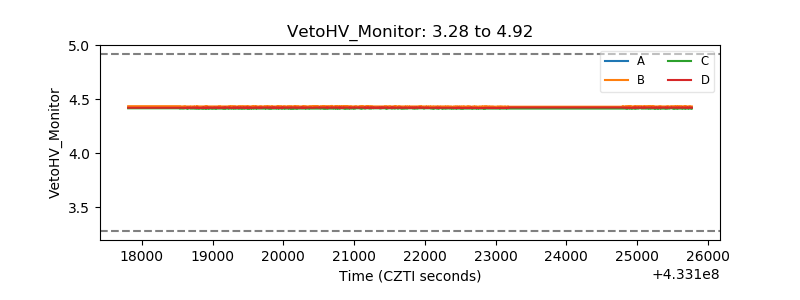 |
| Veto LLD | 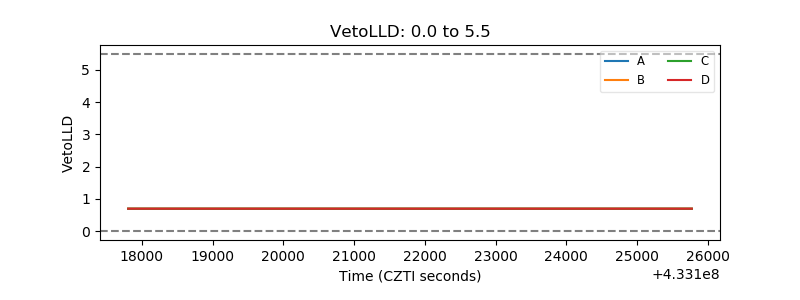 |
| Alpha Counter | 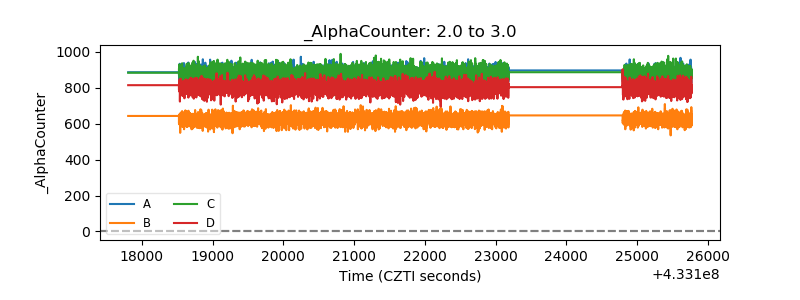 |
| _CPM_Rate | 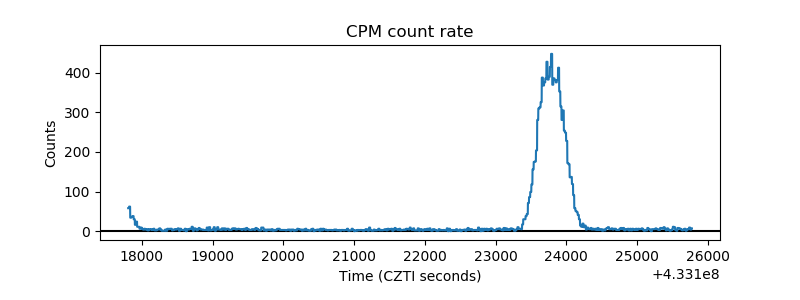 |
| CZT Counter | 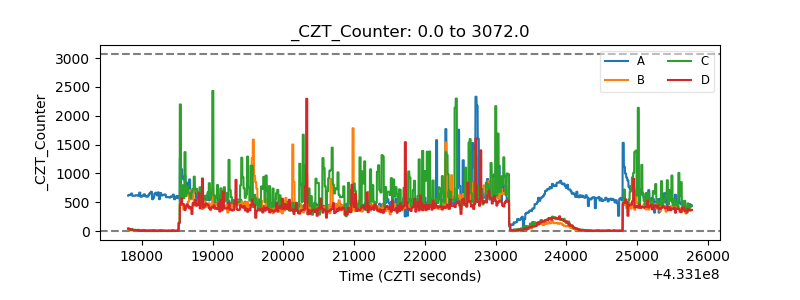 |
| +2.5 Volts monitor | 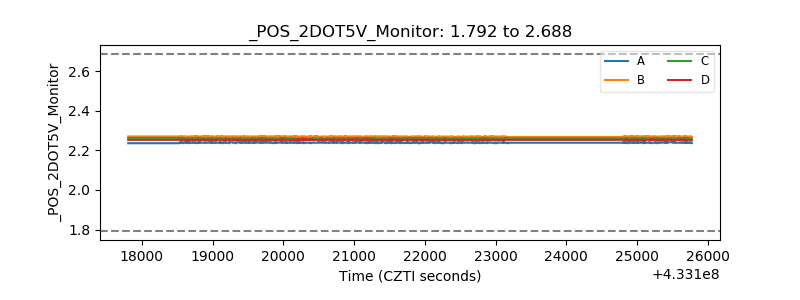 |
| +5 Volts monitor | 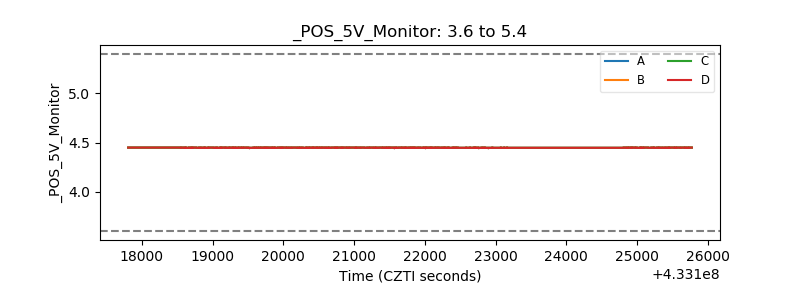 |
| _ROLL_ROT | 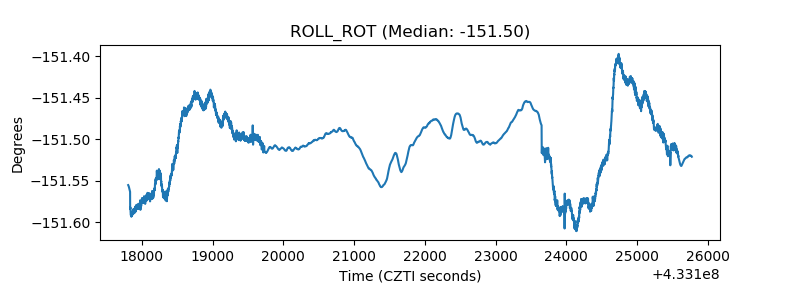 |
| _Roll_DEC | 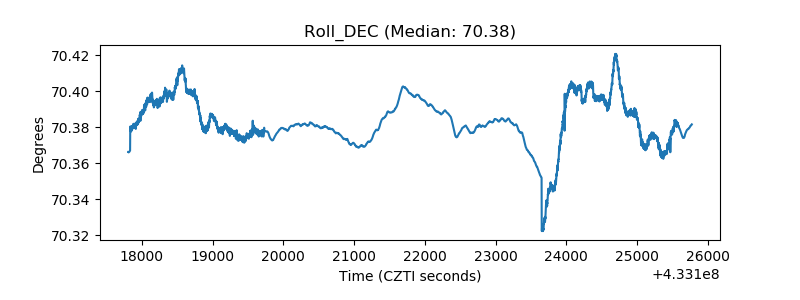 |
| _Roll_RA |  |
| Veto Counter | 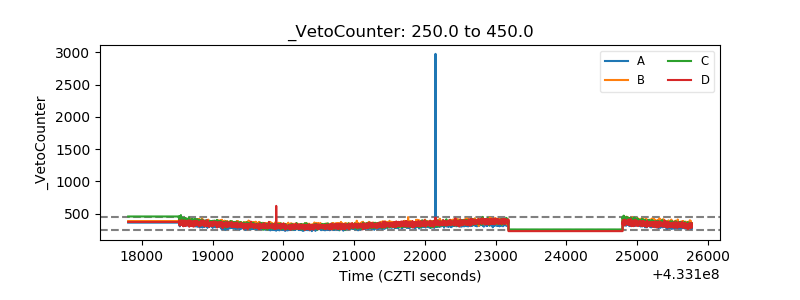 |