| Param | Original file | Final file |
|---|---|---|
| Filename | modeM0/AS1C07_001T10_9000005856_43181cztM0_level2.fits | modeM0/AS1C07_001T10_9000005856_43181cztM0_level2_quad_clean.evt |
| Size (bytes) | 337,158,720 | 88,436,160 |
| Size | 321.5 MB | 84.3 MB |
| Events in quadrant A | 3,484,615 | 577,260 |
| Events in quadrant B | 2,586,081 | 604,357 |
| Events in quadrant C | 3,465,008 | 572,862 |
| Events in quadrant D | 2,516,840 | 538,762 |
| Mode M9 | |||
|---|---|---|---|
| Quadrant | BADHDUFLAG | Total packets | Discarded packets |
| A | 0 | 28 | 0 |
| B | 0 | 29 | 0 |
| C | 0 | 29 | 0 |
| D | 0 | 29 | 0 |
| Mode SS | |||
|---|---|---|---|
| Quadrant | BADHDUFLAG | Total packets | Discarded packets |
| A | 0 | 112 | 0 |
| B | 0 | 112 | 0 |
| C | 0 | 112 | 0 |
| D | 0 | 112 | 0 |
| Mode M0 | |||
|---|---|---|---|
| Quadrant | BADHDUFLAG | Total packets | Discarded packets |
| A | 0 | 13869 | 2 |
| B | 0 | 11926 | 2 |
| C | 0 | 14024 | 2 |
| D | 0 | 11786 | 2 |
| Quadrant | Total seconds | Saturated seconds | Saturation percentage |
|---|---|---|---|
| A | 5494 | 162 | 2.948671% |
| B | 5494 | 27 | 0.491445% |
| C | 5494 | 73 | 1.328722% |
| D | 5494 | 15 | 0.273025% |
Noise dominated data is calculated using 1-second bins in cleaned event files. If a bin has >2000 counts, and if more than 50% of those come from <1% of pixels, then it is considered to be noise-dominated and hence unusable.
| Quadrant | # 1 sec bins | Bins with >0 counts | Bins with >2000 counts | High rate bins dominated by noise | Noise dominated (total time) | Noise dominated (detector-on time) | Marked lightcurve |
|---|---|---|---|---|---|---|---|
| A | 7228 | 5495 | 123 | 123 | 1.70% | 2.24% | 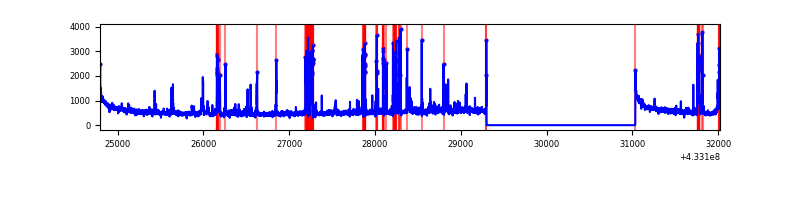 |
| B | 7228 | 5495 | 13 | 13 | 0.18% | 0.24% | 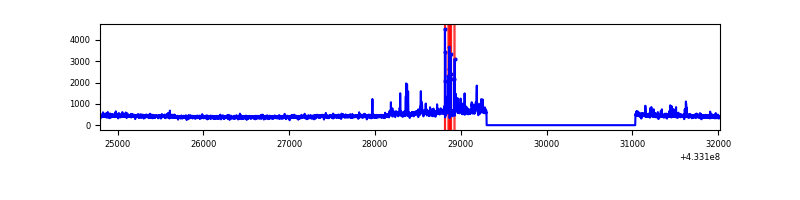 |
| C | 7228 | 5495 | 97 | 97 | 1.34% | 1.77% | 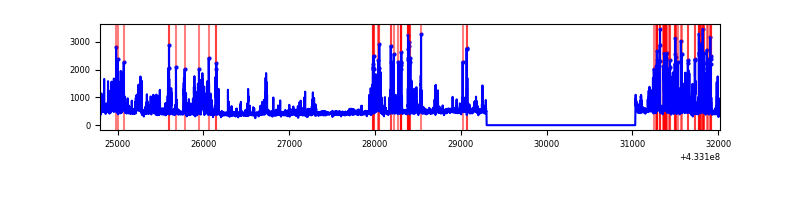 |
| D | 7228 | 5495 | 17 | 17 | 0.24% | 0.31% | 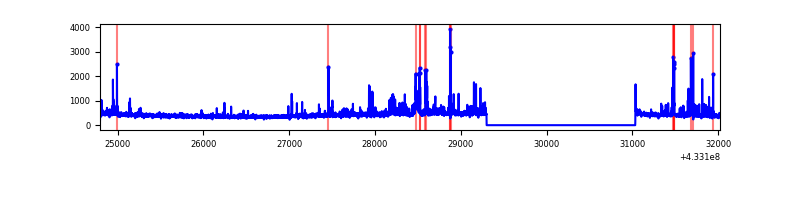 |
Top three noisy pixels from each quadrant. If the there are fewer than three noisy pixels in the level2.evt file, extra rows are filled as -1
| Pixel properties | Quadrant properties | ||||||
|---|---|---|---|---|---|---|---|
| Quadrant | DetID | PixID | Counts | Sigma | Mean | Median | Sigma |
| A | 10 | 83 | 578044 | 4865.0 | 577 | 564 | 118.7 |
| A | 15 | 237 | 520420 | 4379.55 | 577 | 564 | 118.7 |
| A | 12 | 189 | 69969 | 584.71 | 577 | 564 | 118.7 |
| B | 0 | 186 | 168587 | 1487.07 | 579 | 561 | 113.0 |
| B | 5 | 255 | 134862 | 1188.59 | 579 | 561 | 113.0 |
| B | 12 | 111 | 14510 | 123.45 | 579 | 561 | 113.0 |
| C | 0 | 239 | 998320 | 7572.79 | 562 | 566 | 131.8 |
| C | 15 | 214 | 230192 | 1742.82 | 562 | 566 | 131.8 |
| C | 14 | 254 | 20696 | 152.78 | 562 | 566 | 131.8 |
| D | 1 | 52 | 262198 | 1898.6 | 564 | 548 | 137.8 |
| D | 2 | 234 | 25592 | 181.73 | 564 | 548 | 137.8 |
| D | 12 | 6 | 19578 | 138.09 | 564 | 548 | 137.8 |
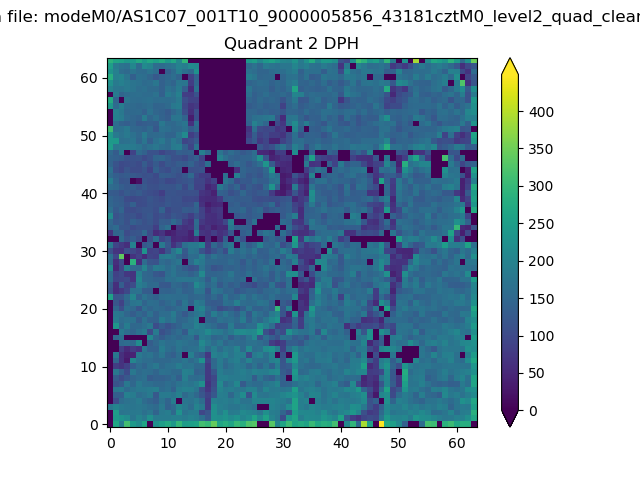
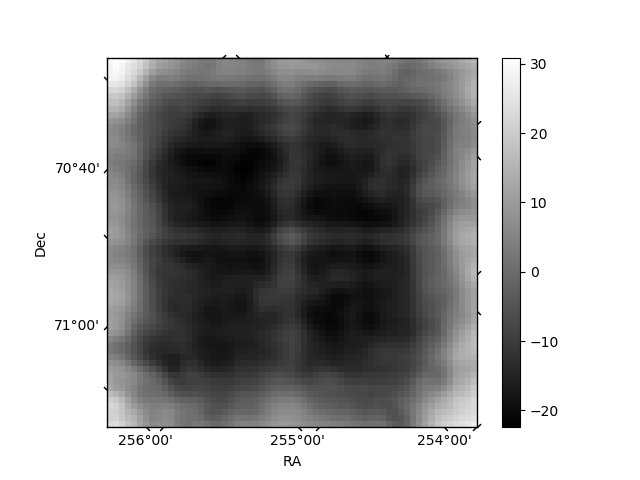
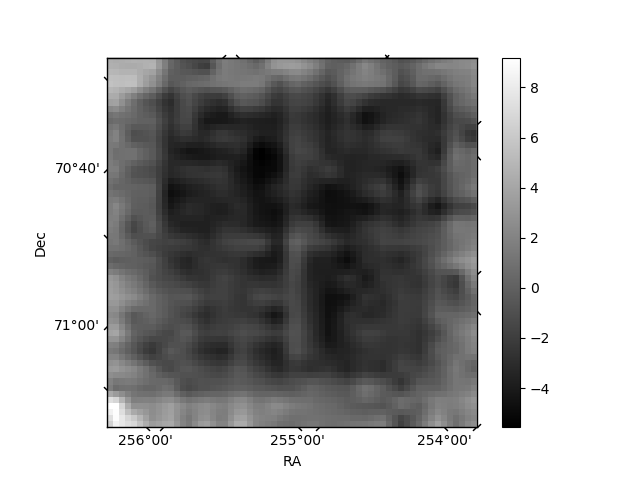
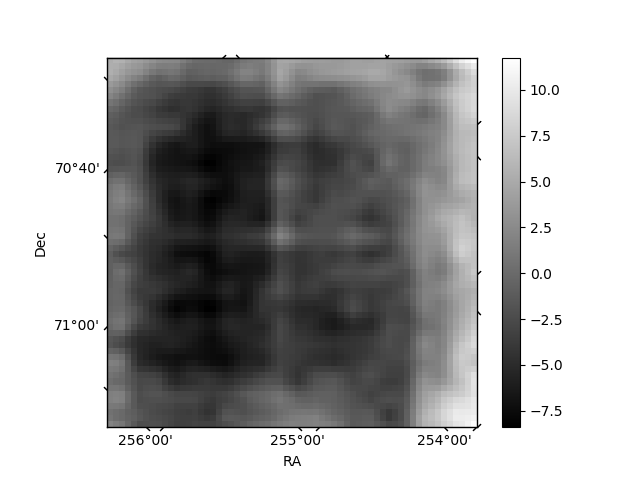
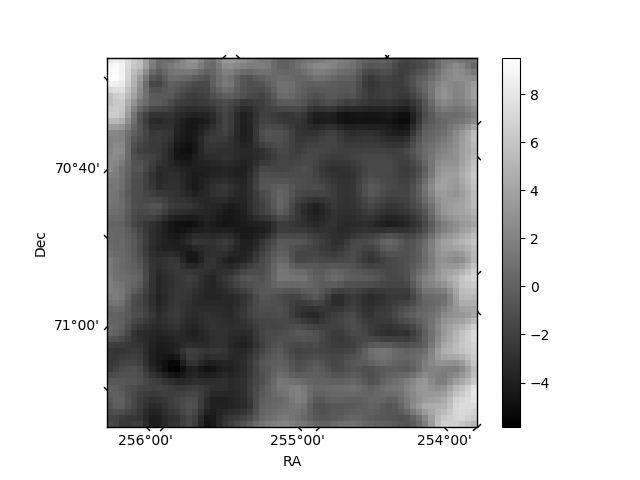
Histogram calculated using DETX and DETY for each event in the final _common_clean file
| Quadrant A | 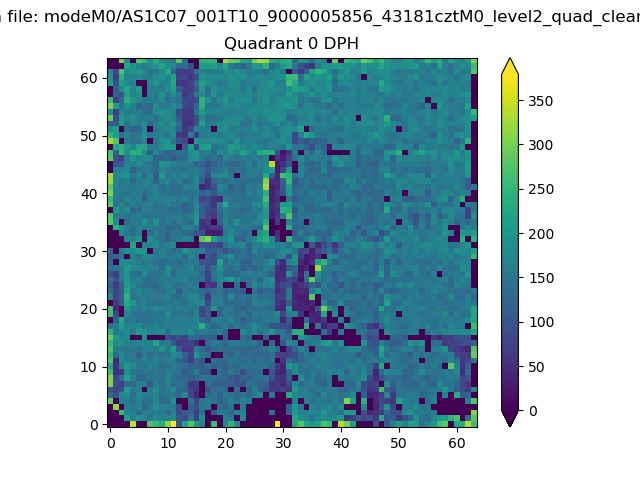 |
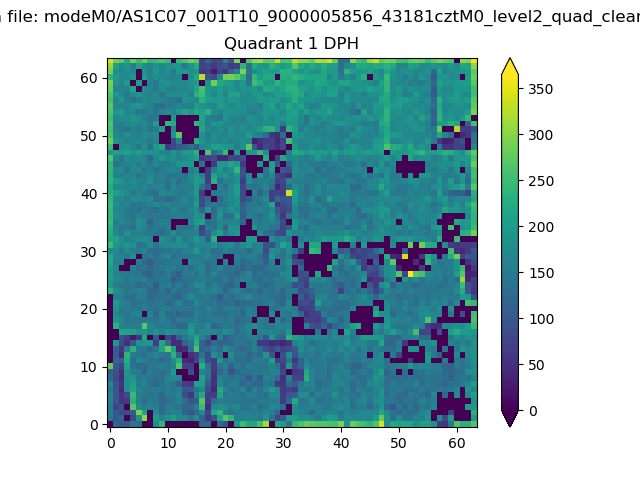 |
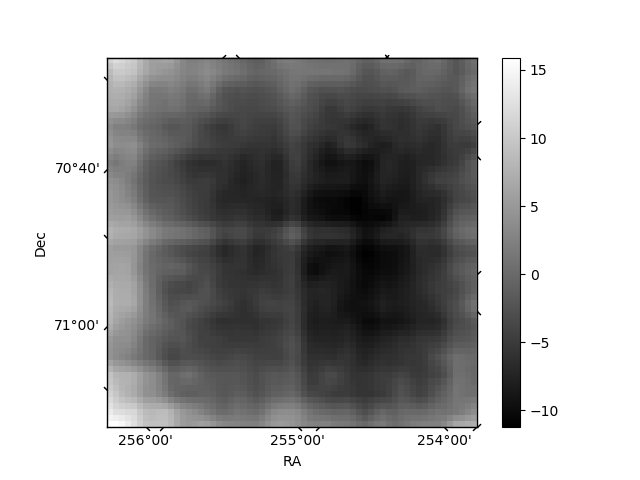
Quadrant B |
|---|---|---|---|
| Quadrant D | 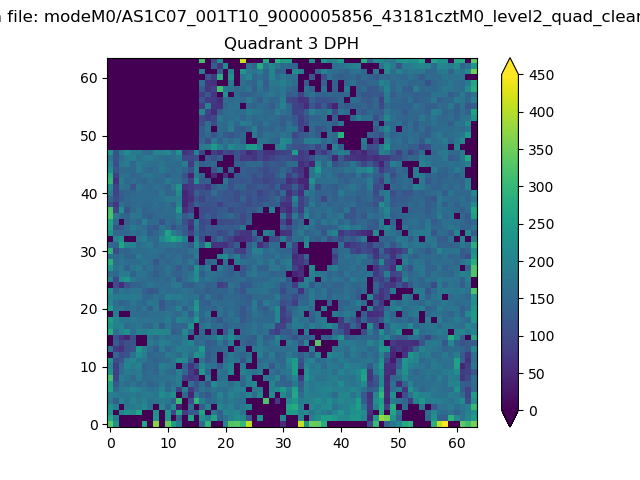 |
 |
Quadrant C |
| Plot type | Count rate plots | Images |
|---|---|---|
| Comparison with Poisson distribution Blue bars denote a histogram of data divided into 1 sec bins. Red curve is a Poisson curve with rate = median count rate of data. |
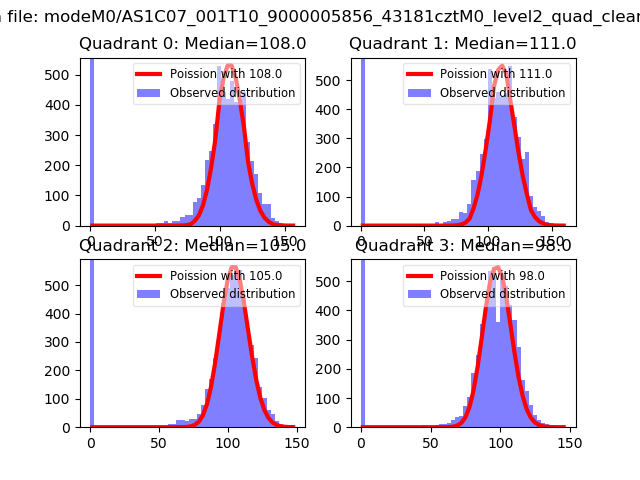 |
 |
| Quadrant-wise count rates Data is divided into 100 sec bins |
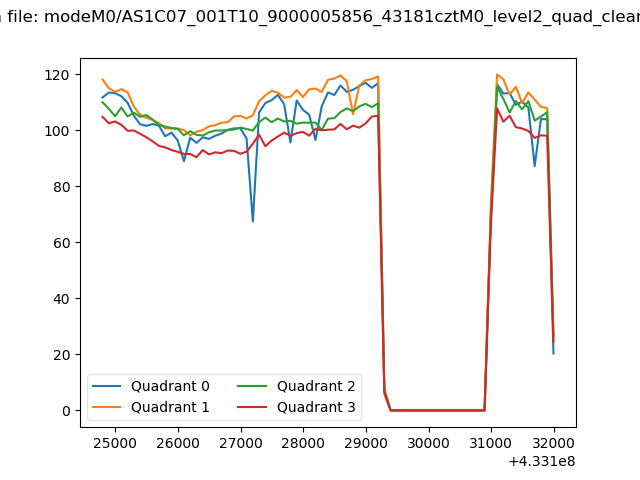 |
|
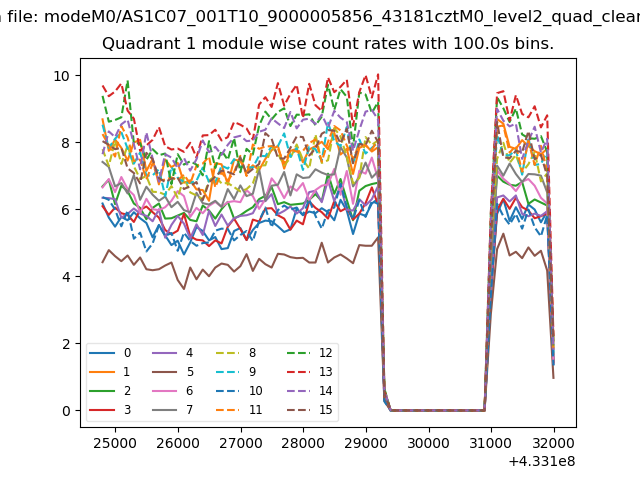
| Module-wise count rates for Quadrant A Data is divided into 100 sec bins |
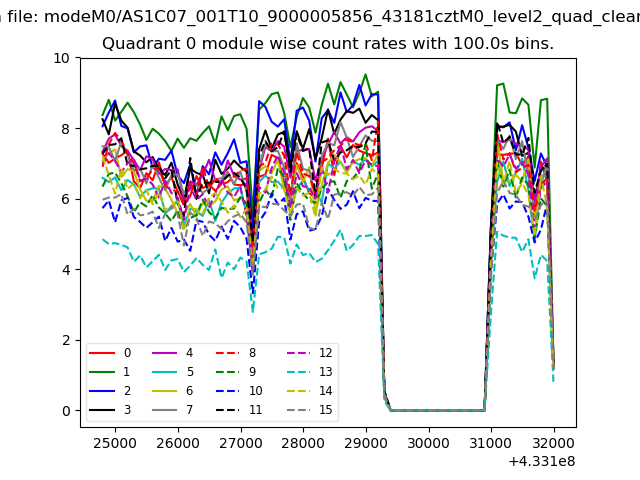 |
 |
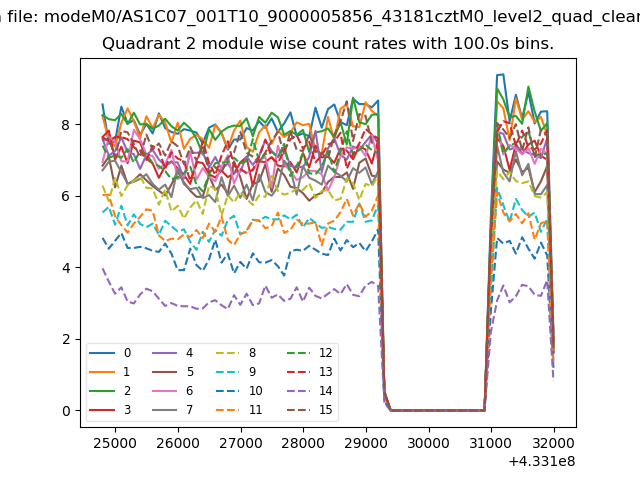
| Module-wise count rates for Quadrant B Data is divided into 100 sec bins |
 |
 |
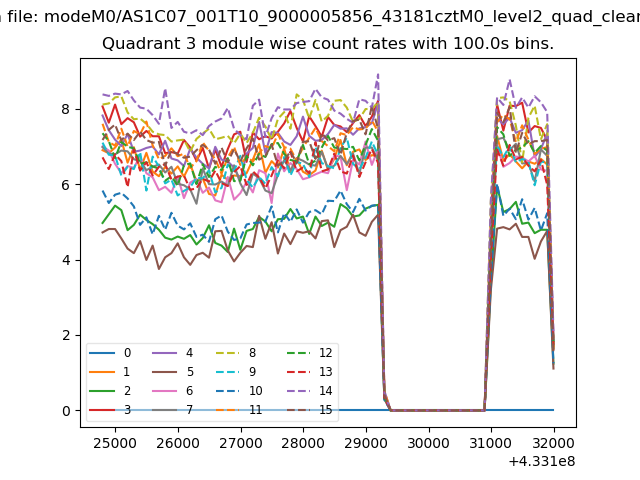
| Module-wise count rates for Quadrant C Data is divided into 100 sec bins |
 |
 |
| Module-wise count rates for Quadrant D Data is divided into 100 sec bins |
 |
 |
| Parameter | Plot |
|---|---|
| CZT HV Monitor | 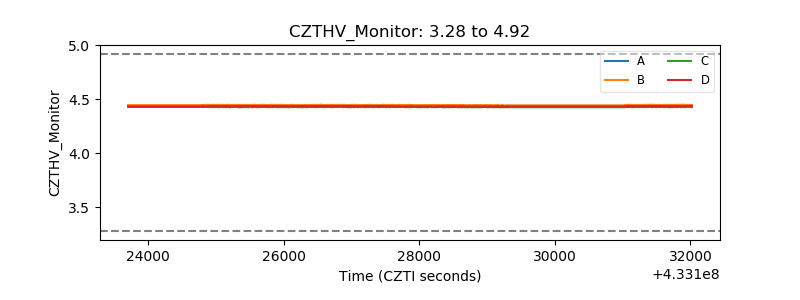 |
| D_VDD | 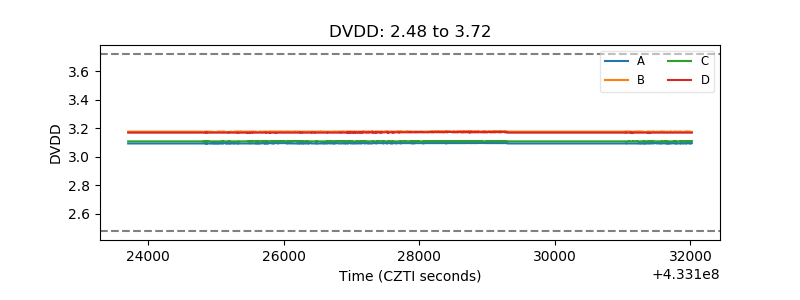 |
| Temperature 1 | 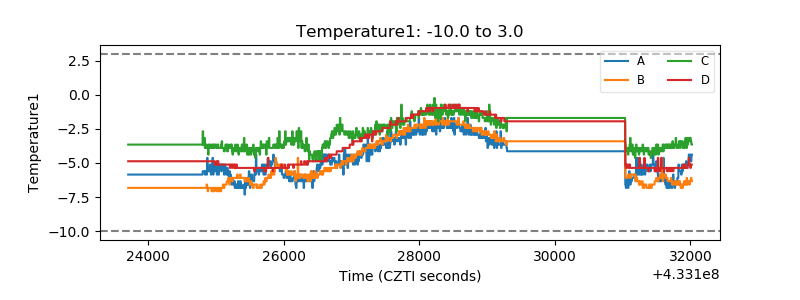 |
| Veto HV Monitor | 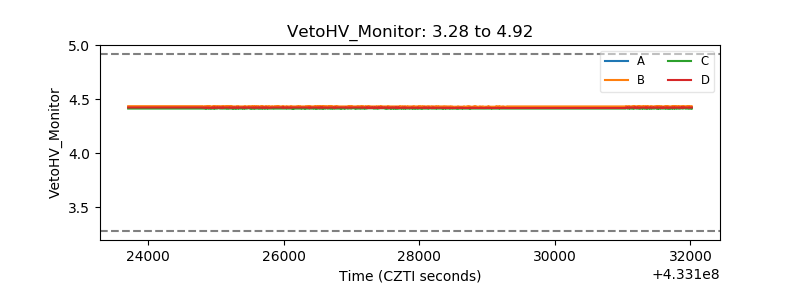 |
| Veto LLD | 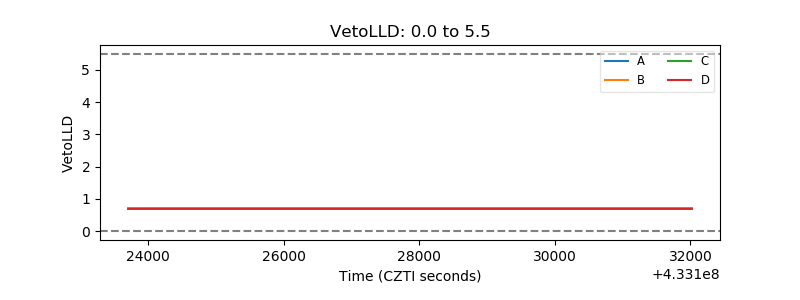 |
| Alpha Counter | 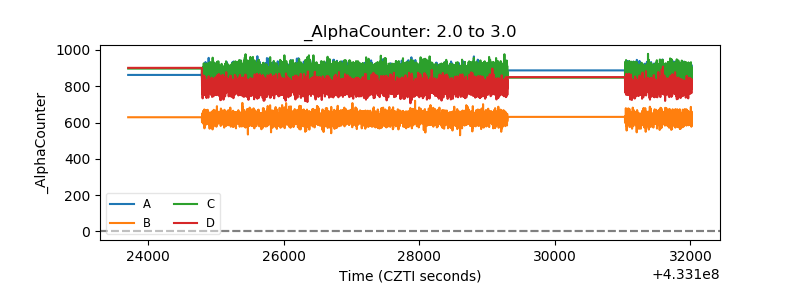 |
| _CPM_Rate | 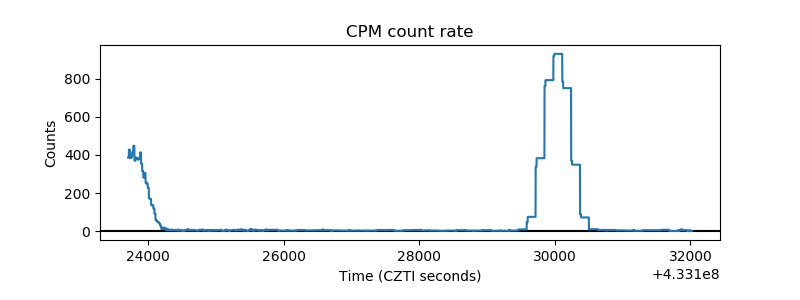 |
| CZT Counter |  |
| +2.5 Volts monitor |  |
| +5 Volts monitor | 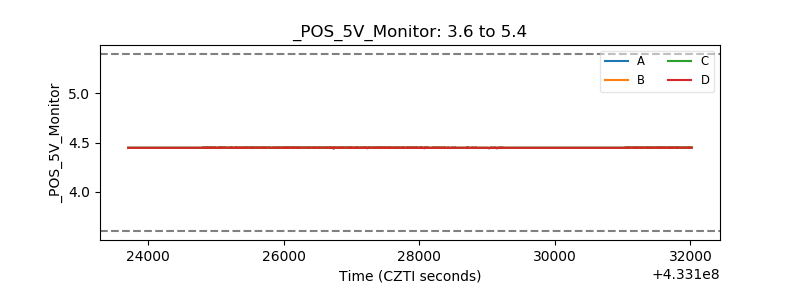 |
| _ROLL_ROT | 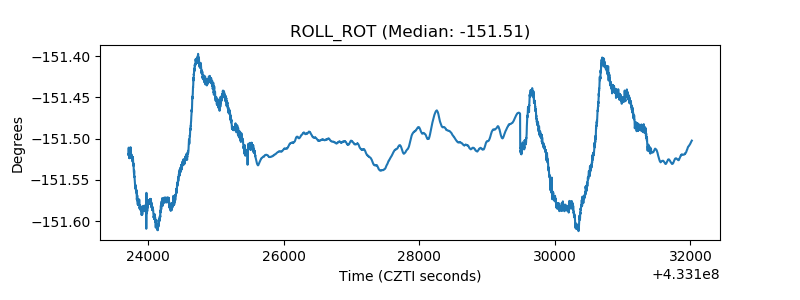 |
| _Roll_DEC | 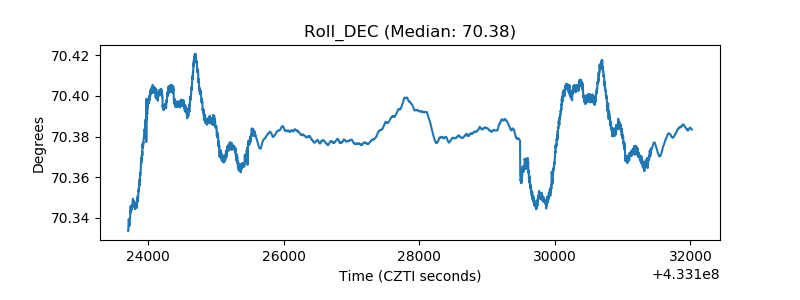 |
| _Roll_RA | 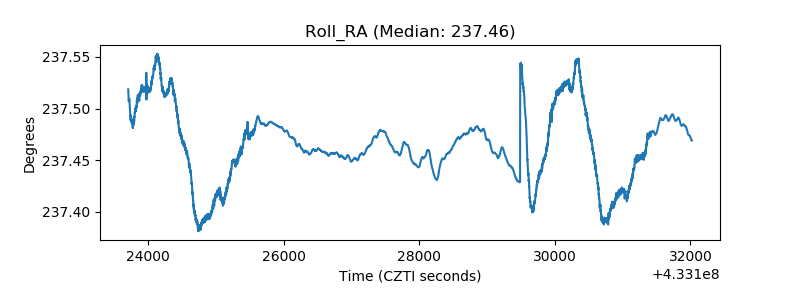 |
| Veto Counter | 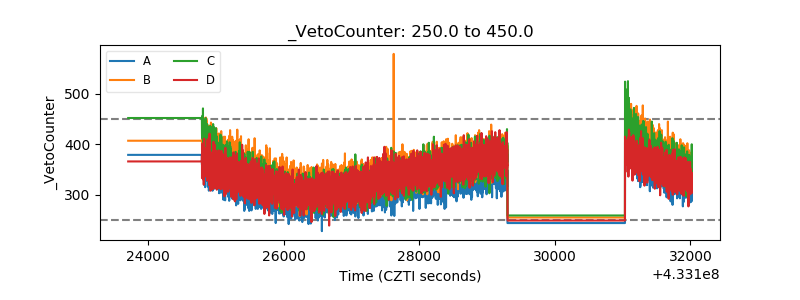 |