| Param | Original file | Final file |
|---|---|---|
| Filename | modeM0/AS1C07_001T10_9000005856_43182cztM0_level2.fits | modeM0/AS1C07_001T10_9000005856_43182cztM0_level2_quad_clean.evt |
| Size (bytes) | 446,330,880 | 80,075,520 |
| Size | 425.7 MB | 76.4 MB |
| Events in quadrant A | 7,686,786 | 353,538 |
| Events in quadrant B | 2,436,373 | 605,520 |
| Events in quadrant C | 3,540,969 | 566,780 |
| Events in quadrant D | 2,446,058 | 528,568 |
| Mode M9 | |||
|---|---|---|---|
| Quadrant | BADHDUFLAG | Total packets | Discarded packets |
| A | 0 | 31 | 0 |
| B | 0 | 32 | 0 |
| C | 0 | 32 | 0 |
| D | 0 | 32 | 0 |
| Mode SS | |||
|---|---|---|---|
| Quadrant | BADHDUFLAG | Total packets | Discarded packets |
| A | 0 | 108 | 0 |
| B | 0 | 108 | 0 |
| C | 0 | 108 | 0 |
| D | 0 | 108 | 0 |
| Mode M0 | |||
|---|---|---|---|
| Quadrant | BADHDUFLAG | Total packets | Discarded packets |
| A | 0 | 26358 | 2 |
| B | 0 | 11108 | 2 |
| C | 0 | 13996 | 2 |
| D | 0 | 11297 | 2 |
| Quadrant | Total seconds | Saturated seconds | Saturation percentage |
|---|---|---|---|
| A | 5286 | 2105 | 39.822172% |
| B | 5286 | 6 | 0.113507% |
| C | 5286 | 73 | 1.381006% |
| D | 5286 | 20 | 0.378358% |
Noise dominated data is calculated using 1-second bins in cleaned event files. If a bin has >2000 counts, and if more than 50% of those come from <1% of pixels, then it is considered to be noise-dominated and hence unusable.
| Quadrant | # 1 sec bins | Bins with >0 counts | Bins with >2000 counts | High rate bins dominated by noise | Noise dominated (total time) | Noise dominated (detector-on time) | Marked lightcurve |
|---|---|---|---|---|---|---|---|
| A | 7139 | 5287 | 2031 | 2031 | 28.45% | 38.41% | 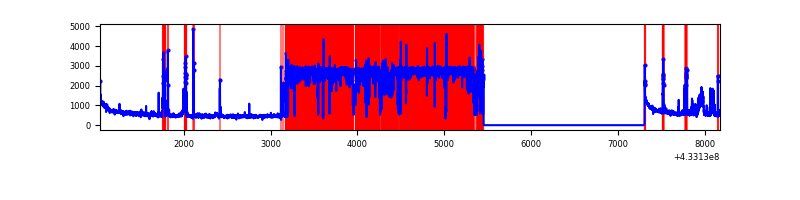 |
| B | 7139 | 5287 | 0 | 0 | 0.00% | 0.00% | 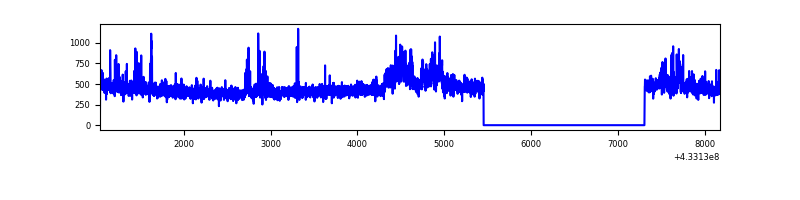 |
| C | 7139 | 5287 | 98 | 98 | 1.37% | 1.85% | 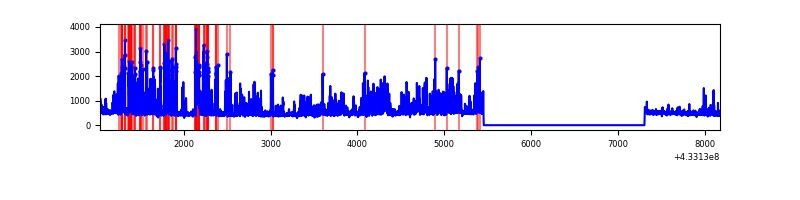 |
| D | 7139 | 5287 | 17 | 17 | 0.24% | 0.32% | 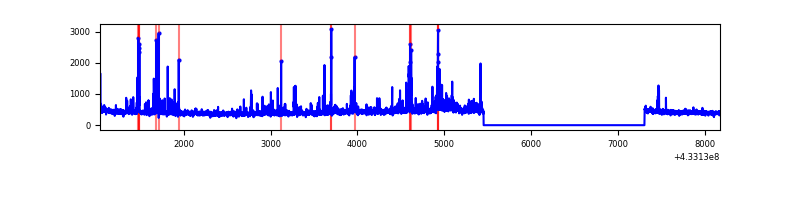 |
Top three noisy pixels from each quadrant. If the there are fewer than three noisy pixels in the level2.evt file, extra rows are filled as -1
| Pixel properties | Quadrant properties | ||||||
|---|---|---|---|---|---|---|---|
| Quadrant | DetID | PixID | Counts | Sigma | Mean | Median | Sigma |
| A | 15 | 222 | 5118907 | 58967.09 | 423 | 416 | 86.8 |
| A | 10 | 83 | 474054 | 5456.5 | 423 | 416 | 86.8 |
| A | 15 | 237 | 332917 | 3830.55 | 423 | 416 | 86.8 |
| B | 0 | 186 | 113356 | 1033.36 | 567 | 552 | 109.2 |
| B | 5 | 255 | 64672 | 587.38 | 567 | 552 | 109.2 |
| B | 0 | 189 | 29937 | 269.19 | 567 | 552 | 109.2 |
| C | 0 | 239 | 1111442 | 8668.55 | 548 | 551 | 128.2 |
| C | 15 | 214 | 220270 | 1714.52 | 548 | 551 | 128.2 |
| C | 8 | 79 | 28367 | 217.05 | 548 | 551 | 128.2 |
| D | 1 | 52 | 181869 | 1353.53 | 551 | 535 | 134.0 |
| D | 12 | 233 | 67418 | 499.24 | 551 | 535 | 134.0 |
| D | 13 | 249 | 28358 | 207.68 | 551 | 535 | 134.0 |
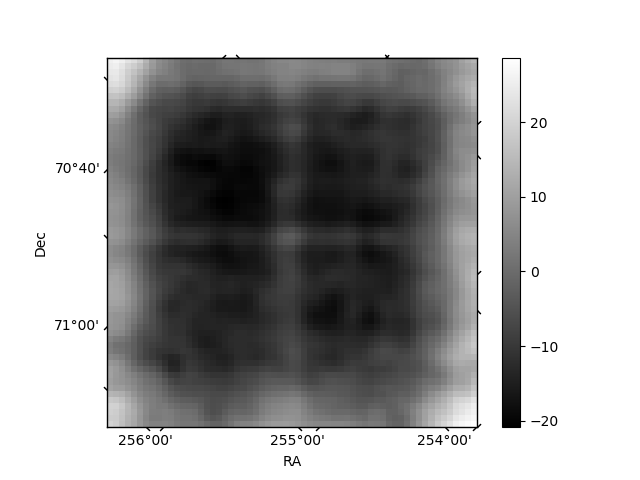
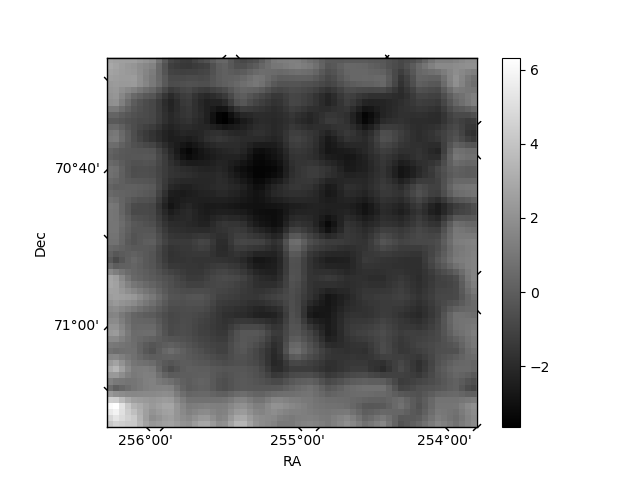
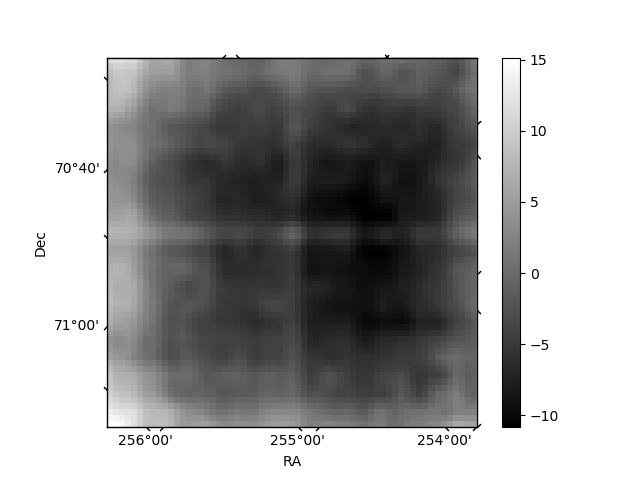
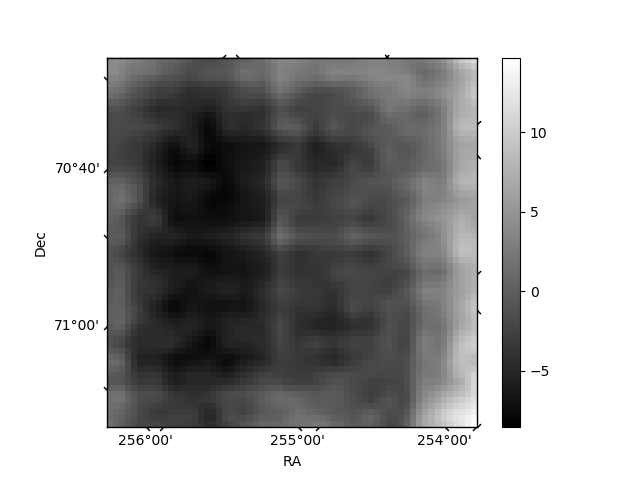
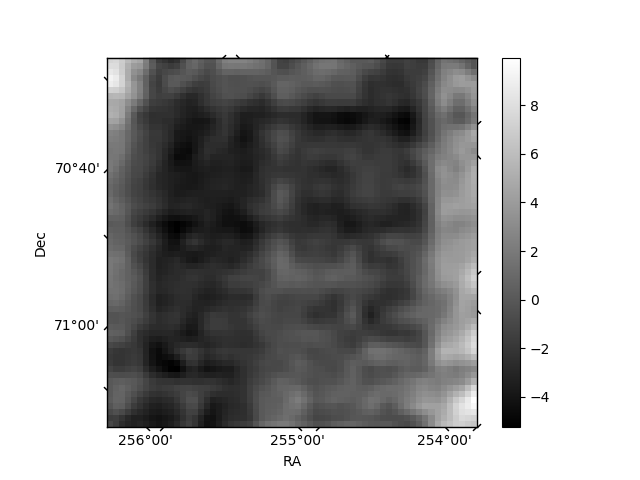
Histogram calculated using DETX and DETY for each event in the final _common_clean file
| Quadrant A | 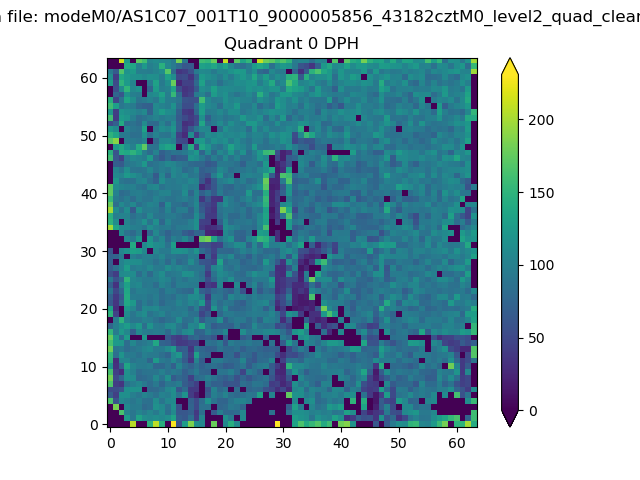 |
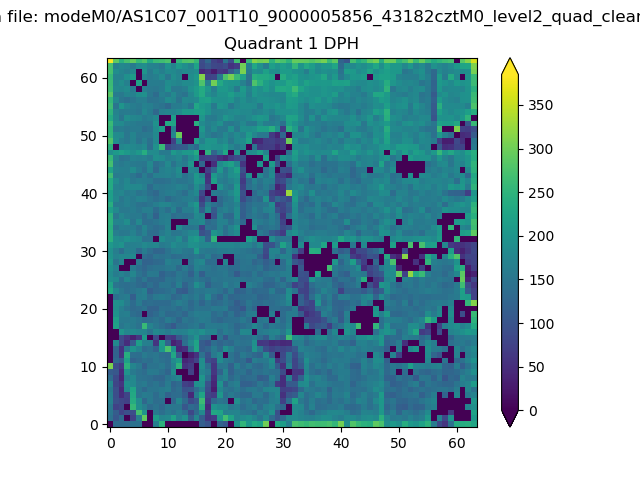 |
Quadrant B |
|---|---|---|---|
| Quadrant D | 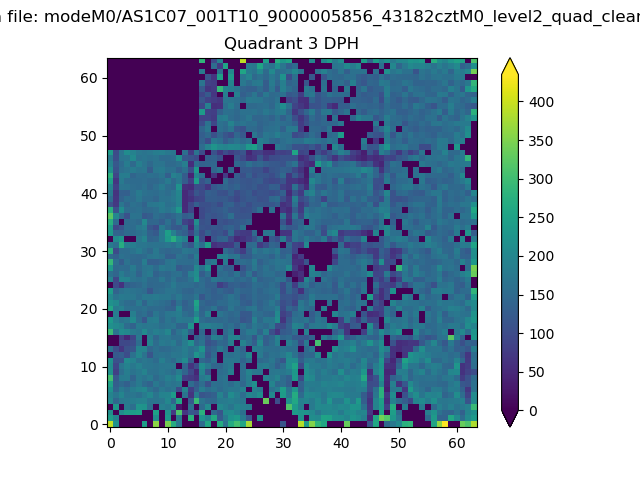 |
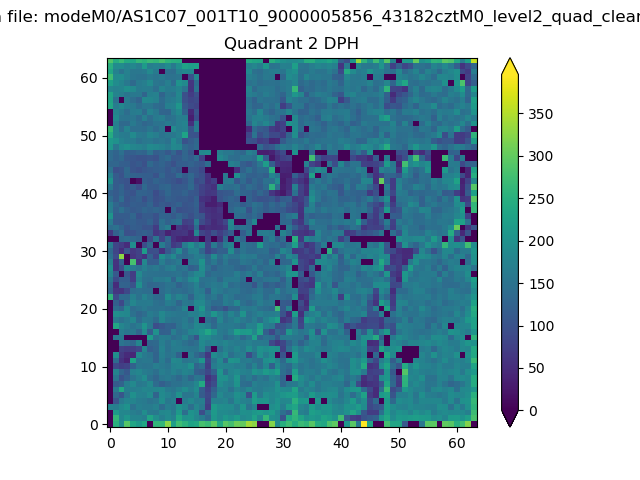 |
Quadrant C |
| Plot type | Count rate plots | Images |
|---|---|---|
| Comparison with Poisson distribution Blue bars denote a histogram of data divided into 1 sec bins. Red curve is a Poisson curve with rate = median count rate of data. |
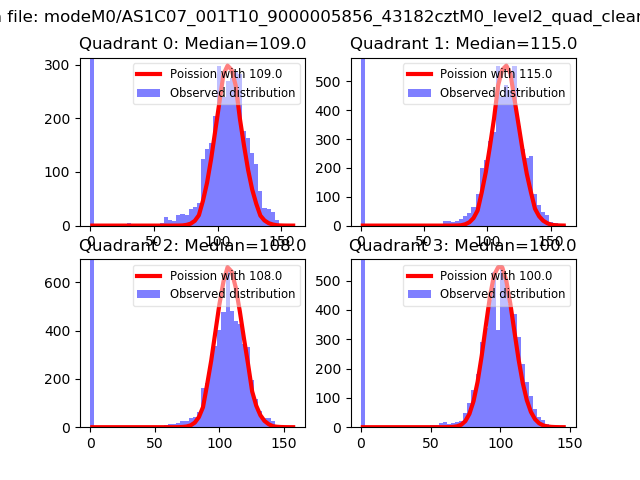 |
 |
| Quadrant-wise count rates Data is divided into 100 sec bins |
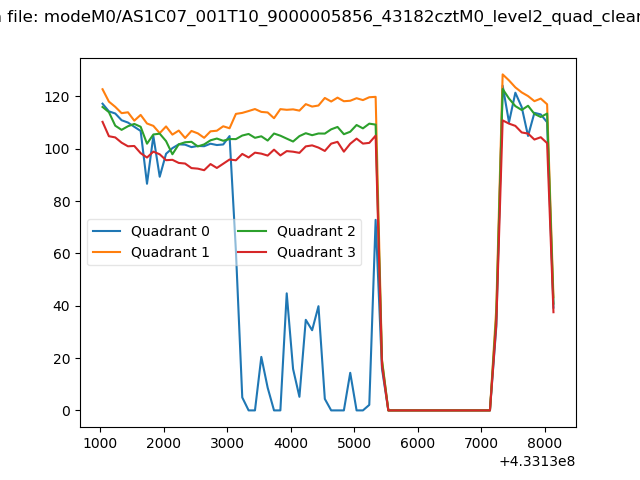 |
|
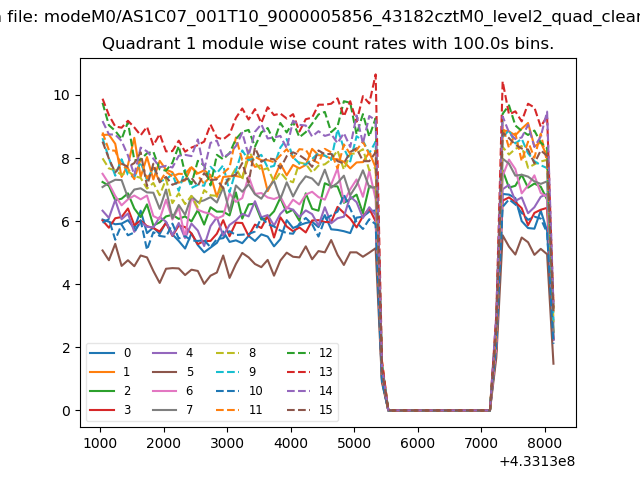
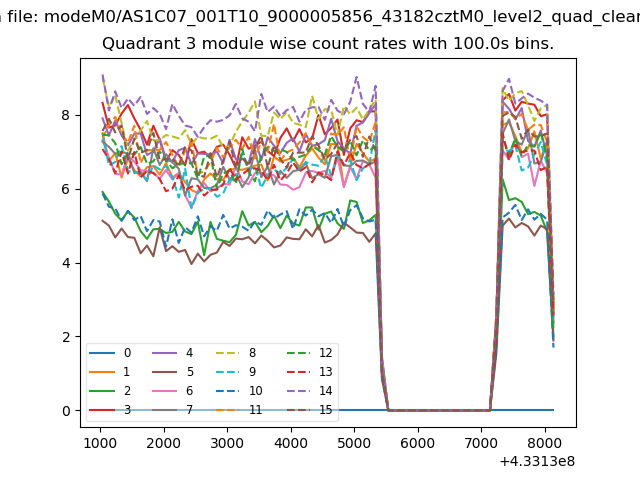
| Module-wise count rates for Quadrant A Data is divided into 100 sec bins |
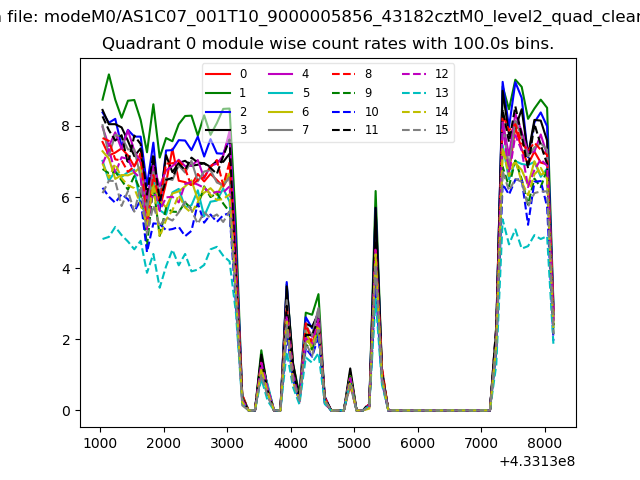 |
 |
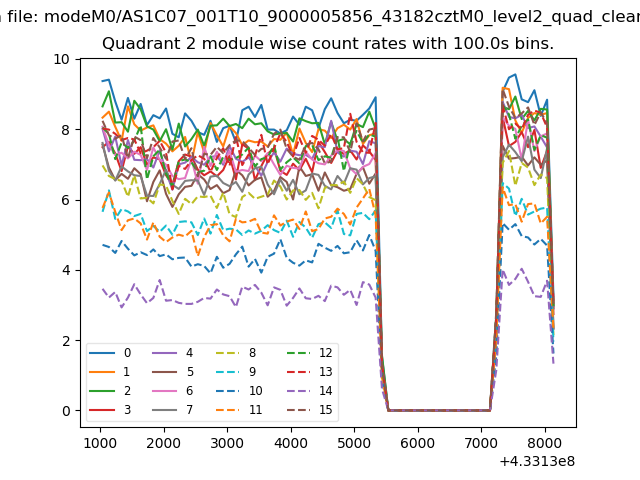
| Module-wise count rates for Quadrant B Data is divided into 100 sec bins |
 |
 |
| Module-wise count rates for Quadrant C Data is divided into 100 sec bins |
 |
 |
| Module-wise count rates for Quadrant D Data is divided into 100 sec bins |
 |
 |
| Parameter | Plot |
|---|---|
| CZT HV Monitor | 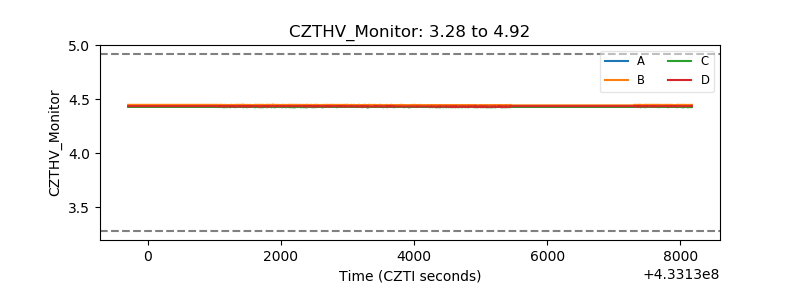 |
| D_VDD | 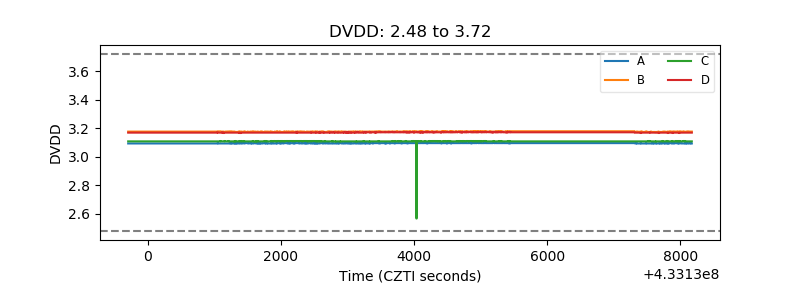 |
| Temperature 1 | 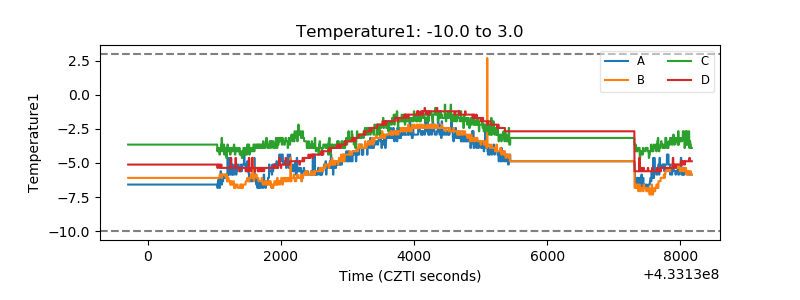 |
| Veto HV Monitor |  |
| Veto LLD | 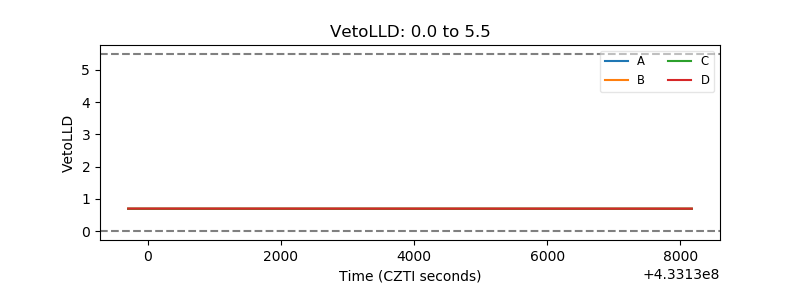 |
| Alpha Counter | 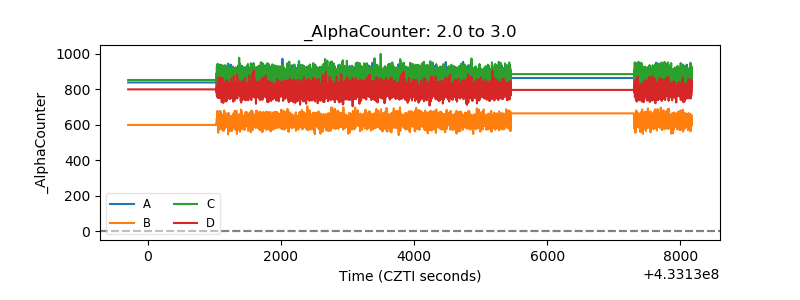 |
| _CPM_Rate | 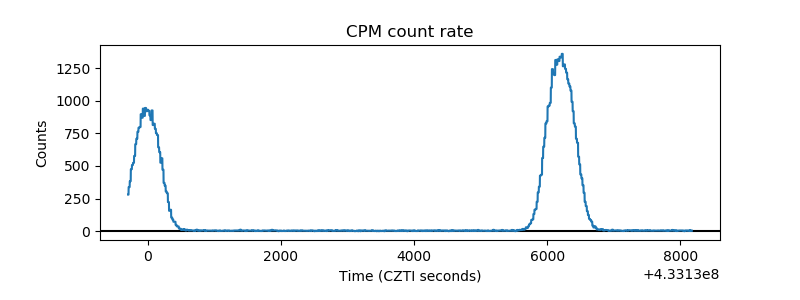 |
| CZT Counter | 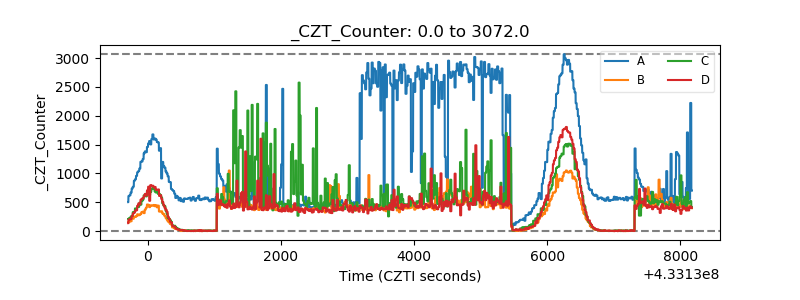 |
| +2.5 Volts monitor | 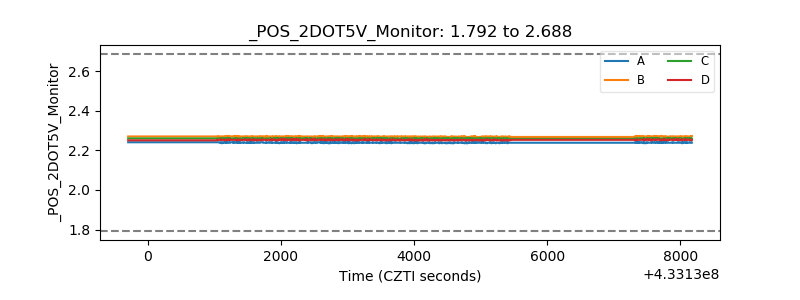 |
| +5 Volts monitor | 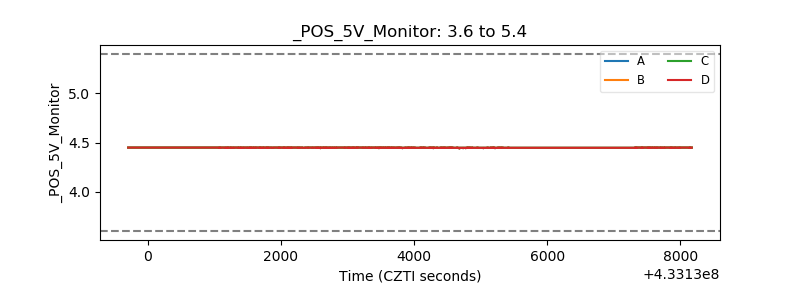 |
| _ROLL_ROT | 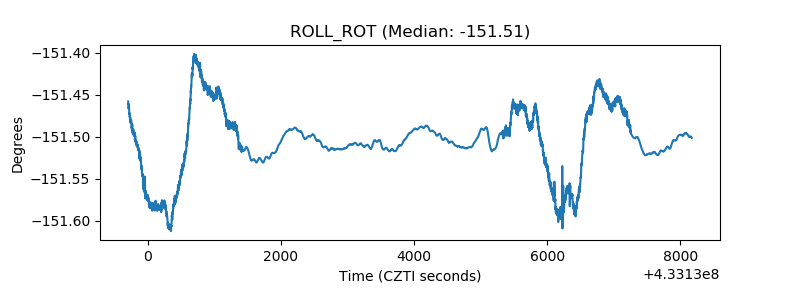 |
| _Roll_DEC | 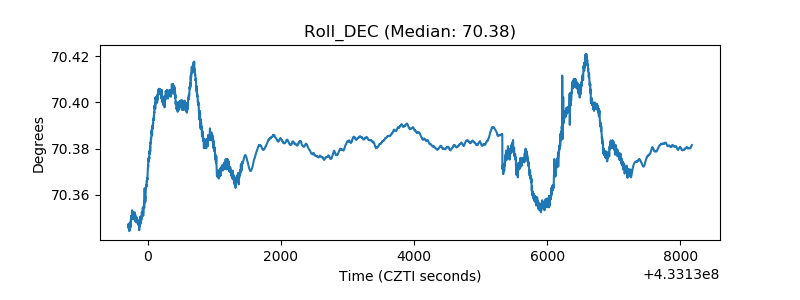 |
| _Roll_RA | 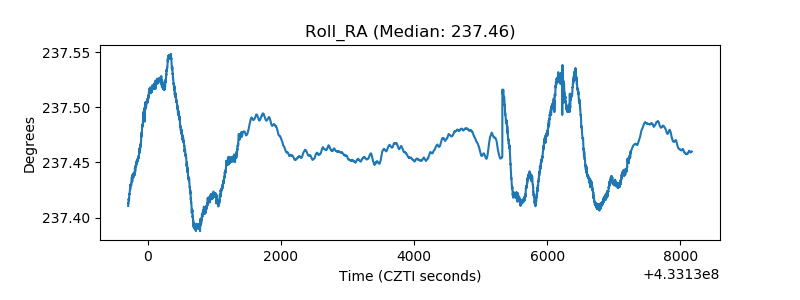 |
| Veto Counter | 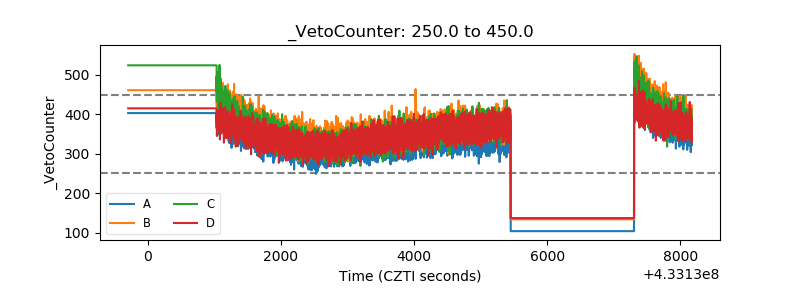 |