| Param | Original file | Final file |
|---|---|---|
| Filename | modeM0/AS1C07_001T10_9000005856_43183cztM0_level2.fits | modeM0/AS1C07_001T10_9000005856_43183cztM0_level2_quad_clean.evt |
| Size (bytes) | 244,022,400 | 67,492,800 |
| Size | 232.7 MB | 64.4 MB |
| Events in quadrant A | 2,853,654 | 447,998 |
| Events in quadrant B | 1,855,535 | 472,931 |
| Events in quadrant C | 2,074,890 | 437,440 |
| Events in quadrant D | 1,935,928 | 402,748 |
| Mode M9 | |||
|---|---|---|---|
| Quadrant | BADHDUFLAG | Total packets | Discarded packets |
| A | 0 | 8 | 0 |
| B | 0 | 9 | 0 |
| C | 0 | 9 | 0 |
| D | 0 | 9 | 0 |
| Mode SS | |||
|---|---|---|---|
| Quadrant | BADHDUFLAG | Total packets | Discarded packets |
| A | 0 | 82 | 0 |
| B | 0 | 82 | 0 |
| C | 0 | 82 | 0 |
| D | 0 | 82 | 0 |
| Mode M0 | |||
|---|---|---|---|
| Quadrant | BADHDUFLAG | Total packets | Discarded packets |
| A | 0 | 10960 | 1 |
| B | 0 | 8363 | 1 |
| C | 0 | 8723 | 1 |
| D | 0 | 8834 | 1 |
| Quadrant | Total seconds | Saturated seconds | Saturation percentage |
|---|---|---|---|
| A | 4001 | 162 | 4.048988% |
| B | 4001 | 5 | 0.124969% |
| C | 4001 | 7 | 0.174956% |
| D | 4001 | 69 | 1.724569% |
Noise dominated data is calculated using 1-second bins in cleaned event files. If a bin has >2000 counts, and if more than 50% of those come from <1% of pixels, then it is considered to be noise-dominated and hence unusable.
| Quadrant | # 1 sec bins | Bins with >0 counts | Bins with >2000 counts | High rate bins dominated by noise | Noise dominated (total time) | Noise dominated (detector-on time) | Marked lightcurve |
|---|---|---|---|---|---|---|---|
| A | 4001 | 4001 | 133 | 133 | 3.32% | 3.32% | 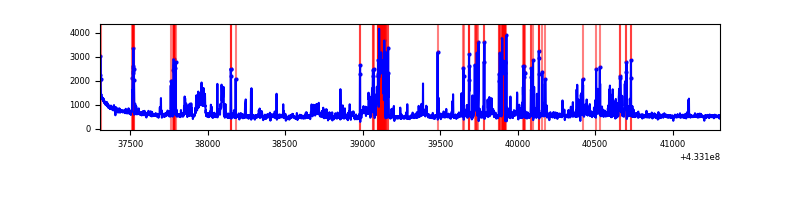 |
| B | 4001 | 4001 | 0 | 0 | 0.00% | 0.00% | 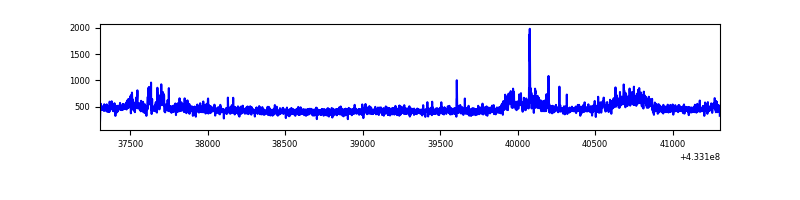 |
| C | 4001 | 4001 | 2 | 2 | 0.05% | 0.05% | 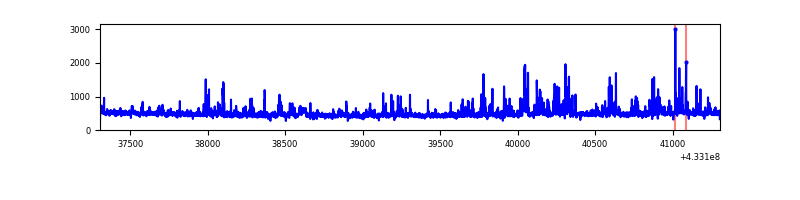 |
| D | 4001 | 4001 | 61 | 61 | 1.52% | 1.52% | 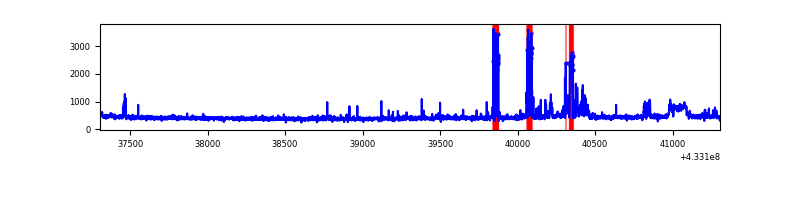 |
Top three noisy pixels from each quadrant. If the there are fewer than three noisy pixels in the level2.evt file, extra rows are filled as -1
| Pixel properties | Quadrant properties | ||||||
|---|---|---|---|---|---|---|---|
| Quadrant | DetID | PixID | Counts | Sigma | Mean | Median | Sigma |
| A | 15 | 237 | 464698 | 5226.78 | 430 | 422 | 88.8 |
| A | 10 | 83 | 377343 | 4243.34 | 430 | 422 | 88.8 |
| A | 15 | 222 | 215745 | 2424.09 | 430 | 422 | 88.8 |
| B | 0 | 186 | 78571 | 927.82 | 432 | 422 | 84.2 |
| B | 5 | 255 | 40063 | 470.64 | 432 | 422 | 84.2 |
| B | 0 | 189 | 29874 | 349.67 | 432 | 422 | 84.2 |
| C | 0 | 239 | 221179 | 2254.88 | 417 | 418 | 97.9 |
| C | 15 | 214 | 165791 | 1689.14 | 417 | 418 | 97.9 |
| C | 3 | 233 | 25261 | 253.75 | 417 | 418 | 97.9 |
| D | 12 | 233 | 146920 | 1444.47 | 418 | 406 | 101.4 |
| D | 13 | 84 | 110829 | 1088.65 | 418 | 406 | 101.4 |
| D | 1 | 216 | 32543 | 316.83 | 418 | 406 | 101.4 |
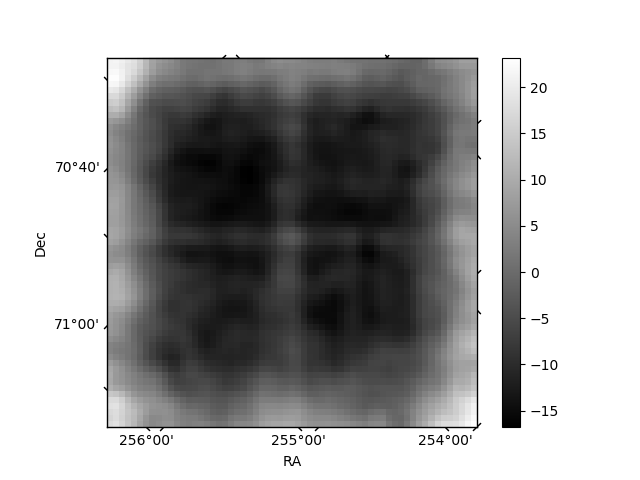
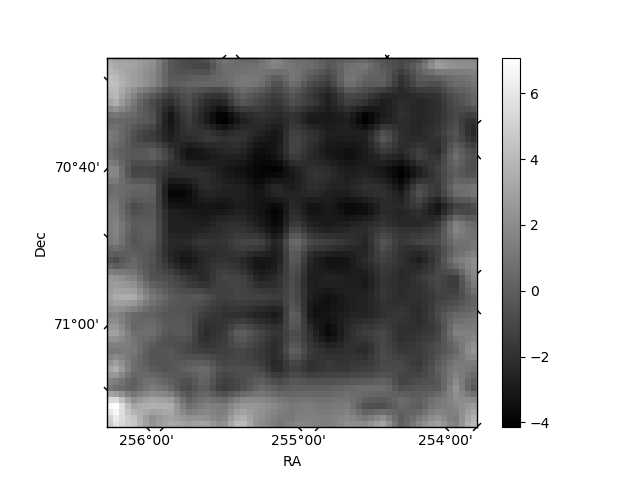
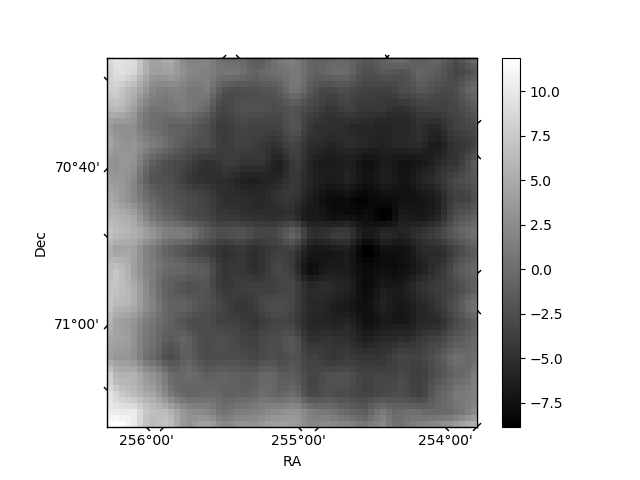
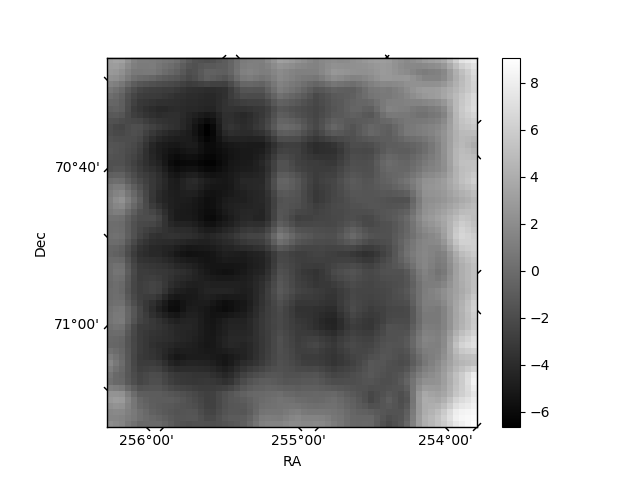
Histogram calculated using DETX and DETY for each event in the final _common_clean file
| Quadrant A | 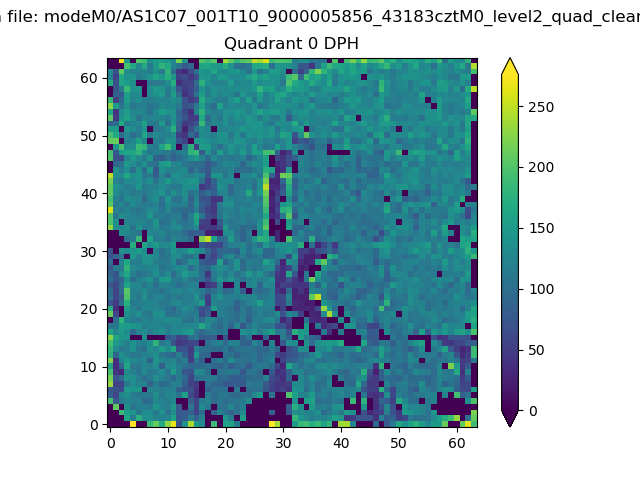 |
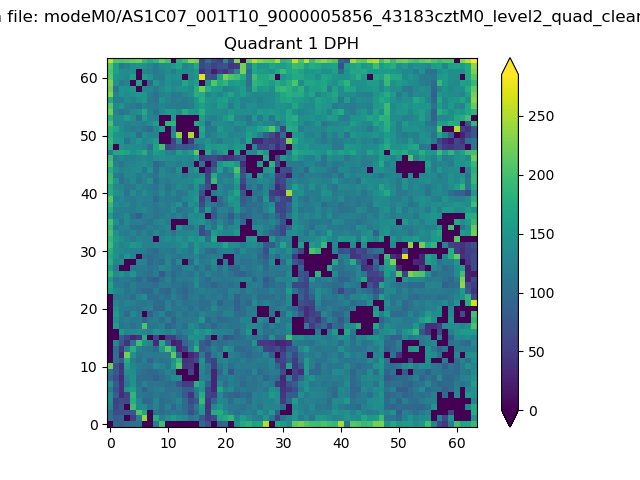 |
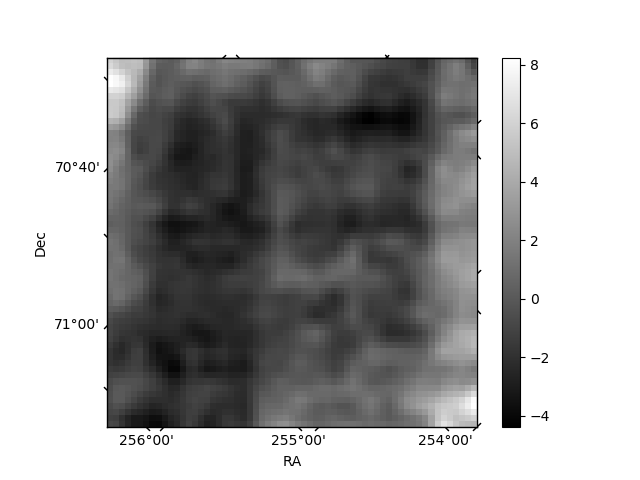
Quadrant B |
|---|---|---|---|
| Quadrant D | 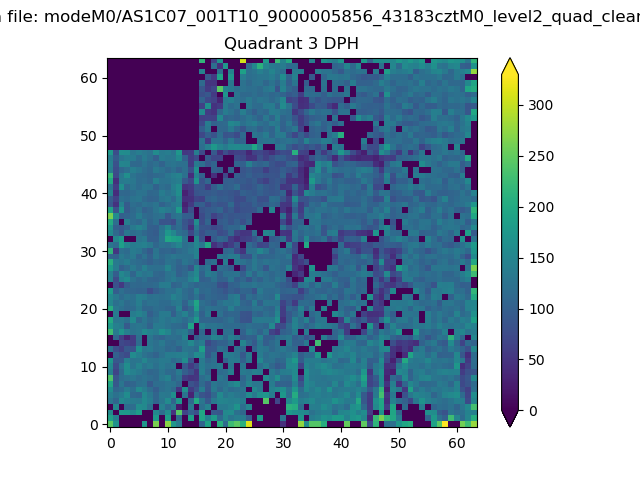 |
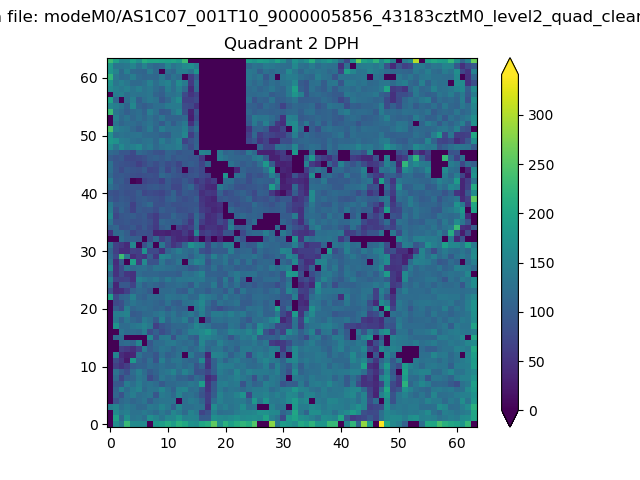 |
Quadrant C |
| Plot type | Count rate plots | Images |
|---|---|---|
| Comparison with Poisson distribution Blue bars denote a histogram of data divided into 1 sec bins. Red curve is a Poisson curve with rate = median count rate of data. |
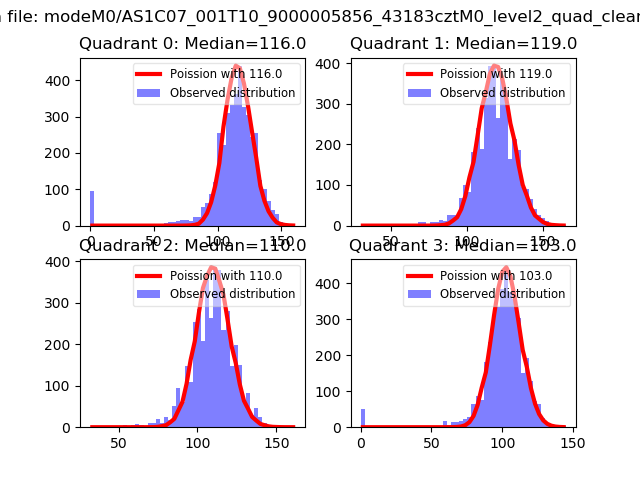 |
 |
| Quadrant-wise count rates Data is divided into 100 sec bins |
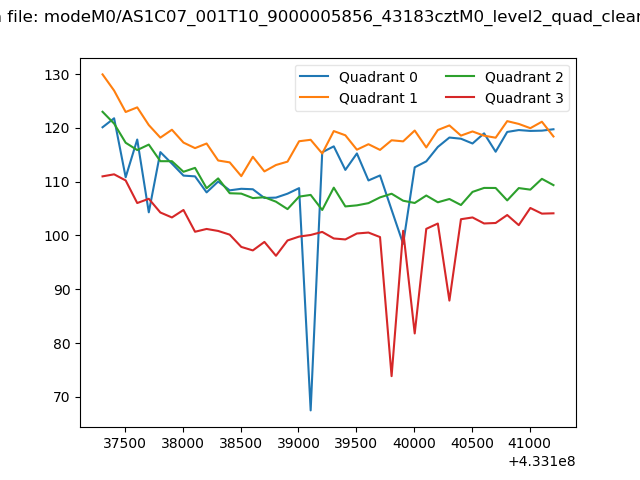 |
|
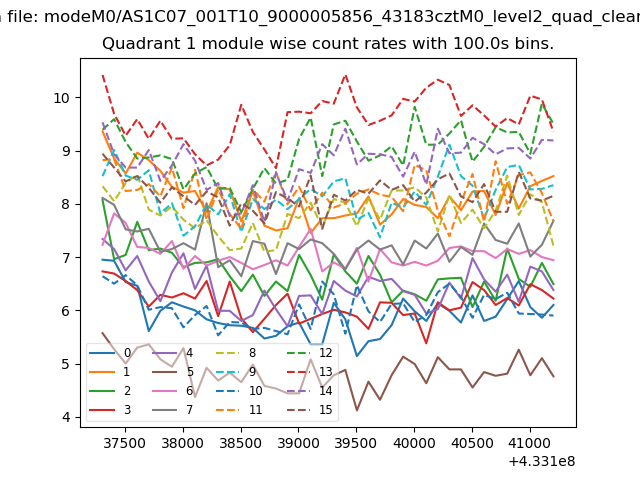
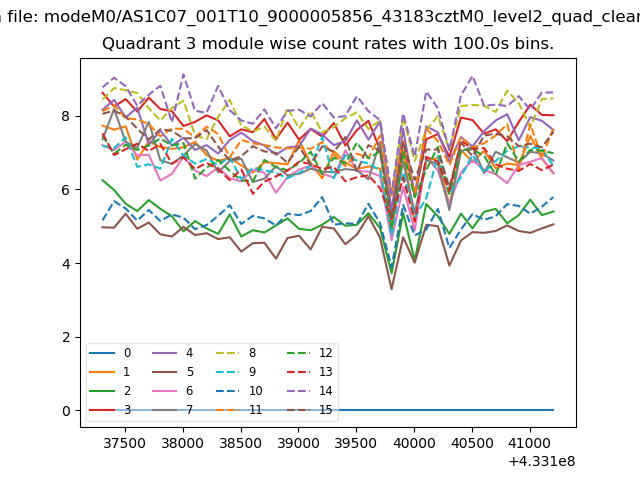
| Module-wise count rates for Quadrant A Data is divided into 100 sec bins |
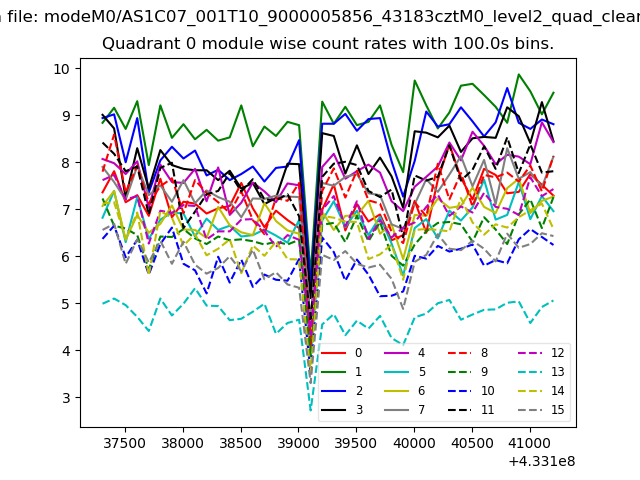 |
 |
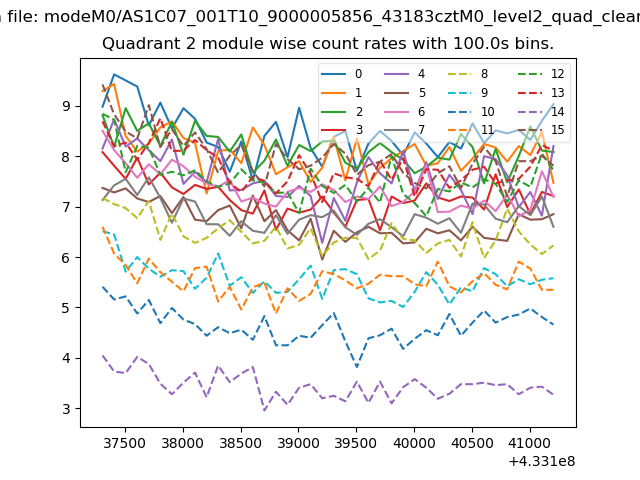
| Module-wise count rates for Quadrant B Data is divided into 100 sec bins |
 |
 |
| Module-wise count rates for Quadrant C Data is divided into 100 sec bins |
 |
 |
| Module-wise count rates for Quadrant D Data is divided into 100 sec bins |
 |
 |
| Parameter | Plot |
|---|---|
| CZT HV Monitor | 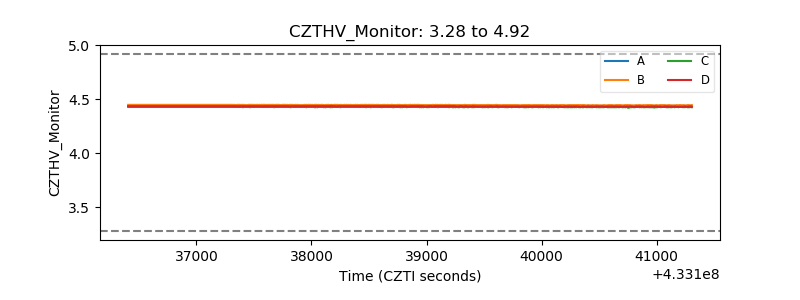 |
| D_VDD | 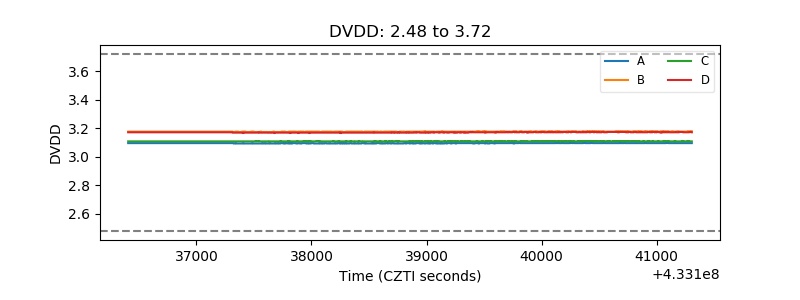 |
| Temperature 1 | 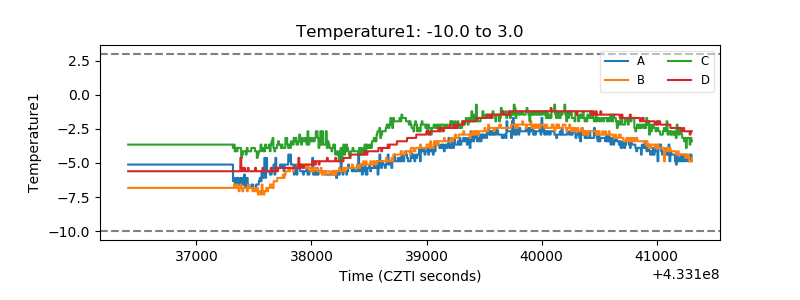 |
| Veto HV Monitor | 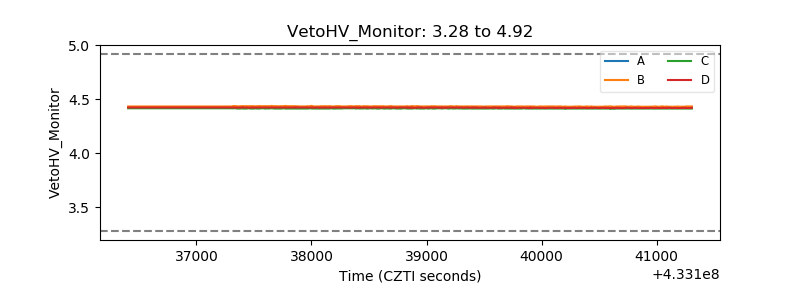 |
| Veto LLD |  |
| Alpha Counter | 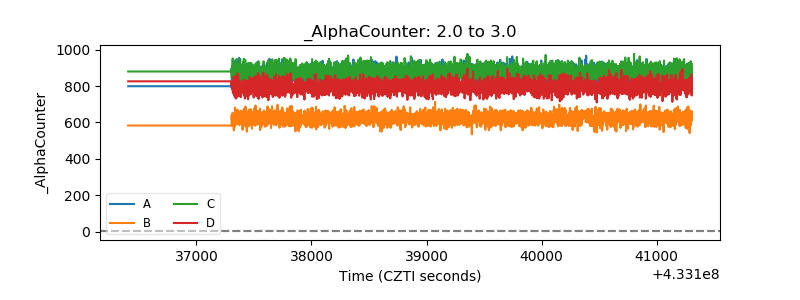 |
| _CPM_Rate | 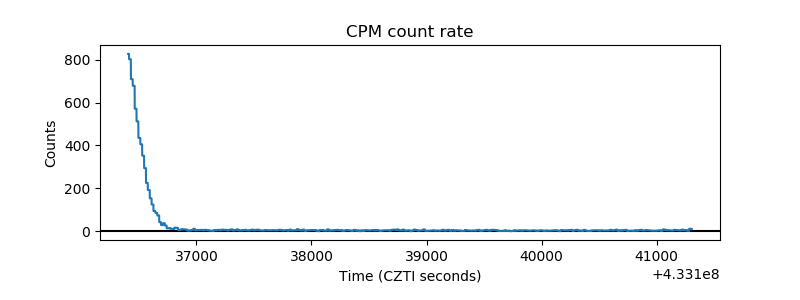 |
| CZT Counter |  |
| +2.5 Volts monitor | 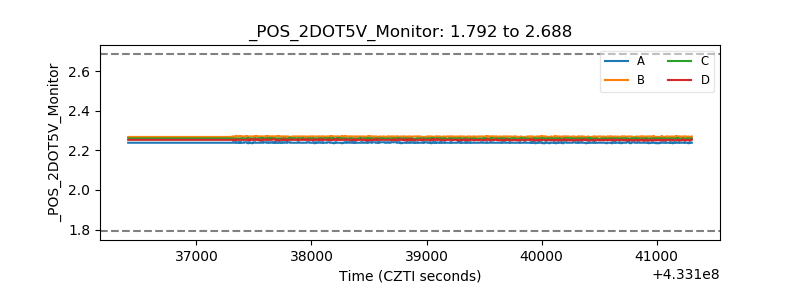 |
| +5 Volts monitor | 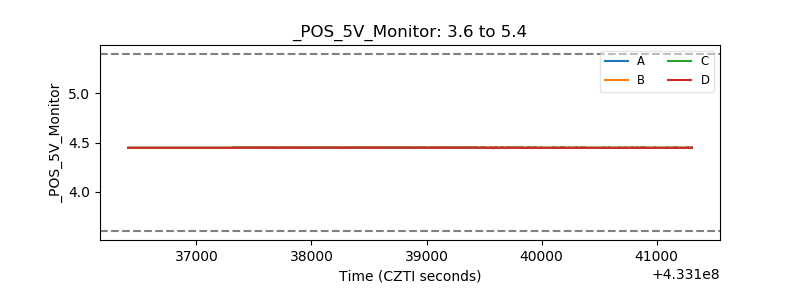 |
| _ROLL_ROT | 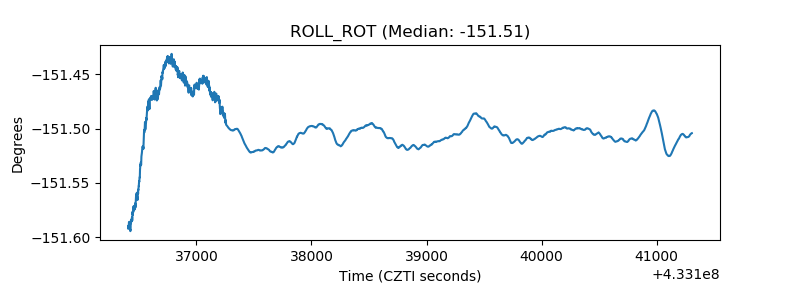 |
| _Roll_DEC | 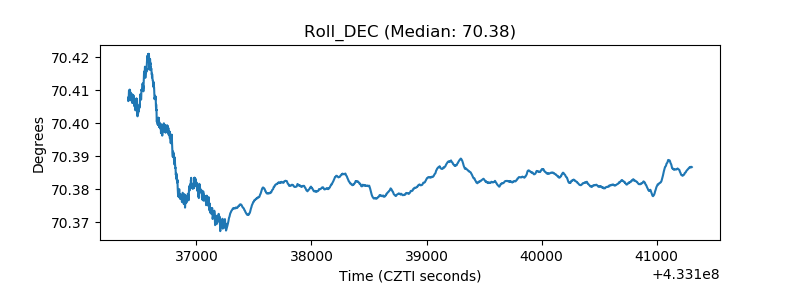 |
| _Roll_RA |  |
| Veto Counter | 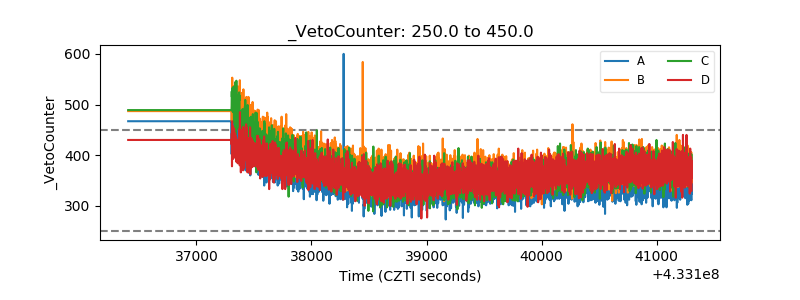 |