| Param | Original file | Final file |
|---|---|---|
| Filename | modeM0/AS1A09_036T17_9000005858_43183cztM0_level2.fits | modeM0/AS1A09_036T17_9000005858_43183cztM0_level2_quad_clean.evt |
| Size (bytes) | 72,316,800 | 21,844,800 |
| Size | 69.0 MB | 20.8 MB |
| Events in quadrant A | 799,731 | 146,077 |
| Events in quadrant B | 578,037 | 153,372 |
| Events in quadrant C | 660,292 | 141,316 |
| Events in quadrant D | 543,830 | 131,768 |
| Mode M0 | |||
|---|---|---|---|
| Quadrant | BADHDUFLAG | Total packets | Discarded packets |
| A | 0 | 3149 | 1 |
| B | 0 | 2500 | 1 |
| C | 0 | 2684 | 1 |
| D | 0 | 2455 | 1 |
| Mode SS | |||
|---|---|---|---|
| Quadrant | BADHDUFLAG | Total packets | Discarded packets |
| A | 0 | 24 | 0 |
| B | 0 | 24 | 0 |
| C | 0 | 24 | 0 |
| D | 0 | 24 | 0 |
| Mode M9 | |||
|---|---|---|---|
| Quadrant | BADHDUFLAG | Total packets | Discarded packets |
| A | 0 | 10 | 0 |
| B | 0 | 10 | 0 |
| C | 0 | 10 | 0 |
| D | 0 | 10 | 0 |
| Quadrant | Total seconds | Saturated seconds | Saturation percentage |
|---|---|---|---|
| A | 1179 | 32 | 2.714165% |
| B | 1179 | 6 | 0.508906% |
| C | 1179 | 7 | 0.593723% |
| D | 1179 | 3 | 0.254453% |
Noise dominated data is calculated using 1-second bins in cleaned event files. If a bin has >2000 counts, and if more than 50% of those come from <1% of pixels, then it is considered to be noise-dominated and hence unusable.
| Quadrant | # 1 sec bins | Bins with >0 counts | Bins with >2000 counts | High rate bins dominated by noise | Noise dominated (total time) | Noise dominated (detector-on time) | Marked lightcurve |
|---|---|---|---|---|---|---|---|
| A | 1179 | 1179 | 27 | 27 | 2.29% | 2.29% | 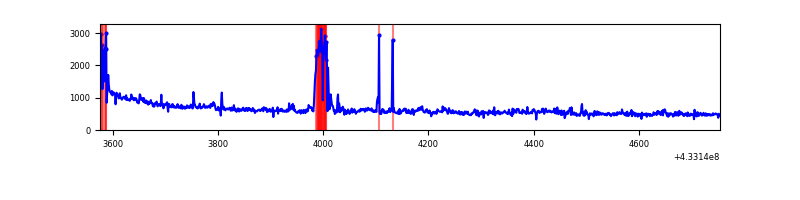 |
| B | 1179 | 1179 | 4 | 4 | 0.34% | 0.34% | 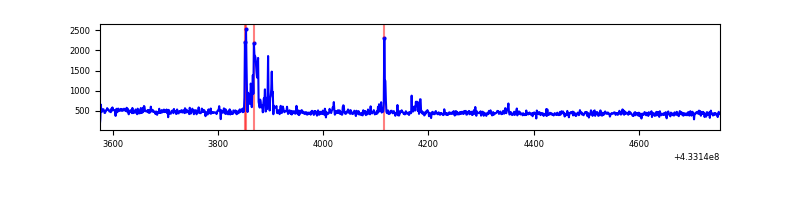 |
| C | 1179 | 1179 | 6 | 6 | 0.51% | 0.51% | 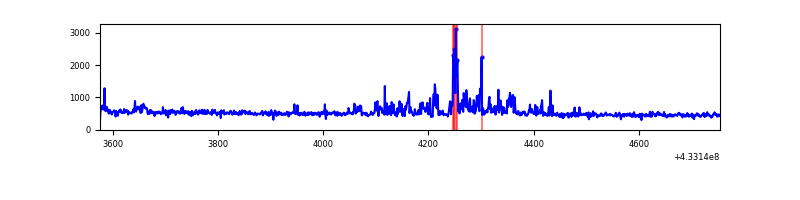 |
| D | 1179 | 1179 | 4 | 4 | 0.34% | 0.34% | 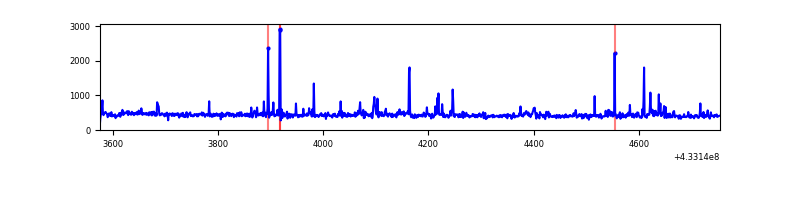 |
Top three noisy pixels from each quadrant. If the there are fewer than three noisy pixels in the level2.evt file, extra rows are filled as -1
| Pixel properties | Quadrant properties | ||||||
|---|---|---|---|---|---|---|---|
| Quadrant | DetID | PixID | Counts | Sigma | Mean | Median | Sigma |
| A | 10 | 83 | 179109 | 6150.42 | 132 | 129 | 29.1 |
| A | 15 | 237 | 71241 | 2443.67 | 132 | 129 | 29.1 |
| A | 15 | 222 | 21874 | 747.24 | 132 | 129 | 29.1 |
| B | 5 | 255 | 48038 | 1740.07 | 133 | 130 | 27.5 |
| B | 0 | 230 | 3743 | 131.23 | 133 | 130 | 27.5 |
| B | 0 | 229 | 3473 | 121.42 | 133 | 130 | 27.5 |
| C | 0 | 239 | 70450 | 2156.83 | 131 | 132 | 32.6 |
| C | 15 | 214 | 53436 | 1634.97 | 131 | 132 | 32.6 |
| C | 14 | 254 | 12289 | 372.89 | 131 | 132 | 32.6 |
| D | 2 | 249 | 31820 | 946.26 | 130 | 126 | 33.5 |
| D | 12 | 6 | 10106 | 297.96 | 130 | 126 | 33.5 |
| D | 2 | 234 | 3736 | 107.78 | 130 | 126 | 33.5 |
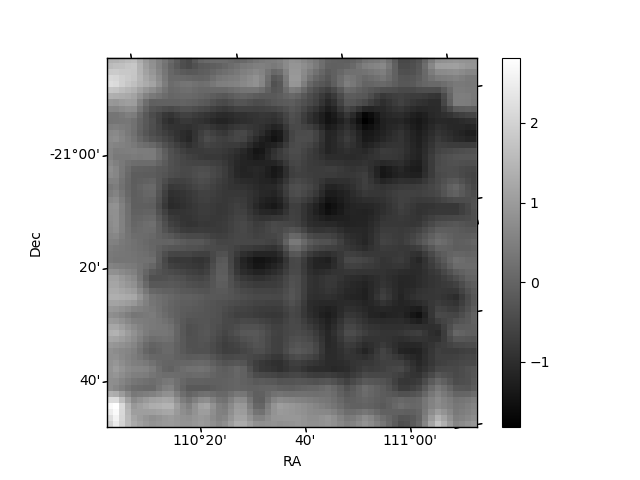
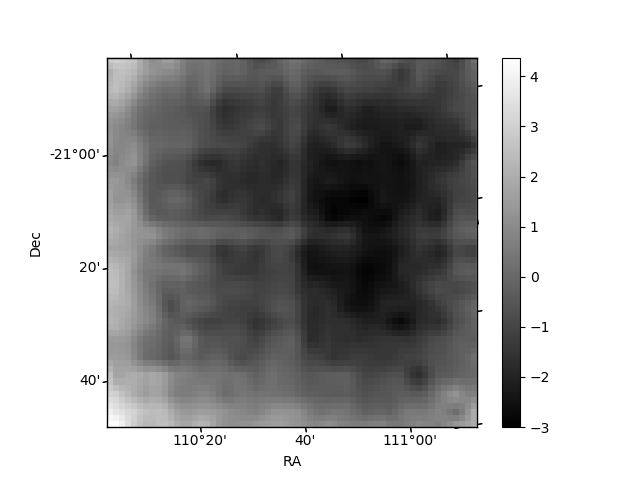
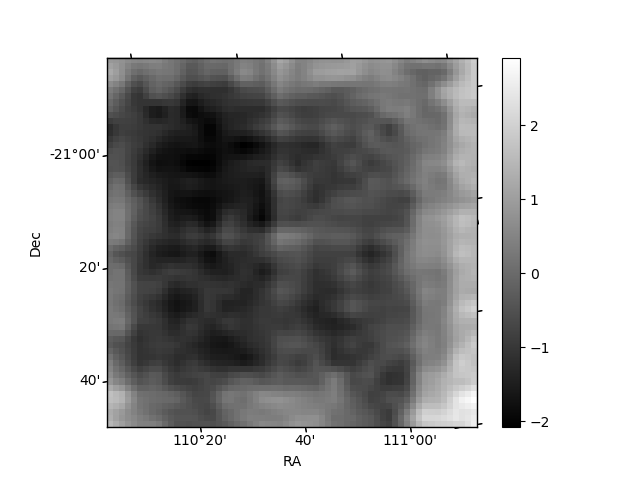
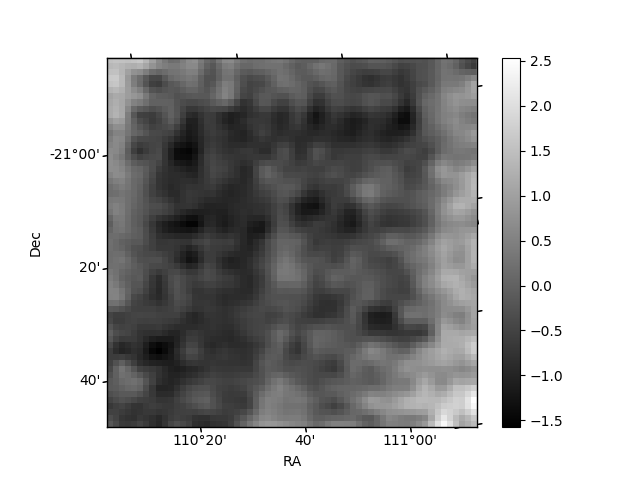
Histogram calculated using DETX and DETY for each event in the final _common_clean file
| Quadrant A | 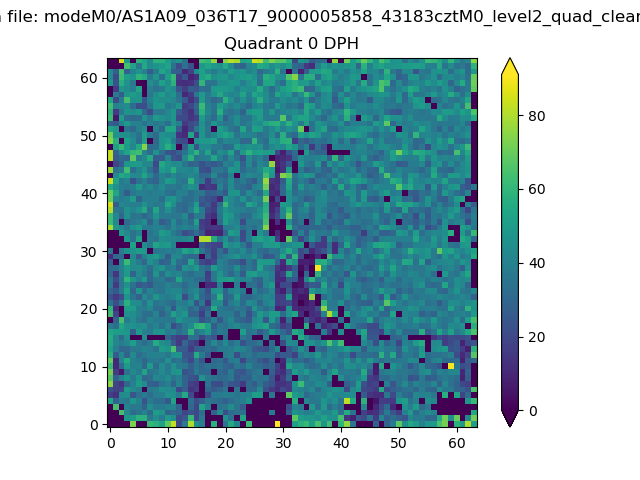 |
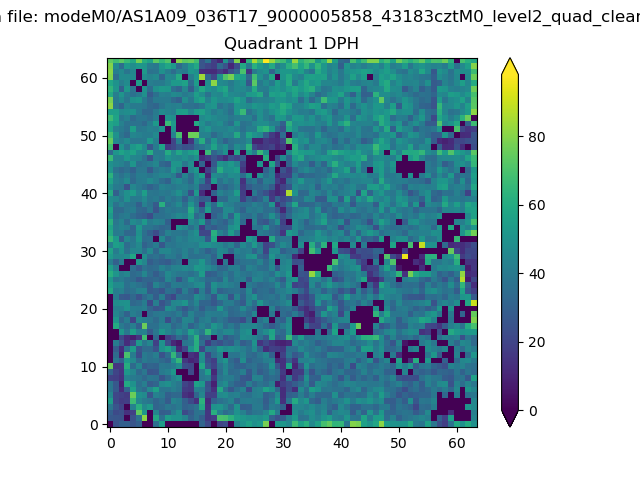 |
Quadrant B |
|---|---|---|---|
| Quadrant D | 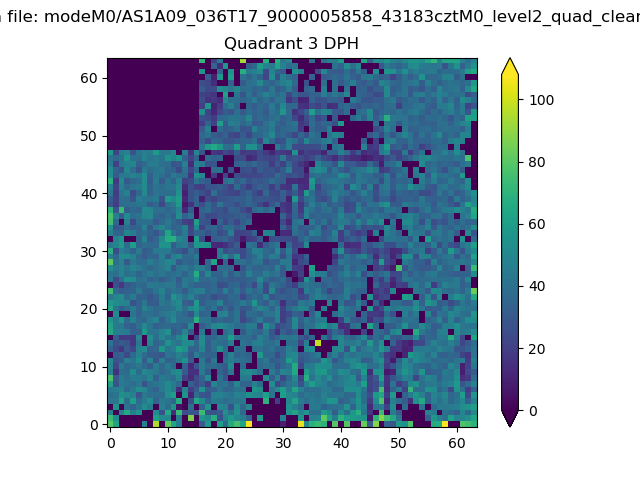 |
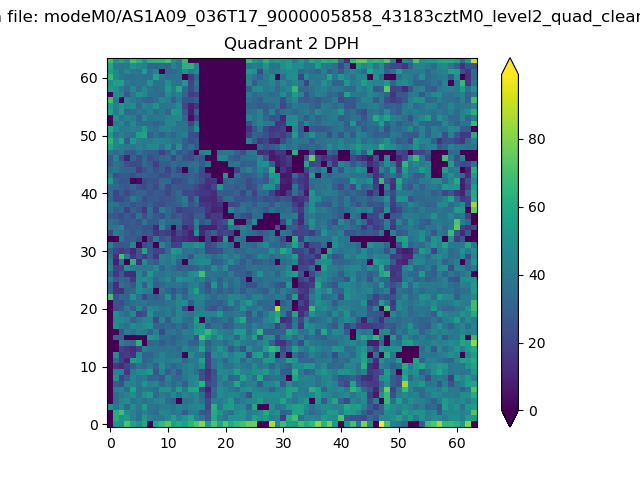 |
Quadrant C |
| Plot type | Count rate plots | Images |
|---|---|---|
| Comparison with Poisson distribution Blue bars denote a histogram of data divided into 1 sec bins. Red curve is a Poisson curve with rate = median count rate of data. |
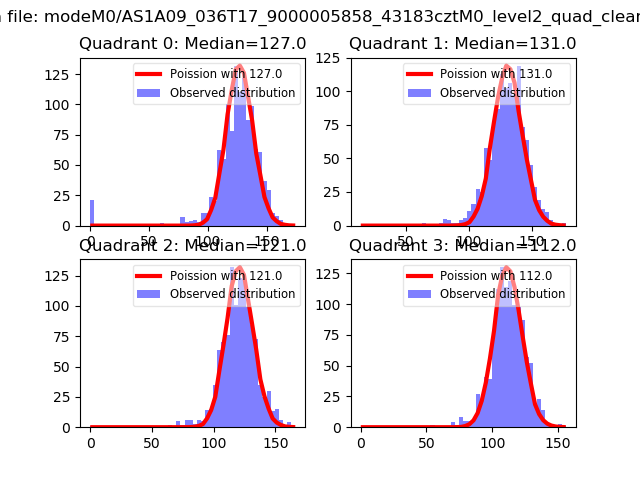 |
 |
| Quadrant-wise count rates Data is divided into 100 sec bins |
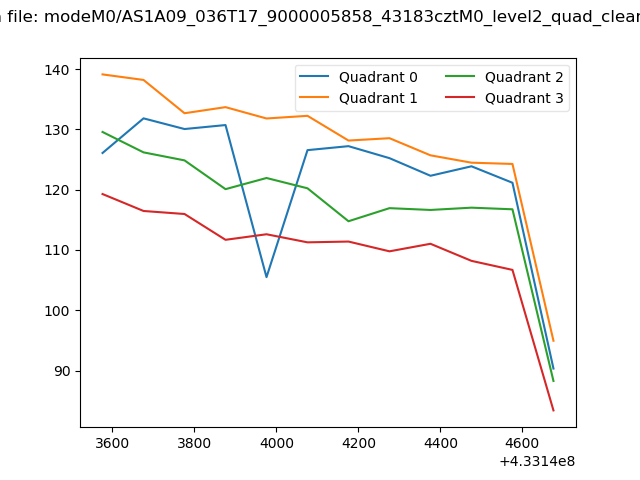 |
|
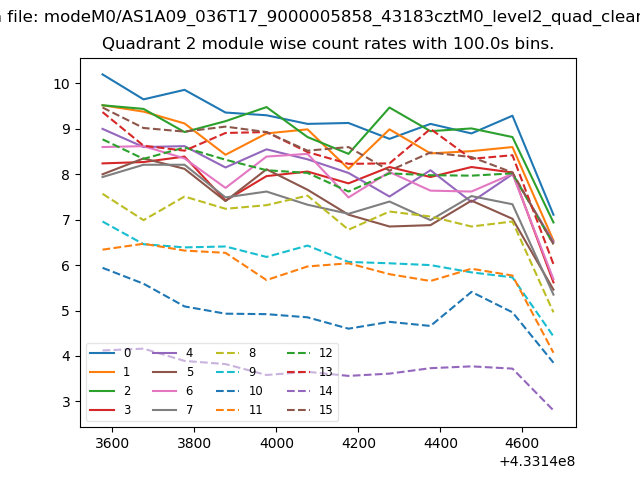
| Module-wise count rates for Quadrant A Data is divided into 100 sec bins |
 |
 |
| Module-wise count rates for Quadrant B Data is divided into 100 sec bins |
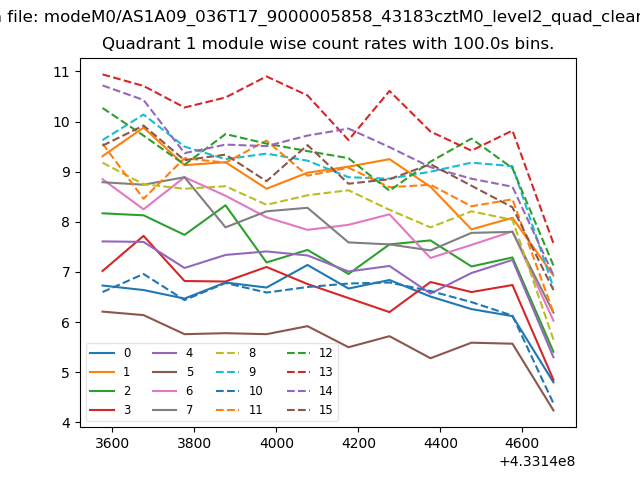 |
 |
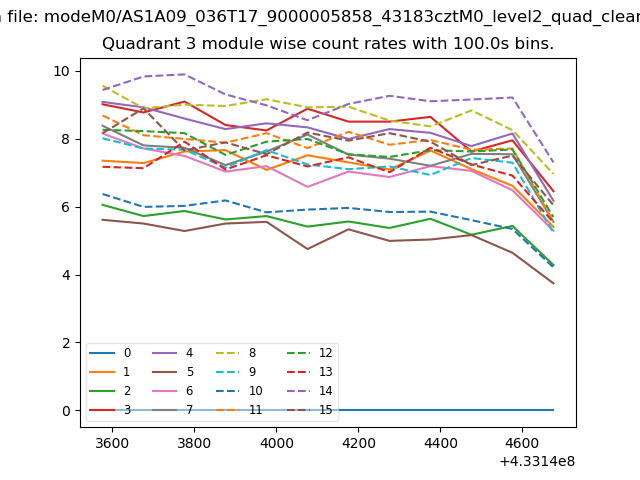
| Module-wise count rates for Quadrant C Data is divided into 100 sec bins |
 |
 |
| Module-wise count rates for Quadrant D Data is divided into 100 sec bins |
 |
 |
| Parameter | Plot |
|---|---|
| CZT HV Monitor | 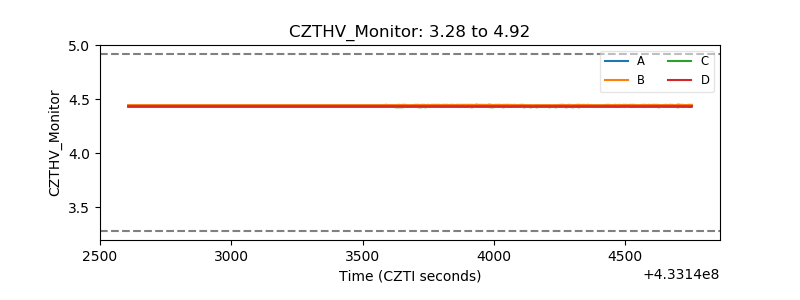 |
| D_VDD | 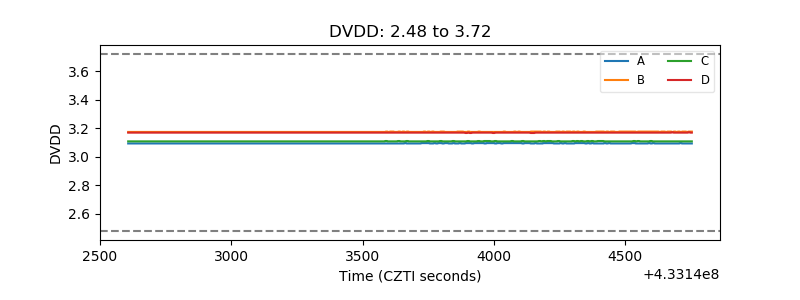 |
| Temperature 1 | 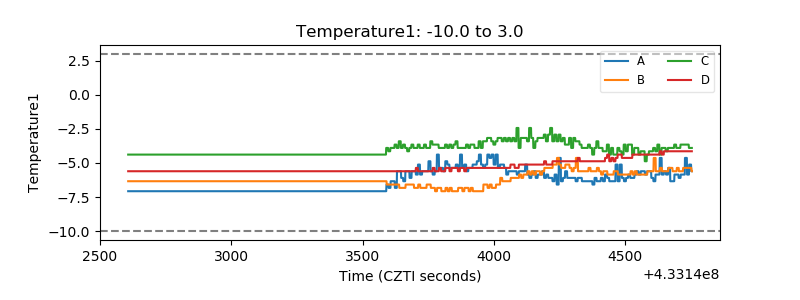 |
| Veto HV Monitor | 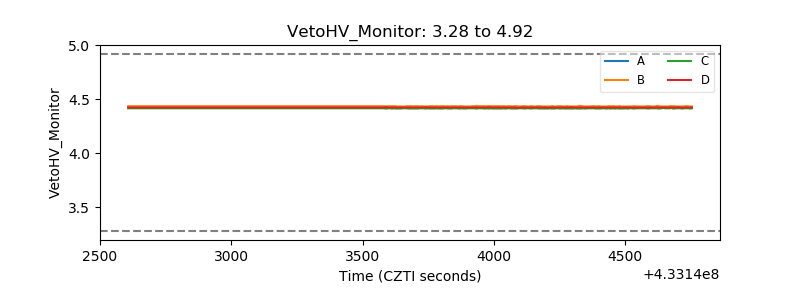 |
| Veto LLD | 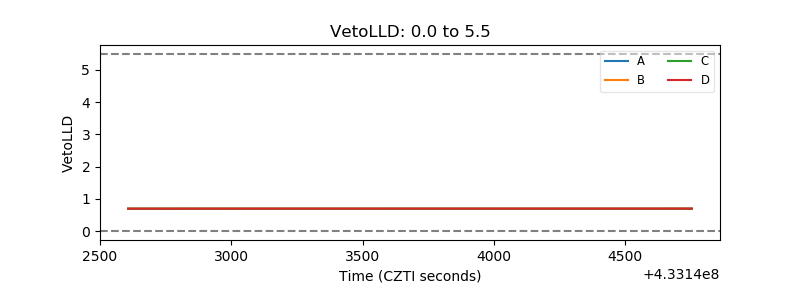 |
| Alpha Counter | 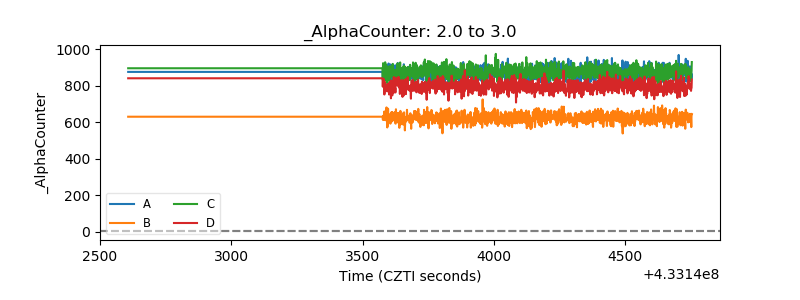 |
| _CPM_Rate | 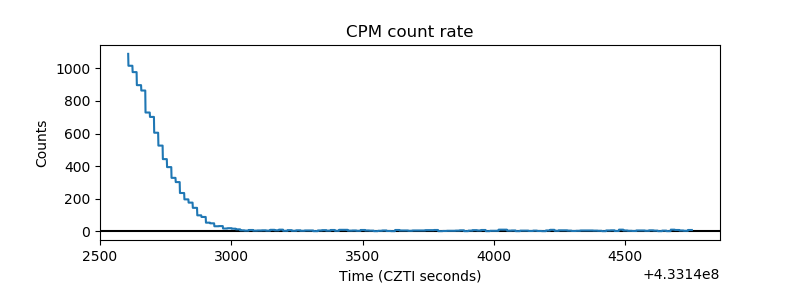 |
| CZT Counter |  |
| +2.5 Volts monitor | 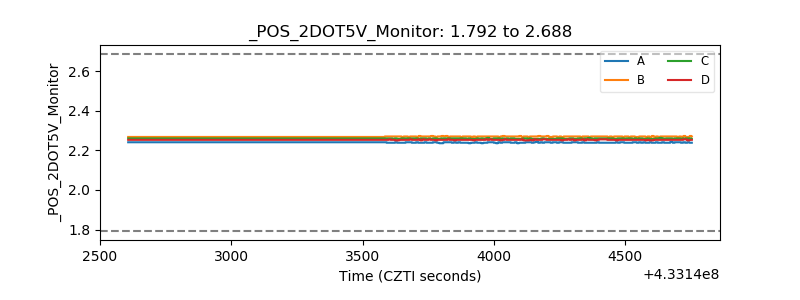 |
| +5 Volts monitor | 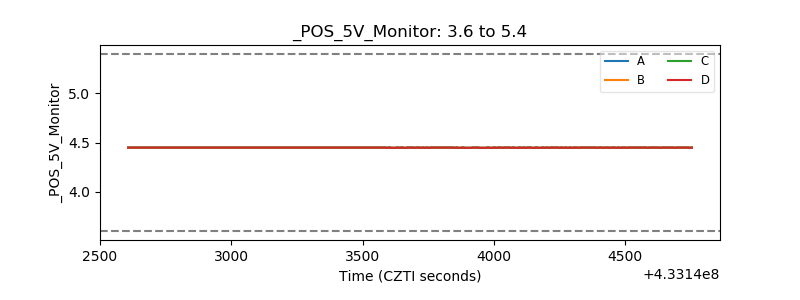 |
| _ROLL_ROT | 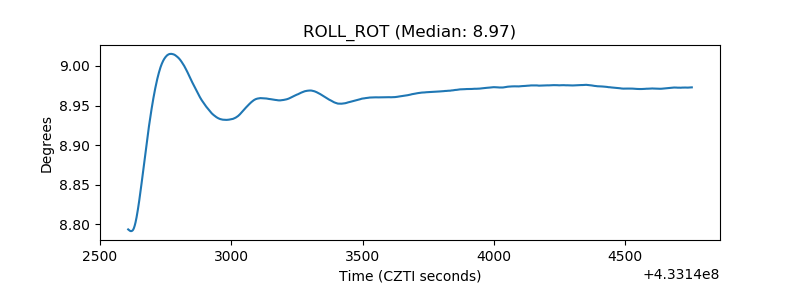 |
| _Roll_DEC | 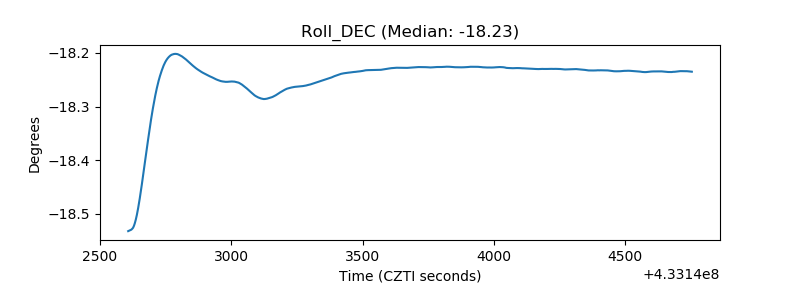 |
| _Roll_RA |  |
| Veto Counter | 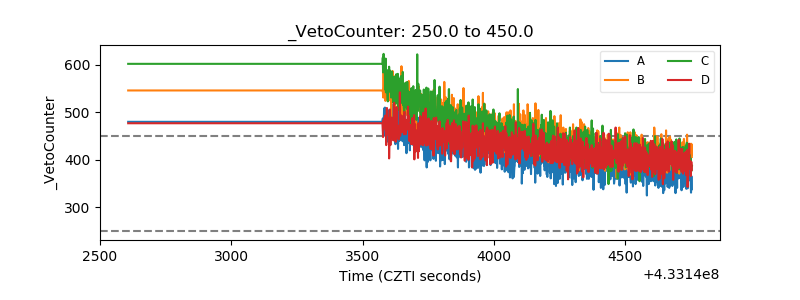 |