| Param | Original file | Final file |
|---|---|---|
| Filename | modeM0/AS1A09_036T17_9000005858_43185cztM0_level2.fits | modeM0/AS1A09_036T17_9000005858_43185cztM0_level2_quad_clean.evt |
| Size (bytes) | 413,585,280 | 88,427,520 |
| Size | 394.4 MB | 84.3 MB |
| Events in quadrant A | 5,487,985 | 543,086 |
| Events in quadrant B | 3,427,416 | 610,351 |
| Events in quadrant C | 2,697,899 | 606,298 |
| Events in quadrant D | 3,286,419 | 549,130 |
| Mode M0 | |||
|---|---|---|---|
| Quadrant | BADHDUFLAG | Total packets | Discarded packets |
| A | 0 | 19840 | 2 |
| B | 0 | 13735 | 2 |
| C | 0 | 11099 | 2 |
| D | 0 | 13322 | 2 |
| Mode SS | |||
|---|---|---|---|
| Quadrant | BADHDUFLAG | Total packets | Discarded packets |
| A | 0 | 106 | 0 |
| B | 0 | 106 | 0 |
| C | 0 | 106 | 0 |
| D | 0 | 106 | 0 |
| Mode M9 | |||
|---|---|---|---|
| Quadrant | BADHDUFLAG | Total packets | Discarded packets |
| A | 0 | 25 | 0 |
| B | 0 | 26 | 0 |
| C | 0 | 26 | 0 |
| D | 0 | 26 | 0 |
| Quadrant | Total seconds | Saturated seconds | Saturation percentage |
|---|---|---|---|
| A | 5268 | 862 | 16.362946% |
| B | 5268 | 267 | 5.068337% |
| C | 5268 | 5 | 0.094913% |
| D | 5268 | 159 | 3.018223% |
Noise dominated data is calculated using 1-second bins in cleaned event files. If a bin has >2000 counts, and if more than 50% of those come from <1% of pixels, then it is considered to be noise-dominated and hence unusable.
| Quadrant | # 1 sec bins | Bins with >0 counts | Bins with >2000 counts | High rate bins dominated by noise | Noise dominated (total time) | Noise dominated (detector-on time) | Marked lightcurve |
|---|---|---|---|---|---|---|---|
| A | 7420 | 5269 | 708 | 708 | 9.54% | 13.44% | 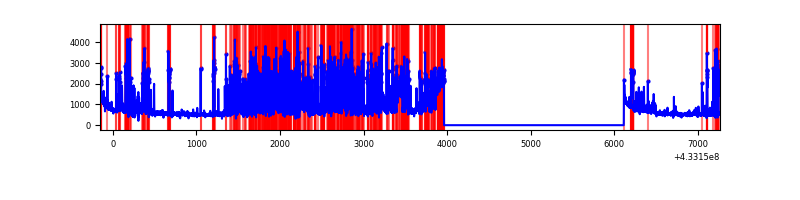 |
| B | 7420 | 5269 | 191 | 191 | 2.57% | 3.62% | 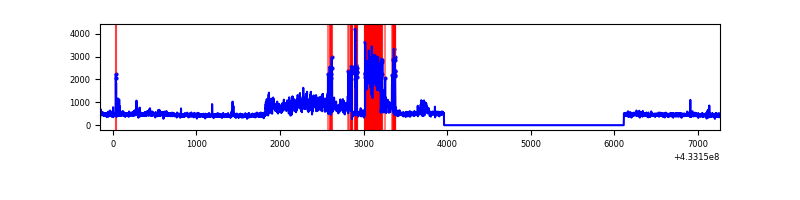 |
| C | 7420 | 5269 | 3 | 3 | 0.04% | 0.06% | 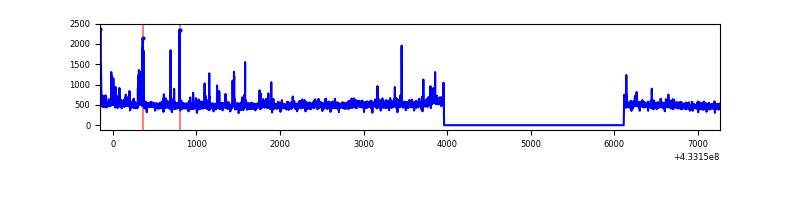 |
| D | 7420 | 5269 | 130 | 130 | 1.75% | 2.47% | 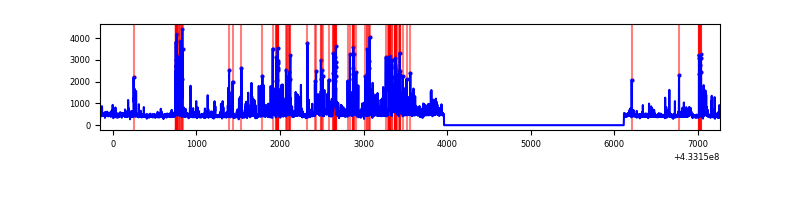 |
Top three noisy pixels from each quadrant. If the there are fewer than three noisy pixels in the level2.evt file, extra rows are filled as -1
| Pixel properties | Quadrant properties | ||||||
|---|---|---|---|---|---|---|---|
| Quadrant | DetID | PixID | Counts | Sigma | Mean | Median | Sigma |
| A | 15 | 222 | 2176468 | 18743.78 | 564 | 554 | 116.1 |
| A | 10 | 83 | 561977 | 4836.21 | 564 | 554 | 116.1 |
| A | 15 | 237 | 449409 | 3866.53 | 564 | 554 | 116.1 |
| B | 0 | 186 | 983940 | 8692.91 | 587 | 572 | 113.1 |
| B | 5 | 255 | 90194 | 792.25 | 587 | 572 | 113.1 |
| B | 0 | 229 | 29934 | 259.56 | 587 | 572 | 113.1 |
| C | 15 | 214 | 225269 | 1629.86 | 589 | 594 | 137.8 |
| C | 4 | 254 | 86311 | 621.82 | 589 | 594 | 137.8 |
| C | 8 | 79 | 32142 | 228.86 | 589 | 594 | 137.8 |
| D | 1 | 52 | 800554 | 5480.94 | 589 | 571 | 146.0 |
| D | 13 | 249 | 72179 | 490.61 | 589 | 571 | 146.0 |
| D | 10 | 118 | 63157 | 428.8 | 589 | 571 | 146.0 |
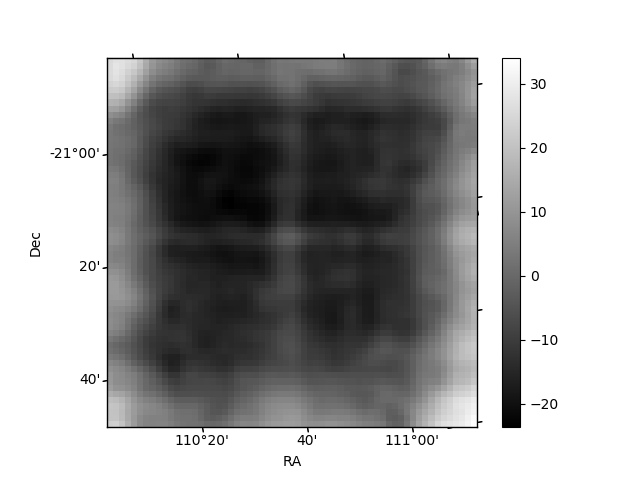
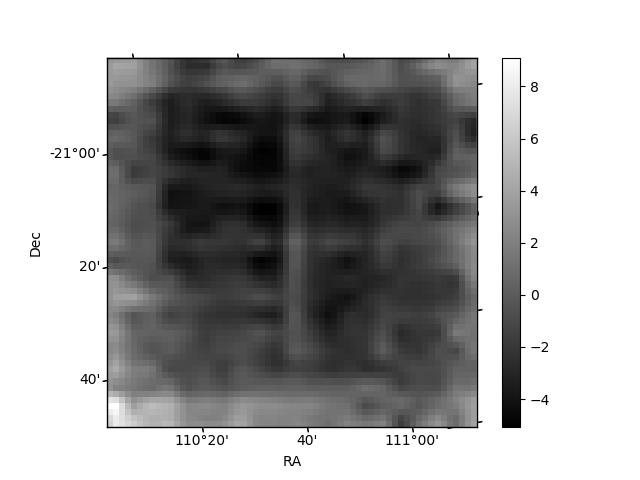
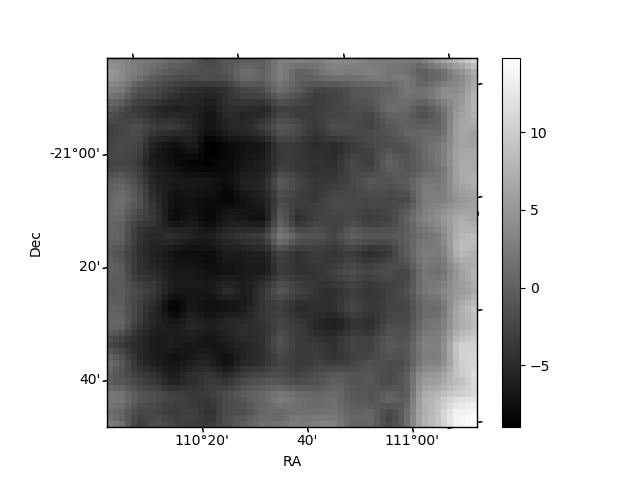
Histogram calculated using DETX and DETY for each event in the final _common_clean file
| Quadrant A | 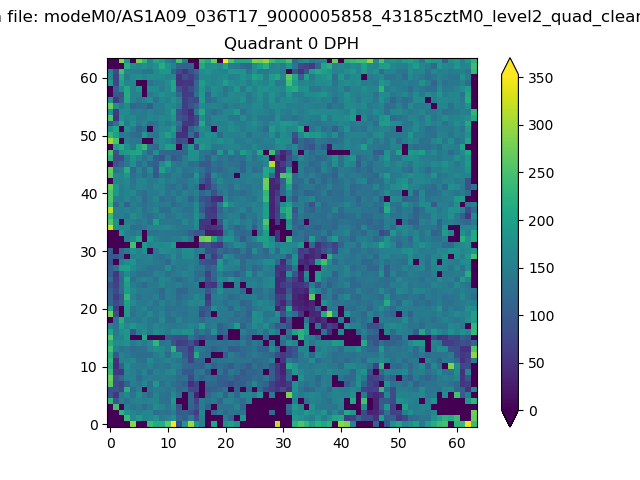 |
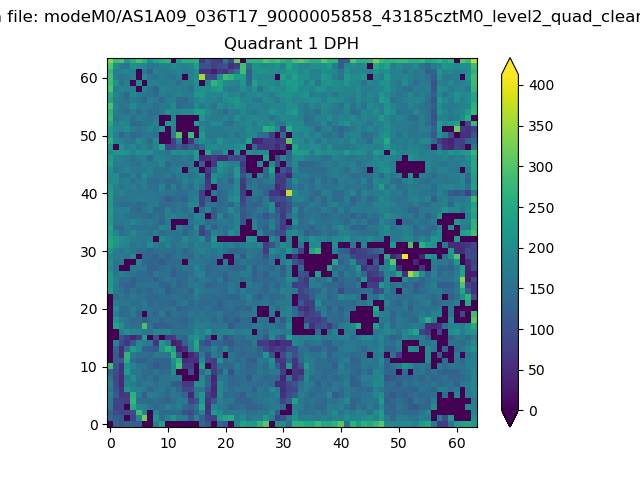 |
Quadrant B |
|---|---|---|---|
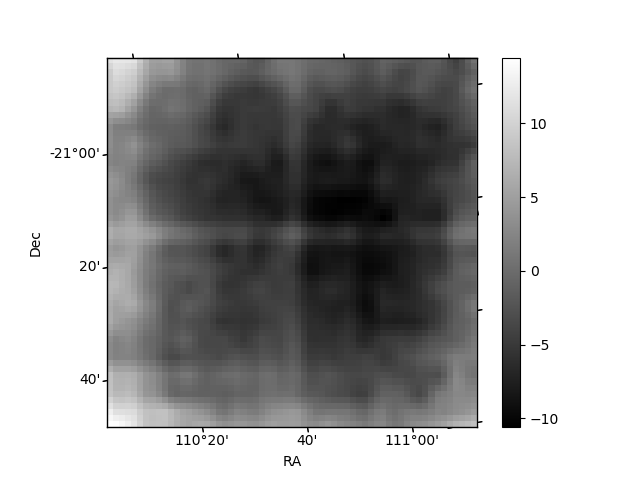
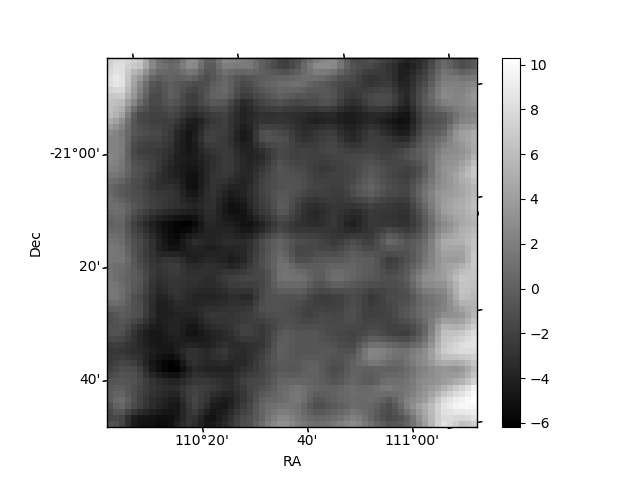
| Quadrant D | 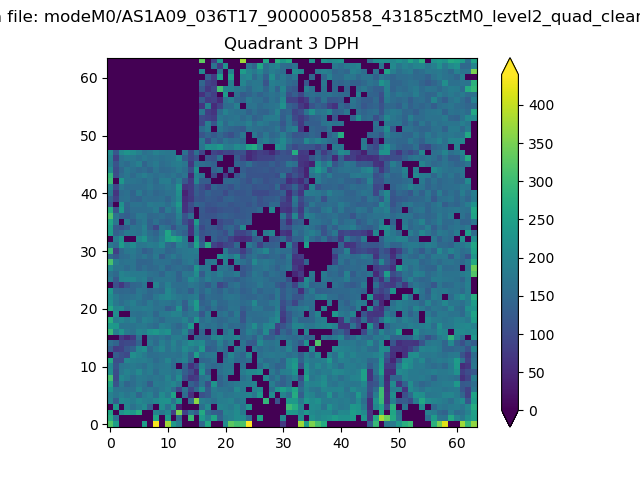 |
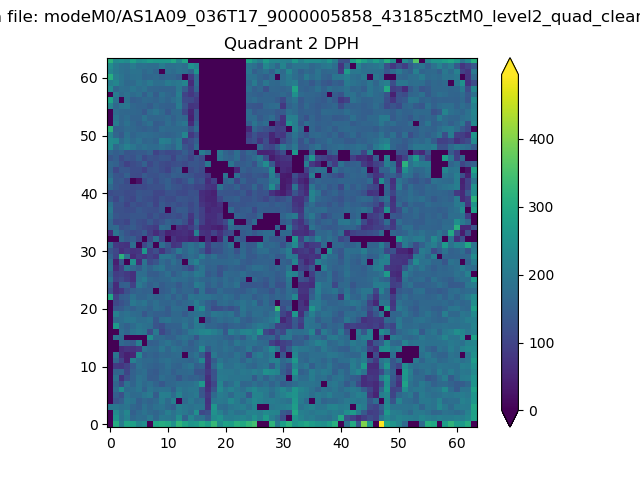 |
Quadrant C |
| Plot type | Count rate plots | Images |
|---|---|---|
| Comparison with Poisson distribution Blue bars denote a histogram of data divided into 1 sec bins. Red curve is a Poisson curve with rate = median count rate of data. |
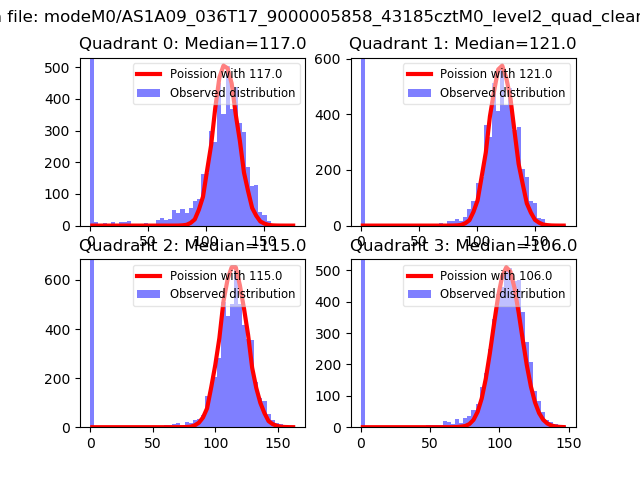 |
 |
| Quadrant-wise count rates Data is divided into 100 sec bins |
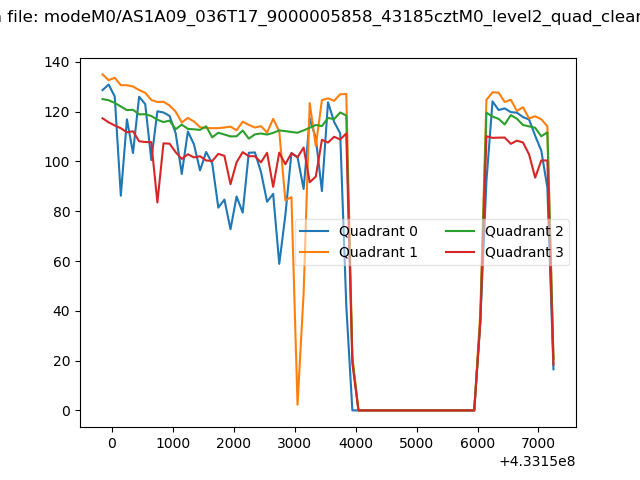 |
|
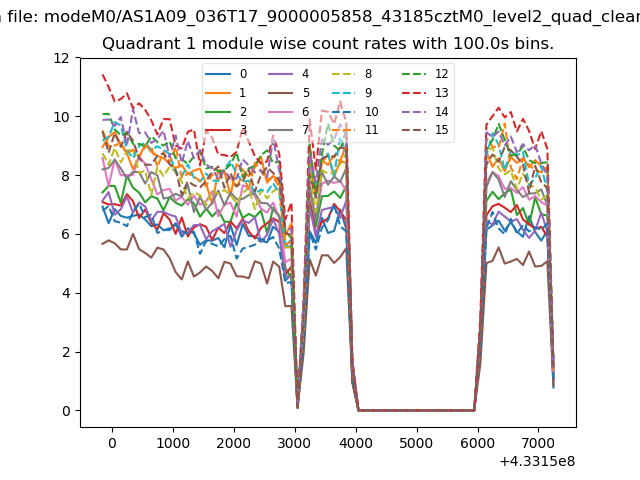
| Module-wise count rates for Quadrant A Data is divided into 100 sec bins |
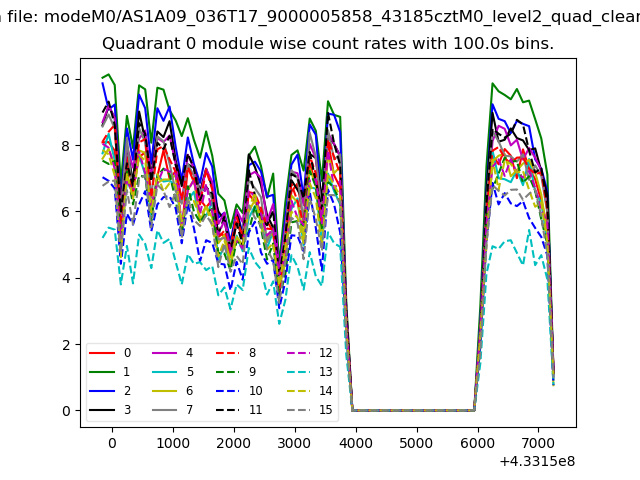 |
 |
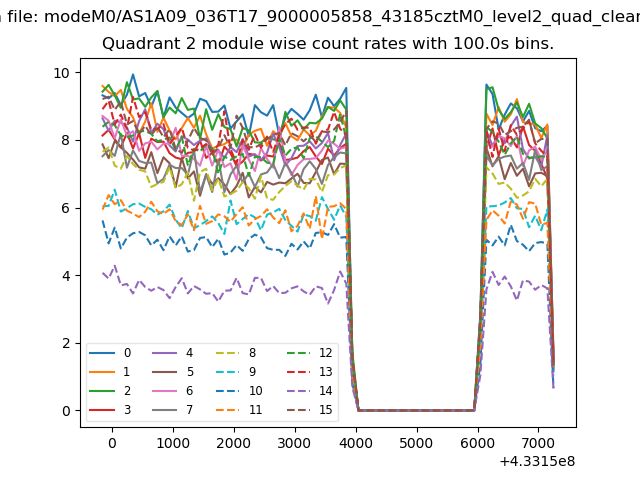
| Module-wise count rates for Quadrant B Data is divided into 100 sec bins |
 |
 |
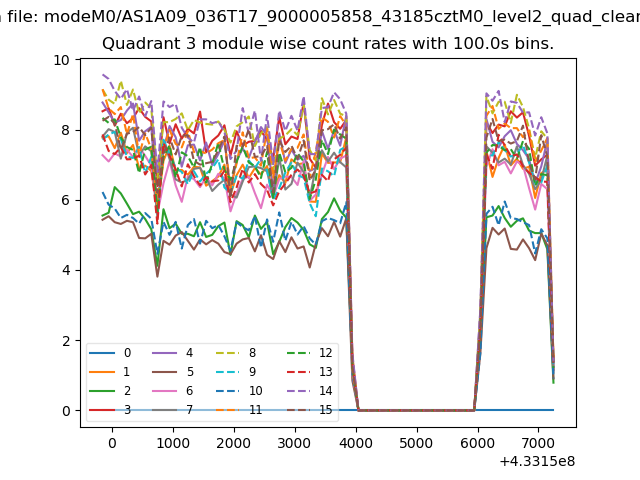
| Module-wise count rates for Quadrant C Data is divided into 100 sec bins |
 |
 |
| Module-wise count rates for Quadrant D Data is divided into 100 sec bins |
 |
 |
| Parameter | Plot |
|---|---|
| CZT HV Monitor | 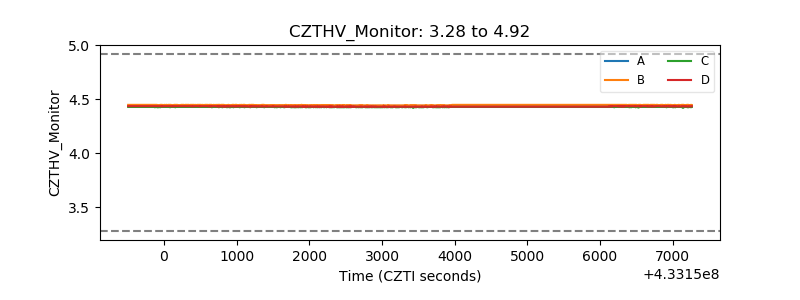 |
| D_VDD | 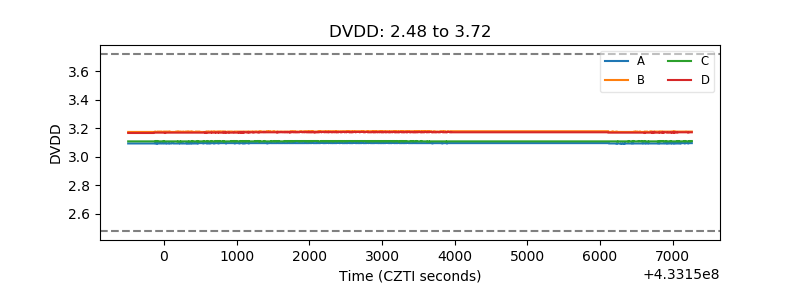 |
| Temperature 1 | 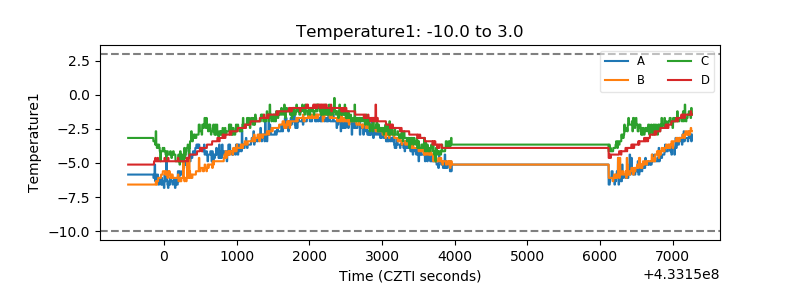 |
| Veto HV Monitor | 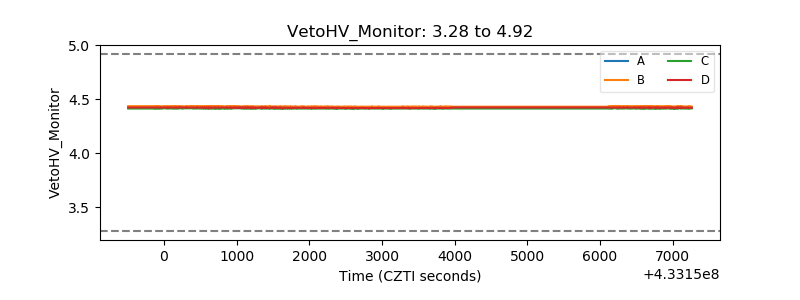 |
| Veto LLD | 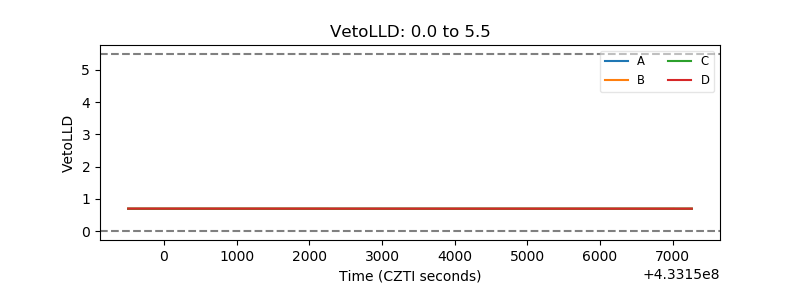 |
| Alpha Counter | 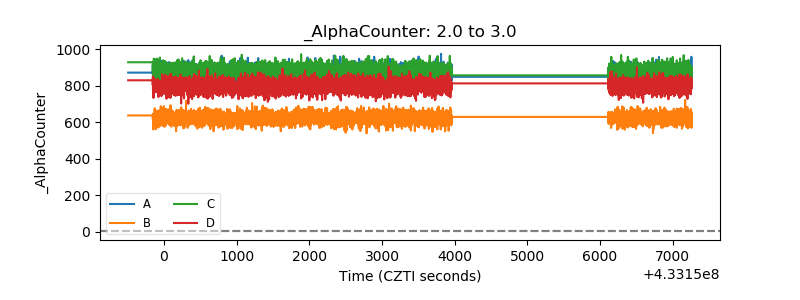 |
| _CPM_Rate | 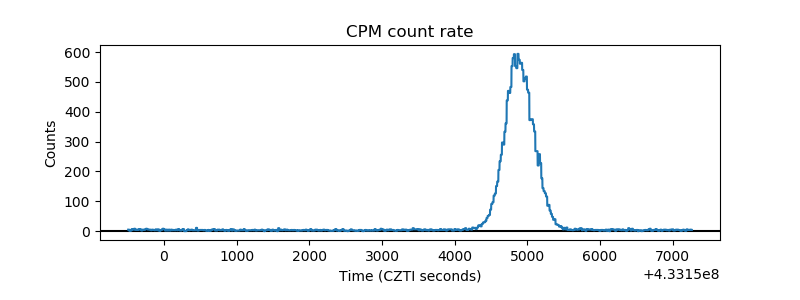 |
| CZT Counter | 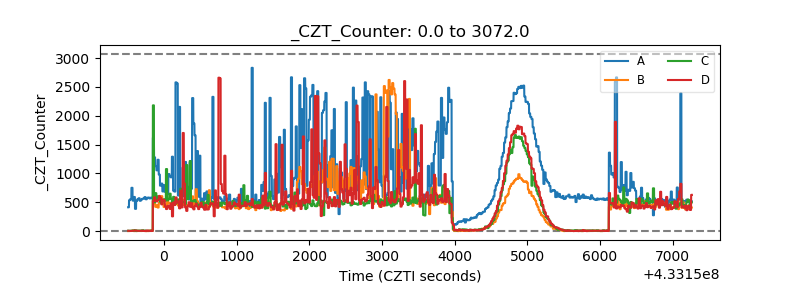 |
| +2.5 Volts monitor | 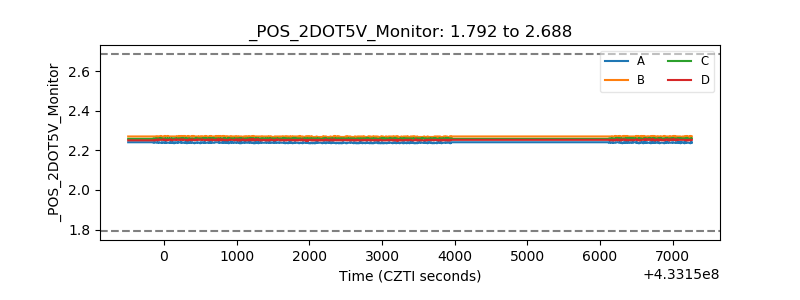 |
| +5 Volts monitor | 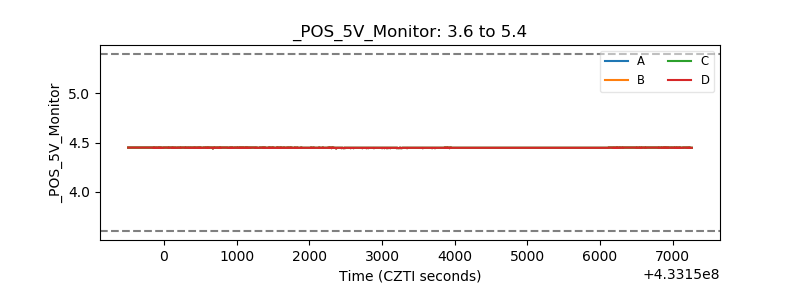 |
| _ROLL_ROT |  |
| _Roll_DEC | 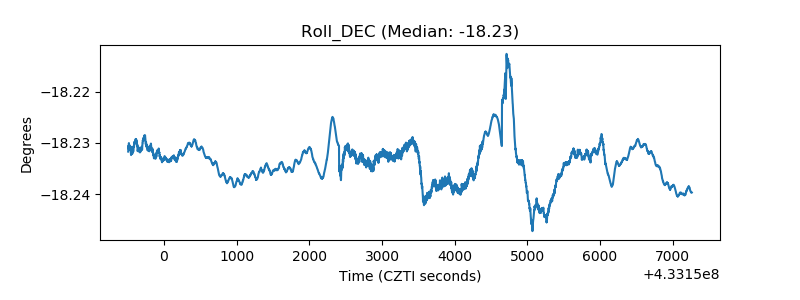 |
| _Roll_RA | 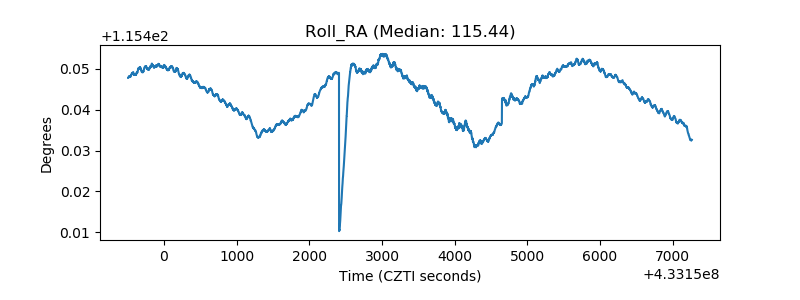 |
| Veto Counter | 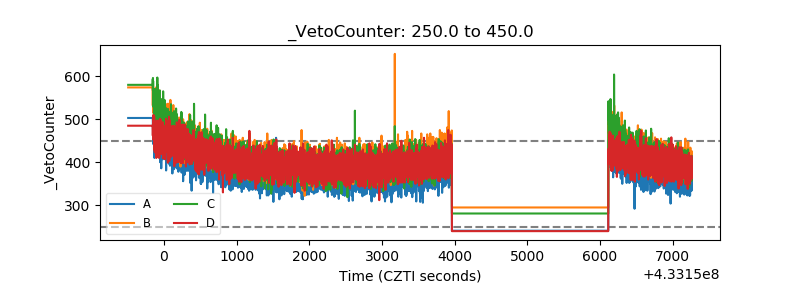 |