| Param | Original file | Final file |
|---|---|---|
| Filename | modeM0/AS1A09_036T17_9000005858_43186cztM0_level2.fits | modeM0/AS1A09_036T17_9000005858_43186cztM0_level2_quad_clean.evt |
| Size (bytes) | 395,069,760 | 87,353,280 |
| Size | 376.8 MB | 83.3 MB |
| Events in quadrant A | 5,212,315 | 521,133 |
| Events in quadrant B | 3,418,344 | 615,174 |
| Events in quadrant C | 2,607,407 | 593,835 |
| Events in quadrant D | 2,972,074 | 542,392 |
| Mode M0 | |||
|---|---|---|---|
| Quadrant | BADHDUFLAG | Total packets | Discarded packets |
| A | 0 | 19010 | 2 |
| B | 0 | 13760 | 2 |
| C | 0 | 10969 | 2 |
| D | 0 | 12417 | 2 |
| Mode SS | |||
|---|---|---|---|
| Quadrant | BADHDUFLAG | Total packets | Discarded packets |
| A | 0 | 108 | 0 |
| B | 0 | 108 | 0 |
| C | 0 | 108 | 0 |
| D | 0 | 108 | 0 |
| Mode M9 | |||
|---|---|---|---|
| Quadrant | BADHDUFLAG | Total packets | Discarded packets |
| A | 0 | 24 | 0 |
| B | 0 | 25 | 0 |
| C | 0 | 25 | 0 |
| D | 0 | 25 | 0 |
| Quadrant | Total seconds | Saturated seconds | Saturation percentage |
|---|---|---|---|
| A | 5322 | 815 | 15.313792% |
| B | 5322 | 114 | 2.142052% |
| C | 5322 | 8 | 0.150319% |
| D | 5322 | 86 | 1.615934% |
Noise dominated data is calculated using 1-second bins in cleaned event files. If a bin has >2000 counts, and if more than 50% of those come from <1% of pixels, then it is considered to be noise-dominated and hence unusable.
| Quadrant | # 1 sec bins | Bins with >0 counts | Bins with >2000 counts | High rate bins dominated by noise | Noise dominated (total time) | Noise dominated (detector-on time) | Marked lightcurve |
|---|---|---|---|---|---|---|---|
| A | 7415 | 5323 | 694 | 694 | 9.36% | 13.04% | 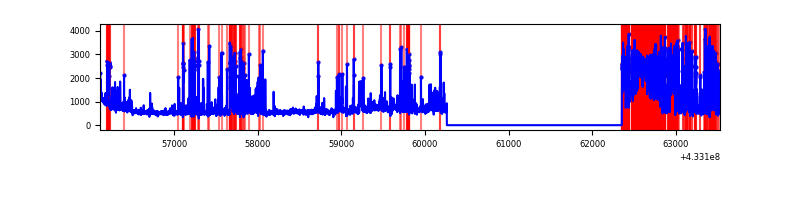 |
| B | 7415 | 5323 | 70 | 70 | 0.94% | 1.32% | 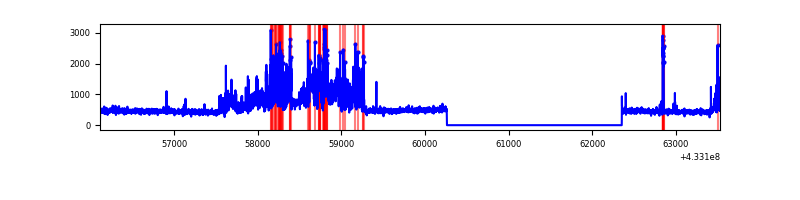 |
| C | 7415 | 5323 | 1 | 1 | 0.01% | 0.02% | 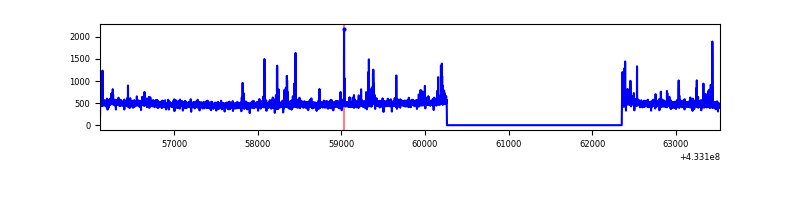 |
| D | 7415 | 5323 | 74 | 74 | 1.00% | 1.39% | 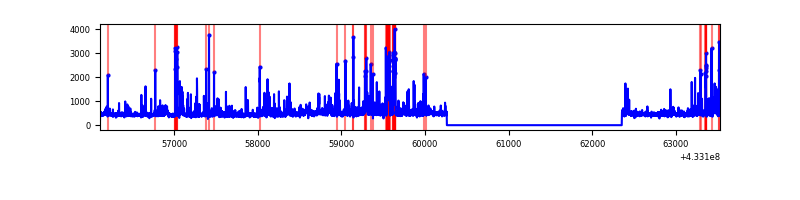 |
Top three noisy pixels from each quadrant. If the there are fewer than three noisy pixels in the level2.evt file, extra rows are filled as -1
| Pixel properties | Quadrant properties | ||||||
|---|---|---|---|---|---|---|---|
| Quadrant | DetID | PixID | Counts | Sigma | Mean | Median | Sigma |
| A | 15 | 222 | 1069171 | 9374.48 | 556 | 545 | 114.0 |
| A | 15 | 237 | 982326 | 8612.64 | 556 | 545 | 114.0 |
| A | 10 | 83 | 528439 | 4630.93 | 556 | 545 | 114.0 |
| B | 0 | 186 | 944434 | 8064.25 | 593 | 576 | 117.0 |
| B | 5 | 172 | 50795 | 429.07 | 593 | 576 | 117.0 |
| B | 15 | 85 | 46770 | 394.68 | 593 | 576 | 117.0 |
| C | 15 | 214 | 225976 | 1653.42 | 584 | 590 | 136.3 |
| C | 14 | 254 | 87733 | 639.28 | 584 | 590 | 136.3 |
| C | 8 | 79 | 8943 | 61.28 | 584 | 590 | 136.3 |
| D | 1 | 52 | 535271 | 3658.95 | 588 | 572 | 146.1 |
| D | 13 | 249 | 82491 | 560.57 | 588 | 572 | 146.1 |
| D | 13 | 84 | 29008 | 194.59 | 588 | 572 | 146.1 |
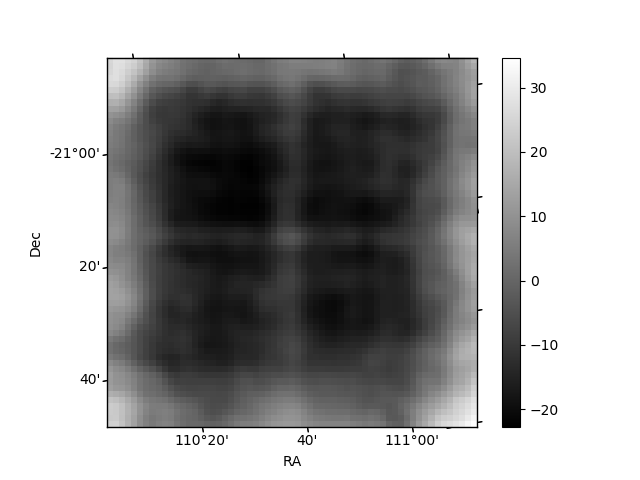
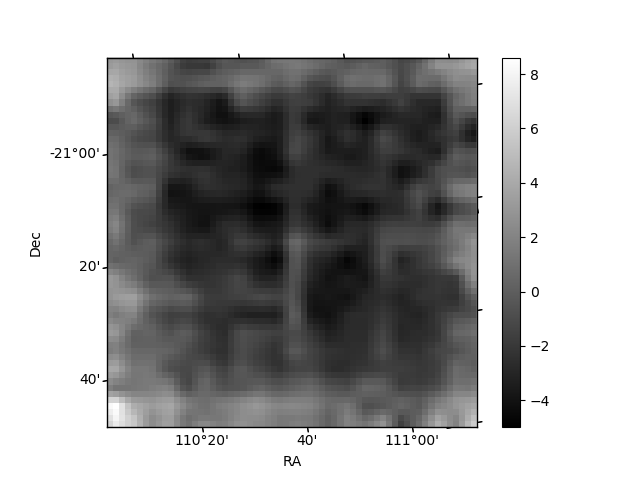
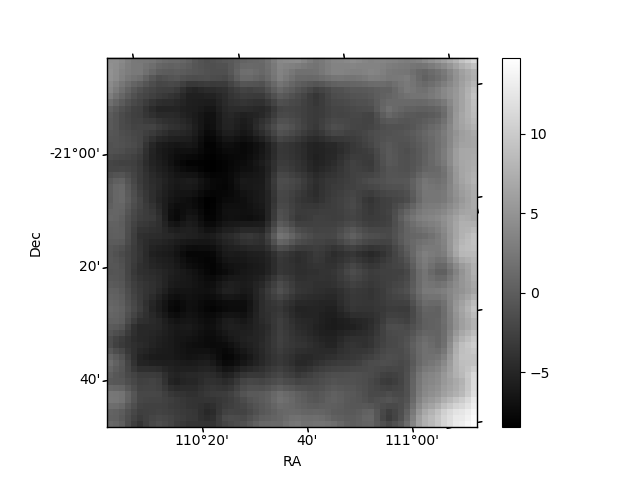
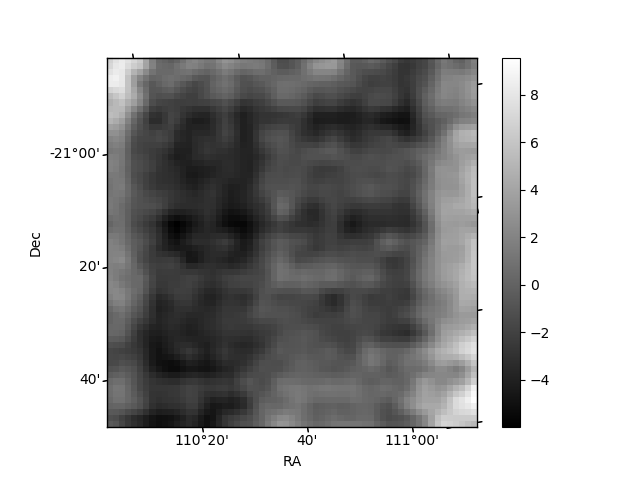
Histogram calculated using DETX and DETY for each event in the final _common_clean file
| Quadrant A | 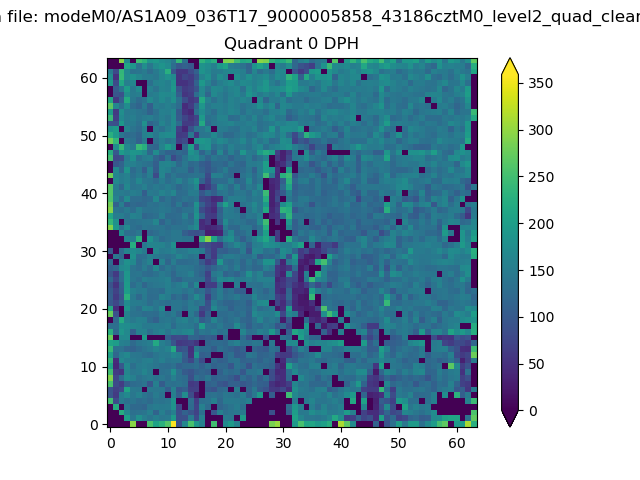 |
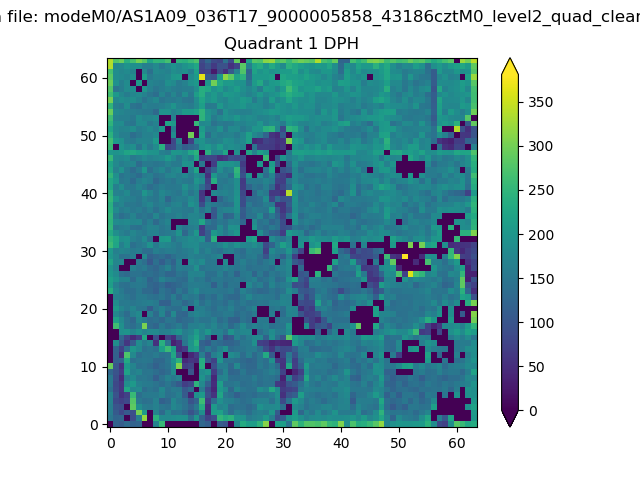 |
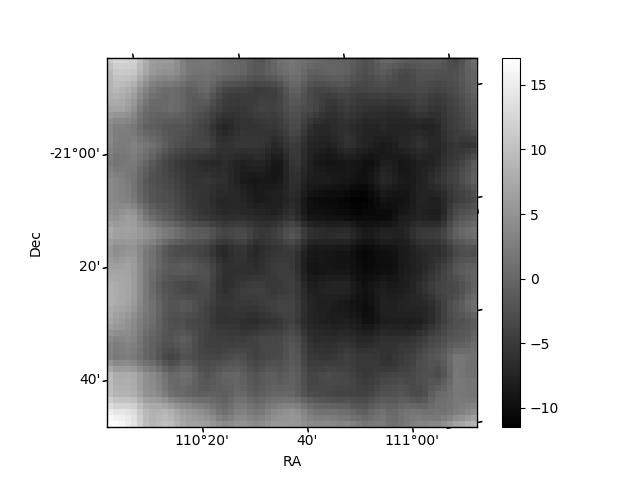
Quadrant B |
|---|---|---|---|
| Quadrant D | 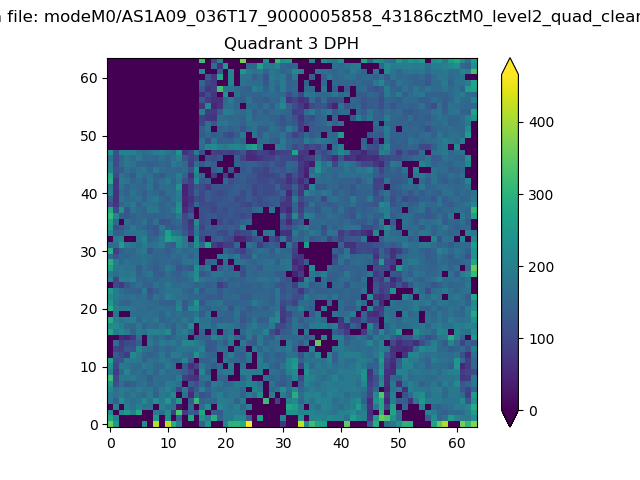 |
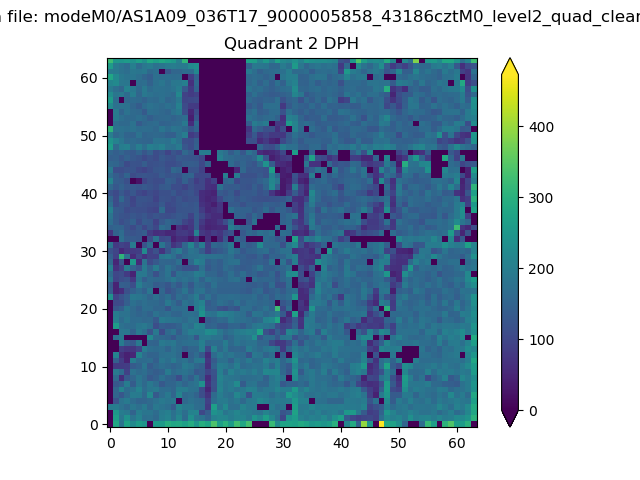 |
Quadrant C |
| Plot type | Count rate plots | Images |
|---|---|---|
| Comparison with Poisson distribution Blue bars denote a histogram of data divided into 1 sec bins. Red curve is a Poisson curve with rate = median count rate of data. |
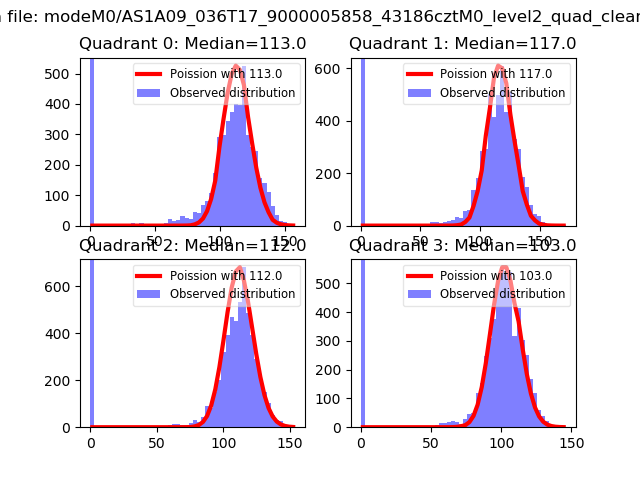 |
 |
| Quadrant-wise count rates Data is divided into 100 sec bins |
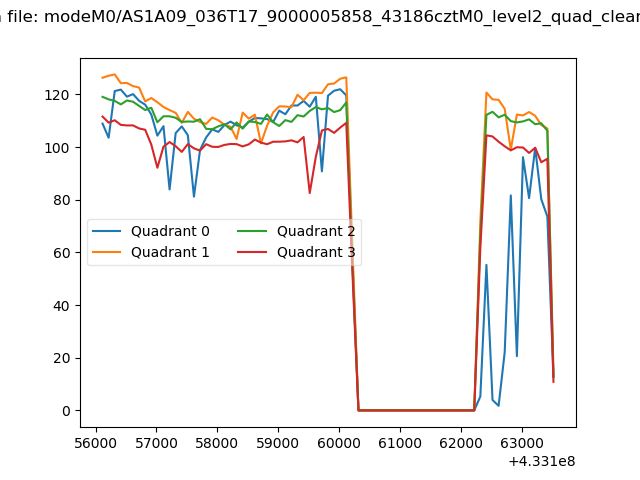 |
|
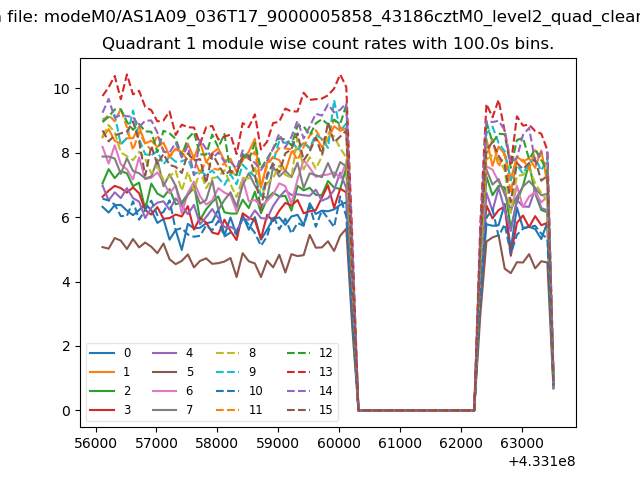
| Module-wise count rates for Quadrant A Data is divided into 100 sec bins |
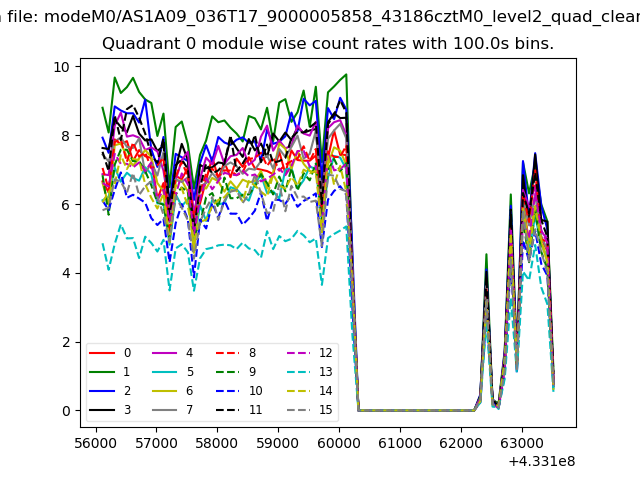 |
 |
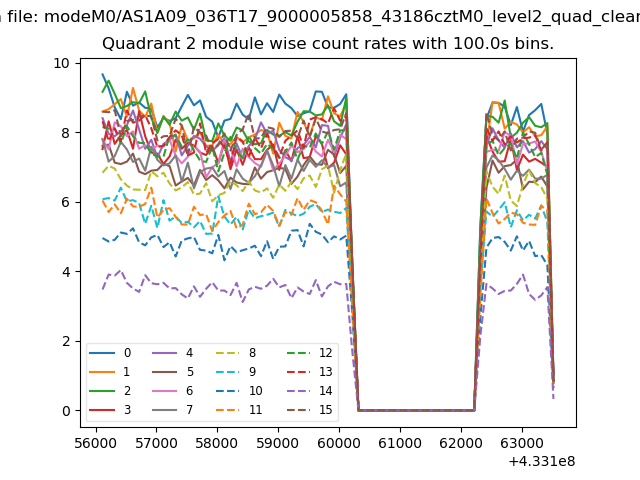
| Module-wise count rates for Quadrant B Data is divided into 100 sec bins |
 |
 |
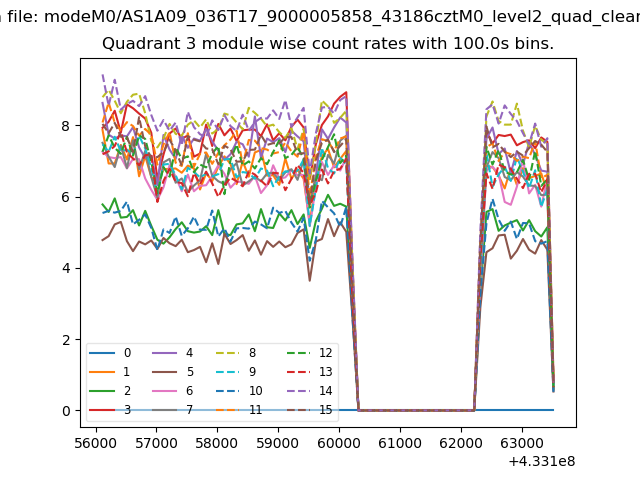
| Module-wise count rates for Quadrant C Data is divided into 100 sec bins |
 |
 |
| Module-wise count rates for Quadrant D Data is divided into 100 sec bins |
 |
 |
| Parameter | Plot |
|---|---|
| CZT HV Monitor | 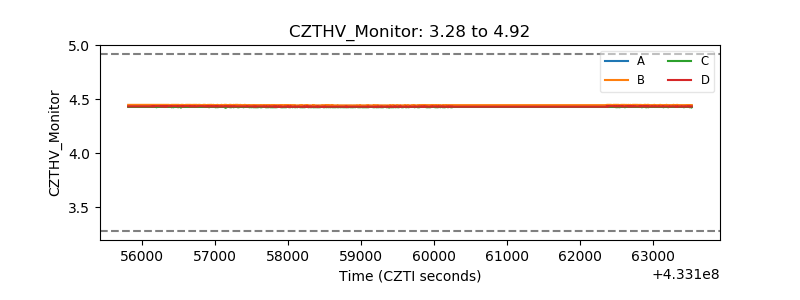 |
| D_VDD | 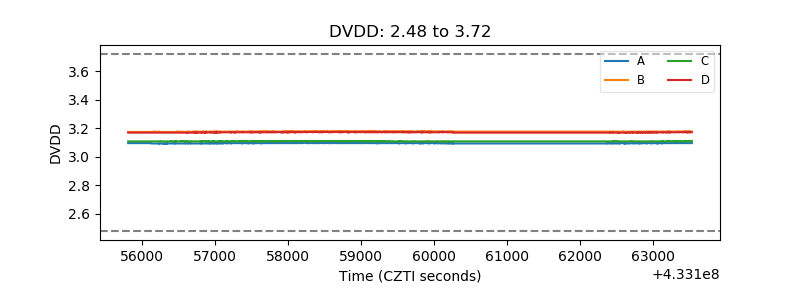 |
| Temperature 1 | 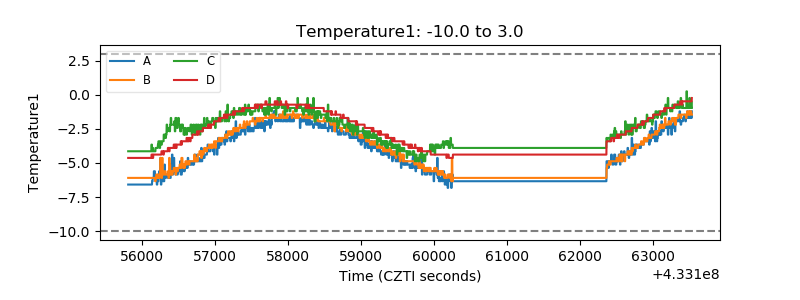 |
| Veto HV Monitor | 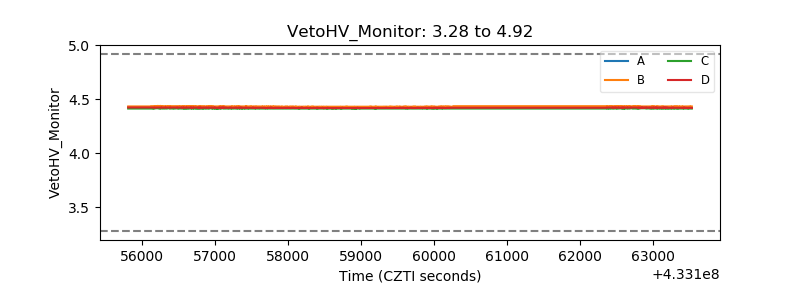 |
| Veto LLD | 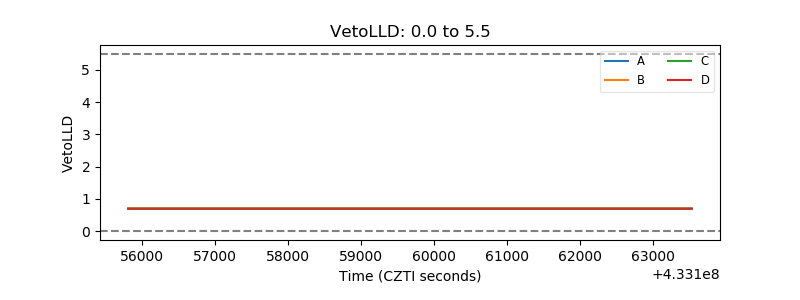 |
| Alpha Counter |  |
| _CPM_Rate |  |
| CZT Counter | 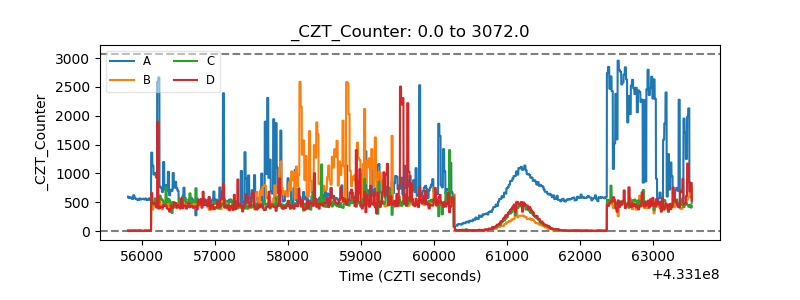 |
| +2.5 Volts monitor | 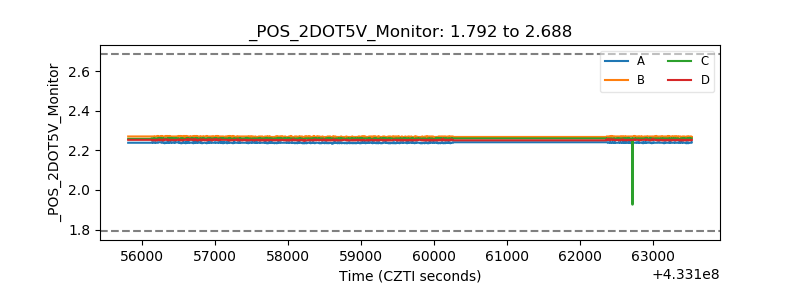 |
| +5 Volts monitor |  |
| _ROLL_ROT | 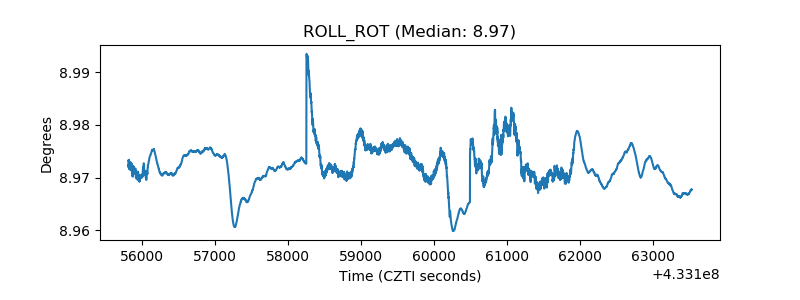 |
| _Roll_DEC | 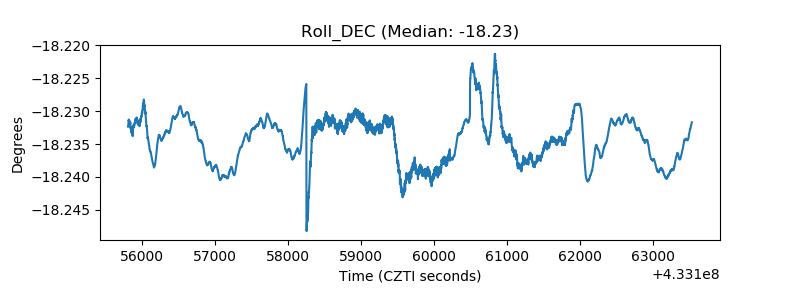 |
| _Roll_RA | 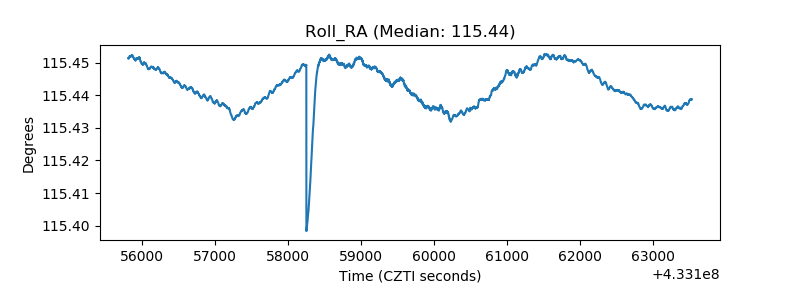 |
| Veto Counter | 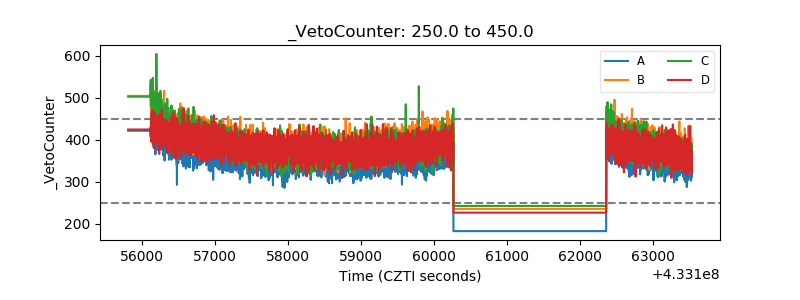 |