| Param | Original file | Final file |
|---|---|---|
| Filename | modeM0/AS1A09_036T17_9000005858_43187cztM0_level2.fits | modeM0/AS1A09_036T17_9000005858_43187cztM0_level2_quad_clean.evt |
| Size (bytes) | 434,134,080 | 85,795,200 |
| Size | 414.0 MB | 81.8 MB |
| Events in quadrant A | 5,922,215 | 484,896 |
| Events in quadrant B | 3,580,177 | 605,508 |
| Events in quadrant C | 2,622,197 | 588,965 |
| Events in quadrant D | 3,520,260 | 535,430 |
| Mode M0 | |||
|---|---|---|---|
| Quadrant | BADHDUFLAG | Total packets | Discarded packets |
| A | 0 | 21075 | 2 |
| B | 0 | 14353 | 2 |
| C | 0 | 11171 | 2 |
| D | 0 | 14111 | 2 |
| Mode SS | |||
|---|---|---|---|
| Quadrant | BADHDUFLAG | Total packets | Discarded packets |
| A | 0 | 112 | 0 |
| B | 0 | 112 | 0 |
| C | 0 | 112 | 0 |
| D | 0 | 112 | 0 |
| Mode M9 | |||
|---|---|---|---|
| Quadrant | BADHDUFLAG | Total packets | Discarded packets |
| A | 0 | 20 | 0 |
| B | 0 | 21 | 0 |
| C | 0 | 21 | 0 |
| D | 0 | 21 | 0 |
| Quadrant | Total seconds | Saturated seconds | Saturation percentage |
|---|---|---|---|
| A | 5466 | 1239 | 22.667398% |
| B | 5466 | 158 | 2.890596% |
| C | 5466 | 6 | 0.109769% |
| D | 5466 | 171 | 3.128430% |
Noise dominated data is calculated using 1-second bins in cleaned event files. If a bin has >2000 counts, and if more than 50% of those come from <1% of pixels, then it is considered to be noise-dominated and hence unusable.
| Quadrant | # 1 sec bins | Bins with >0 counts | Bins with >2000 counts | High rate bins dominated by noise | Noise dominated (total time) | Noise dominated (detector-on time) | Marked lightcurve |
|---|---|---|---|---|---|---|---|
| A | 7380 | 5468 | 939 | 939 | 12.72% | 17.17% | 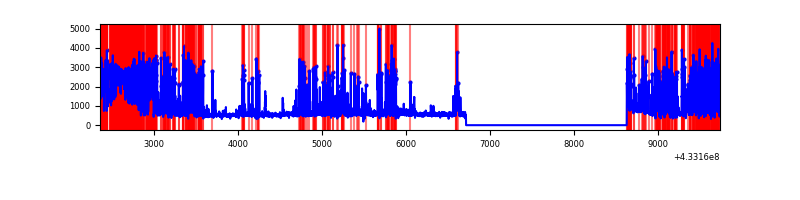 |
| B | 7380 | 5468 | 100 | 100 | 1.36% | 1.83% | 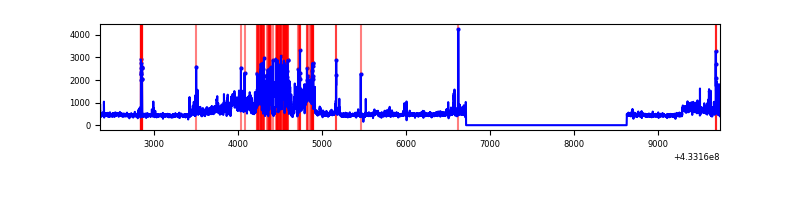 |
| C | 7380 | 5468 | 1 | 1 | 0.01% | 0.02% | 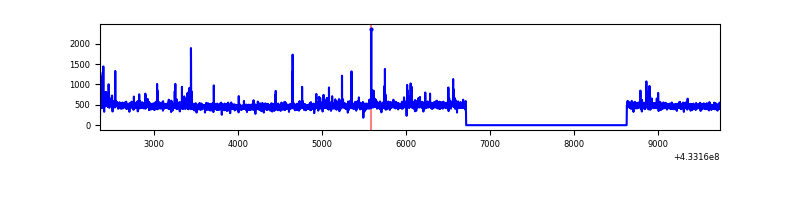 |
| D | 7380 | 5468 | 157 | 157 | 2.13% | 2.87% | 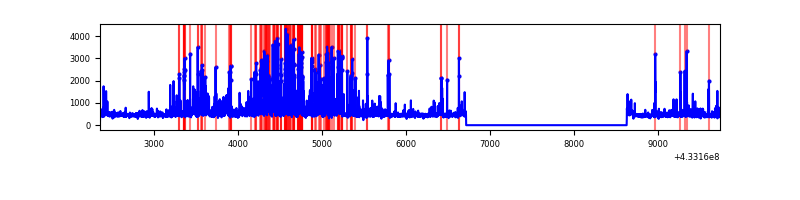 |
Top three noisy pixels from each quadrant. If the there are fewer than three noisy pixels in the level2.evt file, extra rows are filled as -1
| Pixel properties | Quadrant properties | ||||||
|---|---|---|---|---|---|---|---|
| Quadrant | DetID | PixID | Counts | Sigma | Mean | Median | Sigma |
| A | 15 | 222 | 1812939 | 16263.09 | 541 | 530 | 111.4 |
| A | 15 | 237 | 1039053 | 9318.86 | 541 | 530 | 111.4 |
| A | 10 | 83 | 539933 | 4840.17 | 541 | 530 | 111.4 |
| B | 0 | 186 | 1008011 | 8574.2 | 599 | 584 | 117.5 |
| B | 5 | 255 | 62899 | 530.36 | 599 | 584 | 117.5 |
| B | 5 | 172 | 58985 | 497.05 | 599 | 584 | 117.5 |
| C | 15 | 214 | 229300 | 1639.04 | 591 | 594 | 139.5 |
| C | 14 | 254 | 69093 | 490.9 | 591 | 594 | 139.5 |
| C | 4 | 254 | 12950 | 88.55 | 591 | 594 | 139.5 |
| D | 1 | 52 | 990463 | 6641.94 | 592 | 575 | 149.0 |
| D | 13 | 84 | 114298 | 763.06 | 592 | 575 | 149.0 |
| D | 7 | 96 | 42141 | 278.9 | 592 | 575 | 149.0 |
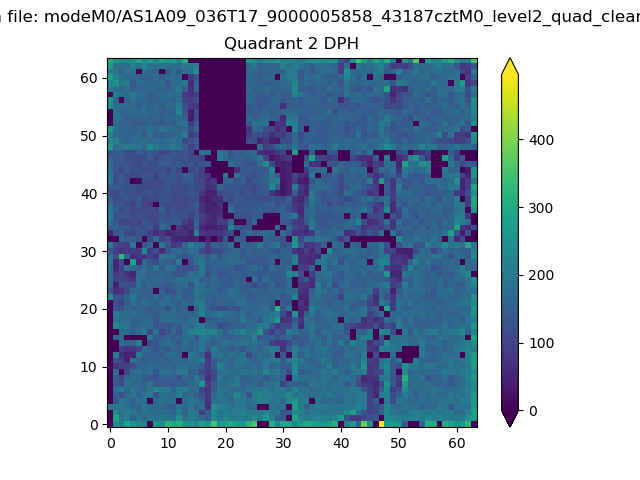
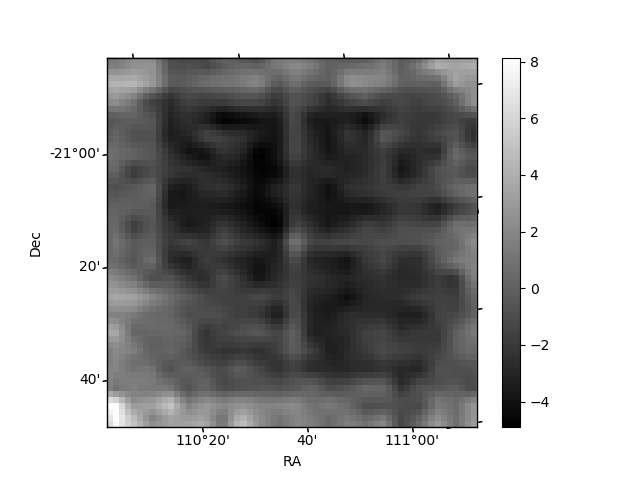
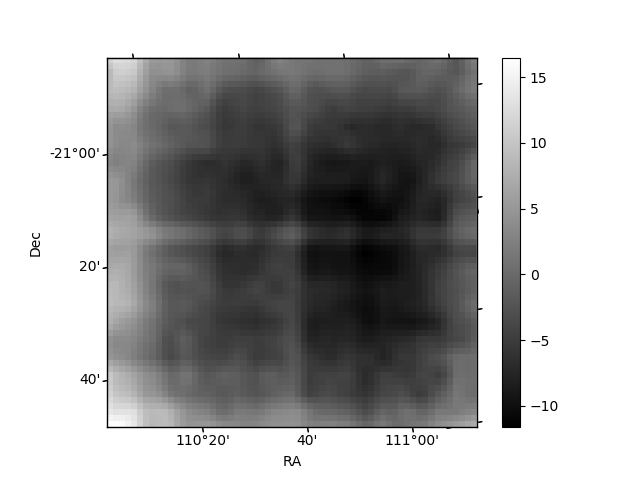
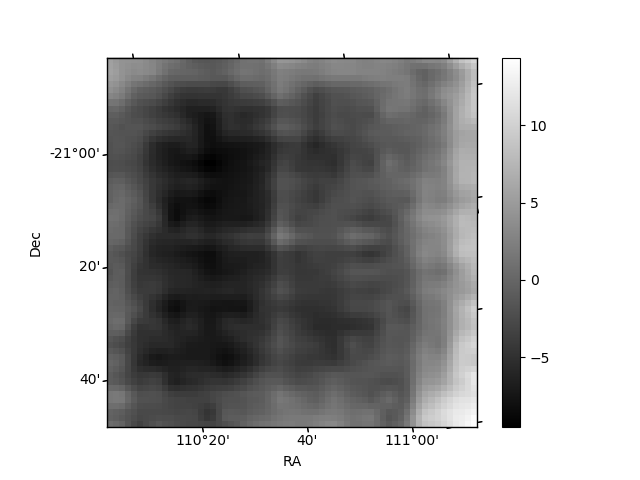
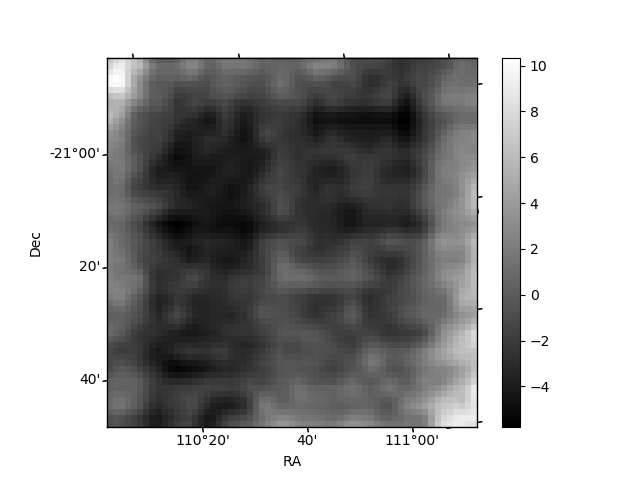
Histogram calculated using DETX and DETY for each event in the final _common_clean file
| Quadrant A | 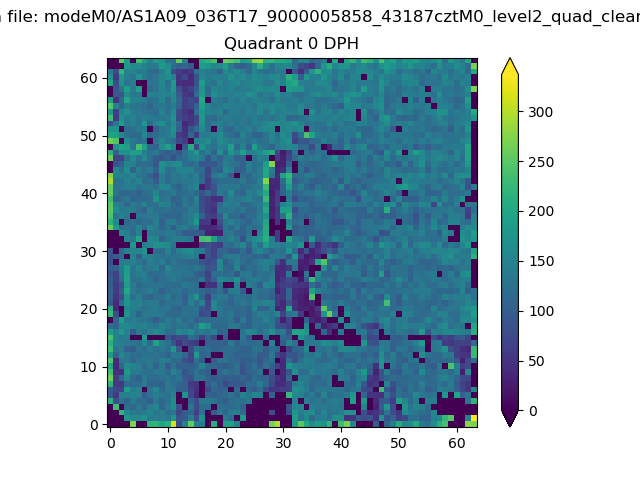 |
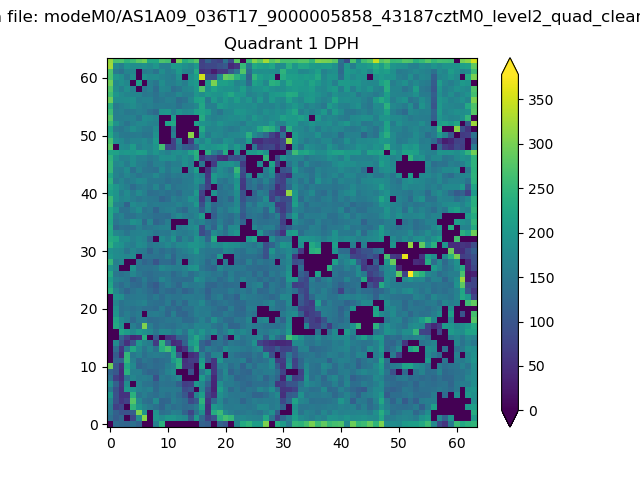 |
Quadrant B |
|---|---|---|---|
| Quadrant D | 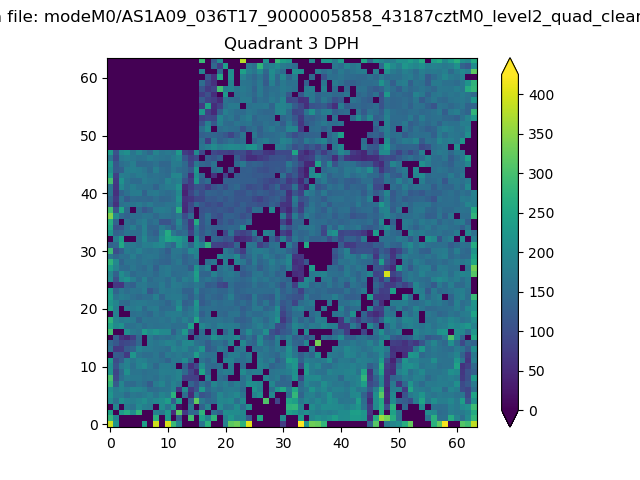 |
 |
Quadrant C |
| Plot type | Count rate plots | Images |
|---|---|---|
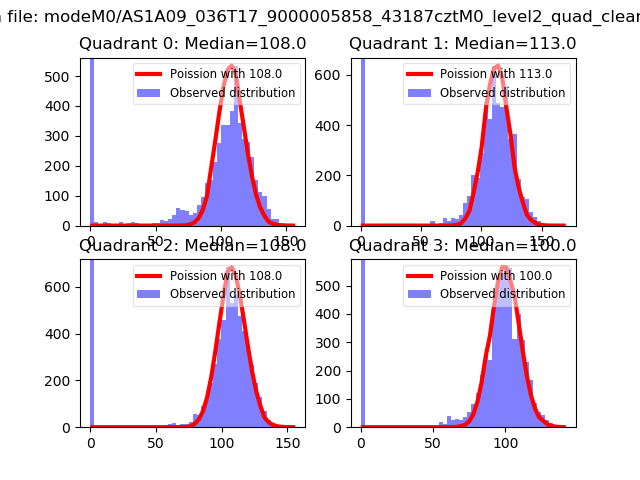
| Comparison with Poisson distribution Blue bars denote a histogram of data divided into 1 sec bins. Red curve is a Poisson curve with rate = median count rate of data. |
 |
 |
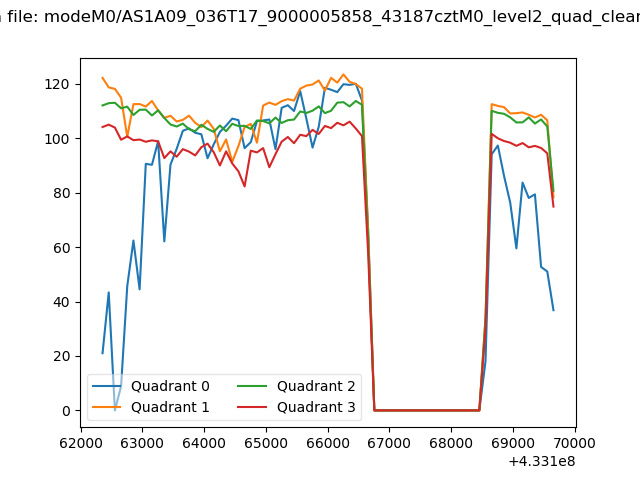
| Quadrant-wise count rates Data is divided into 100 sec bins |
 |
|
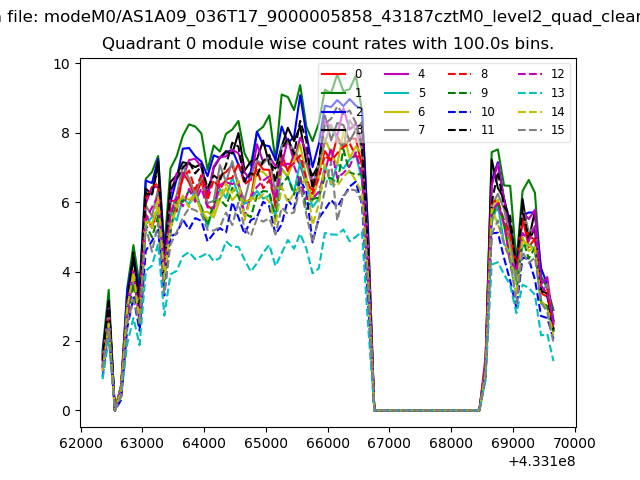
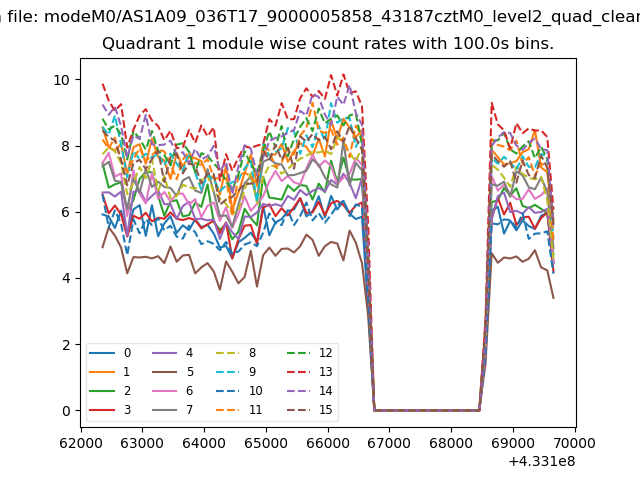
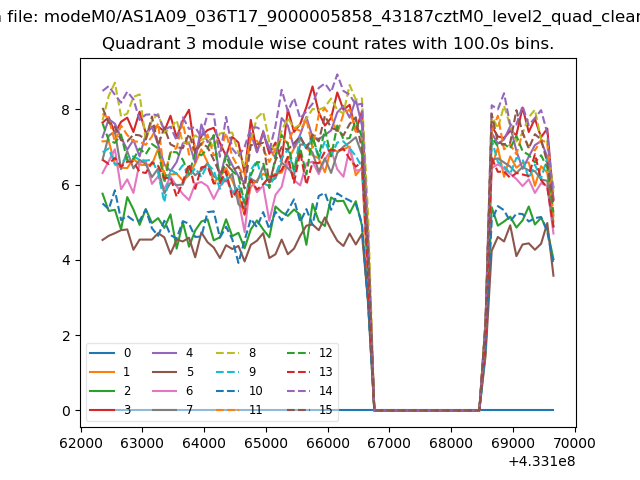
| Module-wise count rates for Quadrant A Data is divided into 100 sec bins |
 |
 |
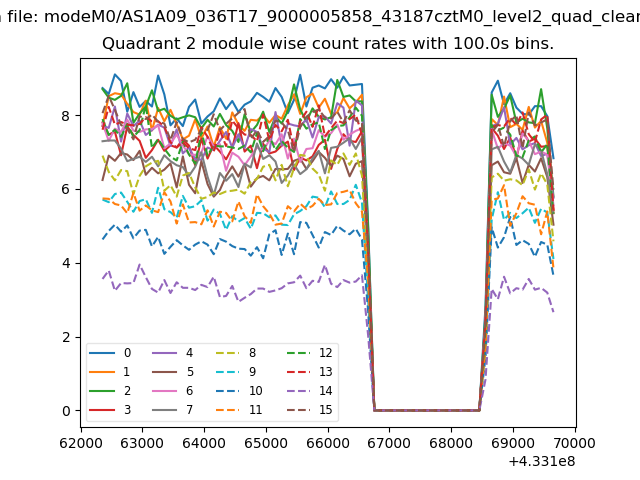
| Module-wise count rates for Quadrant B Data is divided into 100 sec bins |
 |
 |
| Module-wise count rates for Quadrant C Data is divided into 100 sec bins |
 |
 |
| Module-wise count rates for Quadrant D Data is divided into 100 sec bins |
 |
 |
| Parameter | Plot |
|---|---|
| CZT HV Monitor |  |
| D_VDD | 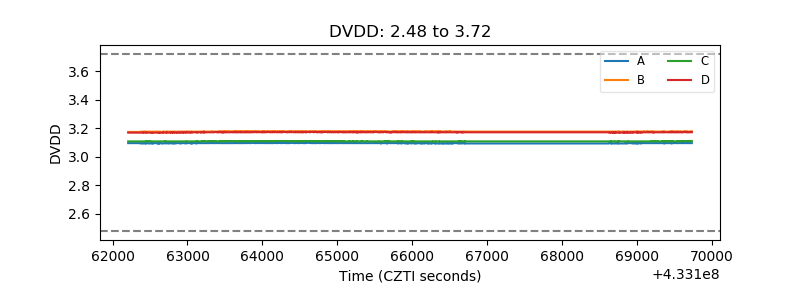 |
| Temperature 1 | 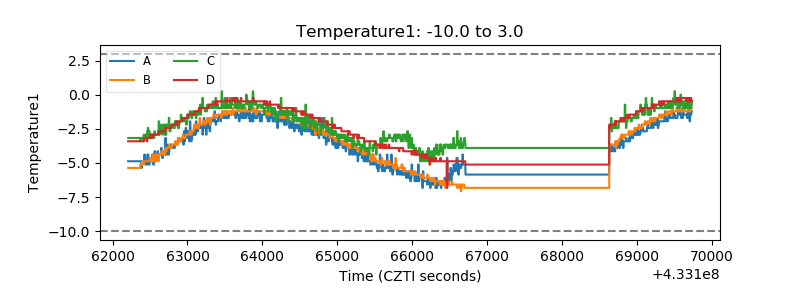 |
| Veto HV Monitor |  |
| Veto LLD | 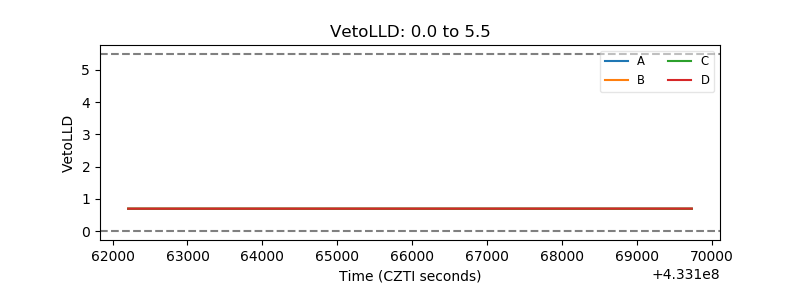 |
| Alpha Counter |  |
| _CPM_Rate |  |
| CZT Counter | 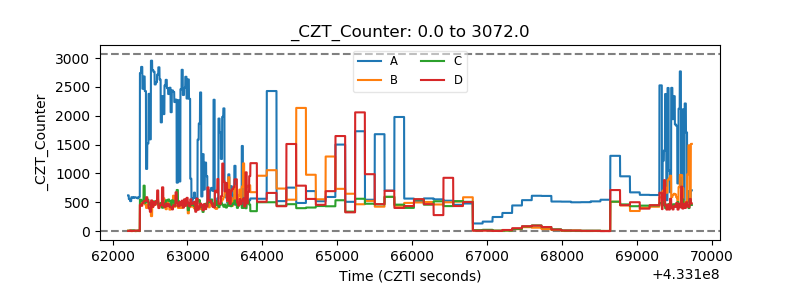 |
| +2.5 Volts monitor | 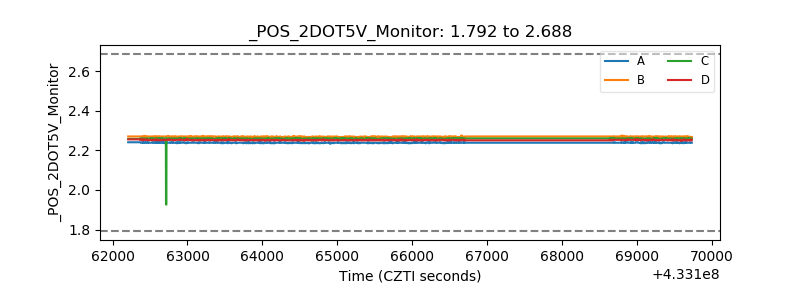 |
| +5 Volts monitor |  |
| _ROLL_ROT | 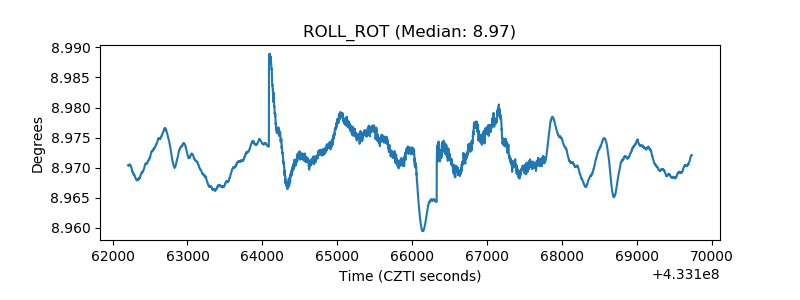 |
| _Roll_DEC | 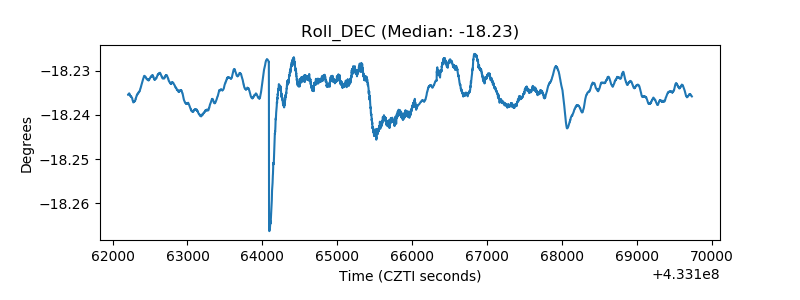 |
| _Roll_RA | 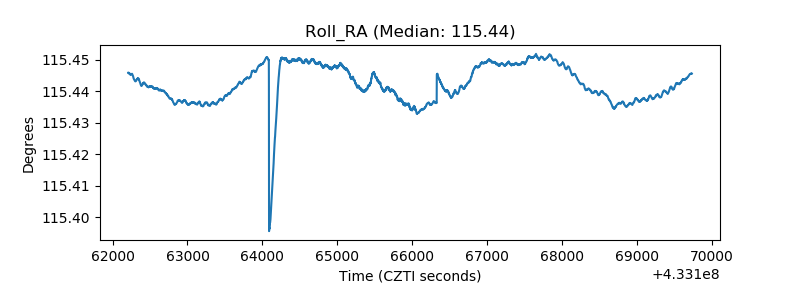 |
| Veto Counter | 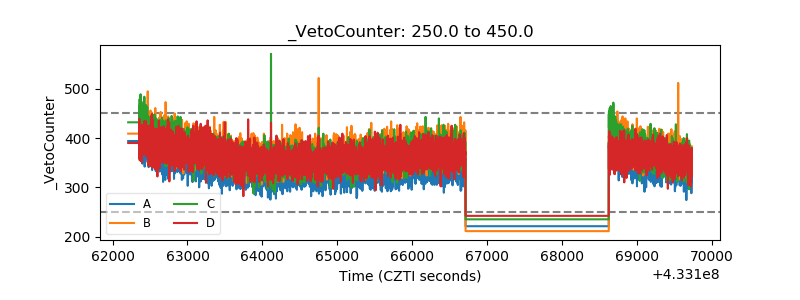 |