| Param | Original file | Final file |
|---|---|---|
| Filename | modeM0/AS1A09_036T17_9000005858_43188cztM0_level2.fits | modeM0/AS1A09_036T17_9000005858_43188cztM0_level2_quad_clean.evt |
| Size (bytes) | 444,055,680 | 87,258,240 |
| Size | 423.5 MB | 83.2 MB |
| Events in quadrant A | 6,901,247 | 457,951 |
| Events in quadrant B | 3,320,325 | 628,616 |
| Events in quadrant C | 2,652,200 | 603,469 |
| Events in quadrant D | 3,120,039 | 552,948 |
| Mode M0 | |||
|---|---|---|---|
| Quadrant | BADHDUFLAG | Total packets | Discarded packets |
| A | 0 | 24355 | 2 |
| B | 0 | 13774 | 2 |
| C | 0 | 11485 | 2 |
| D | 0 | 13229 | 2 |
| Mode SS | |||
|---|---|---|---|
| Quadrant | BADHDUFLAG | Total packets | Discarded packets |
| A | 0 | 118 | 0 |
| B | 0 | 118 | 0 |
| C | 0 | 118 | 0 |
| D | 0 | 118 | 0 |
| Mode M9 | |||
|---|---|---|---|
| Quadrant | BADHDUFLAG | Total packets | Discarded packets |
| A | 0 | 18 | 0 |
| B | 0 | 19 | 0 |
| C | 0 | 19 | 0 |
| D | 0 | 19 | 0 |
| Quadrant | Total seconds | Saturated seconds | Saturation percentage |
|---|---|---|---|
| A | 5698 | 1718 | 30.150930% |
| B | 5698 | 50 | 0.877501% |
| C | 5698 | 8 | 0.140400% |
| D | 5698 | 98 | 1.719902% |
Noise dominated data is calculated using 1-second bins in cleaned event files. If a bin has >2000 counts, and if more than 50% of those come from <1% of pixels, then it is considered to be noise-dominated and hence unusable.
| Quadrant | # 1 sec bins | Bins with >0 counts | Bins with >2000 counts | High rate bins dominated by noise | Noise dominated (total time) | Noise dominated (detector-on time) | Marked lightcurve |
|---|---|---|---|---|---|---|---|
| A | 7281 | 5699 | 1148 | 1148 | 15.77% | 20.14% | 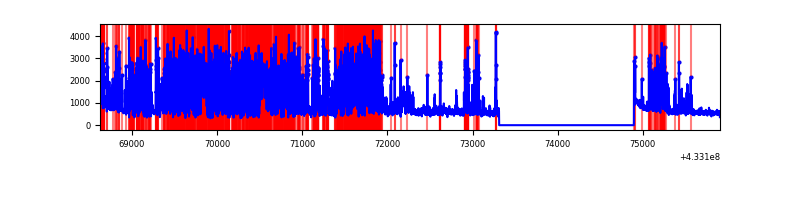 |
| B | 7281 | 5699 | 21 | 21 | 0.29% | 0.37% | 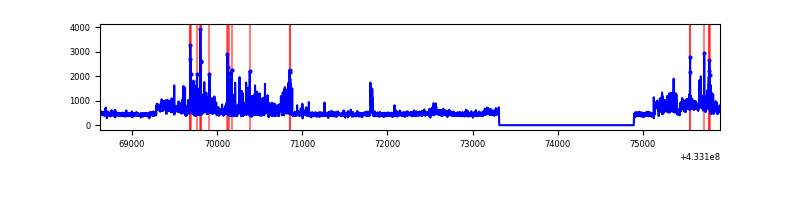 |
| C | 7281 | 5699 | 3 | 3 | 0.04% | 0.05% | 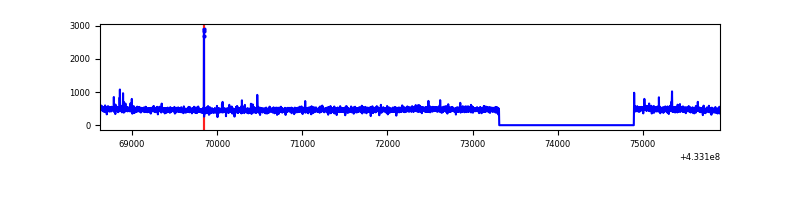 |
| D | 7281 | 5699 | 98 | 98 | 1.35% | 1.72% | 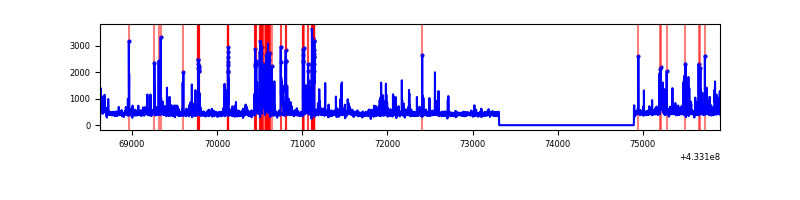 |
Top three noisy pixels from each quadrant. If the there are fewer than three noisy pixels in the level2.evt file, extra rows are filled as -1
| Pixel properties | Quadrant properties | ||||||
|---|---|---|---|---|---|---|---|
| Quadrant | DetID | PixID | Counts | Sigma | Mean | Median | Sigma |
| A | 15 | 222 | 3277926 | 29894.51 | 529 | 518 | 109.6 |
| A | 15 | 237 | 645993 | 5887.63 | 529 | 518 | 109.6 |
| A | 10 | 83 | 558644 | 5090.88 | 529 | 518 | 109.6 |
| B | 0 | 186 | 677642 | 5591.62 | 622 | 605 | 121.1 |
| B | 0 | 189 | 104389 | 857.15 | 622 | 605 | 121.1 |
| B | 5 | 255 | 53829 | 439.57 | 622 | 605 | 121.1 |
| C | 15 | 214 | 237252 | 1641.86 | 611 | 612 | 144.1 |
| C | 14 | 254 | 13088 | 86.56 | 611 | 612 | 144.1 |
| C | 4 | 254 | 9255 | 59.97 | 611 | 612 | 144.1 |
| D | 1 | 52 | 504277 | 3295.49 | 612 | 594 | 152.8 |
| D | 12 | 233 | 99313 | 645.9 | 612 | 594 | 152.8 |
| D | 5 | 171 | 60234 | 390.21 | 612 | 594 | 152.8 |
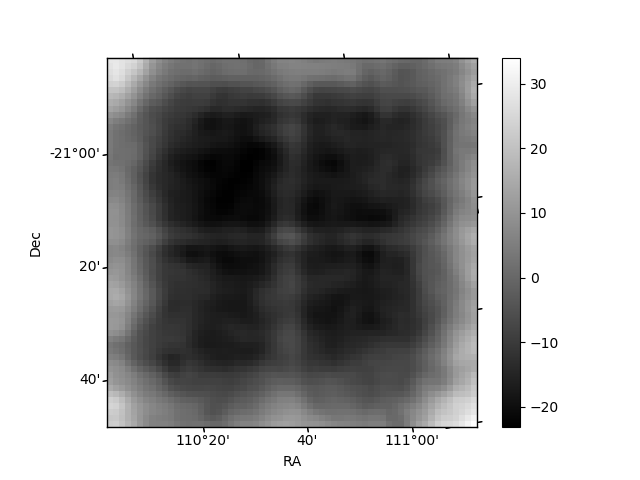
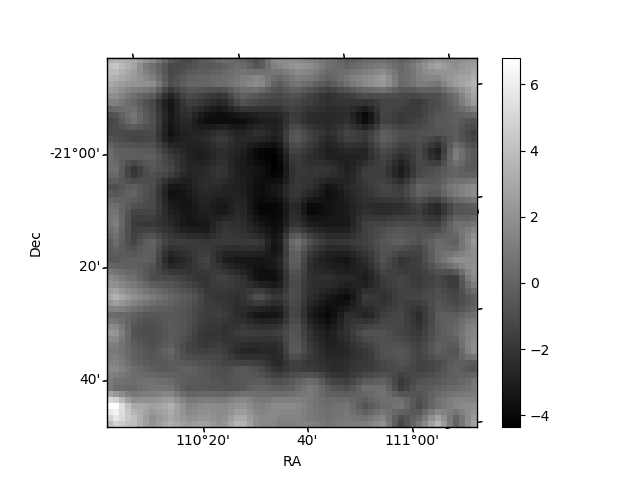
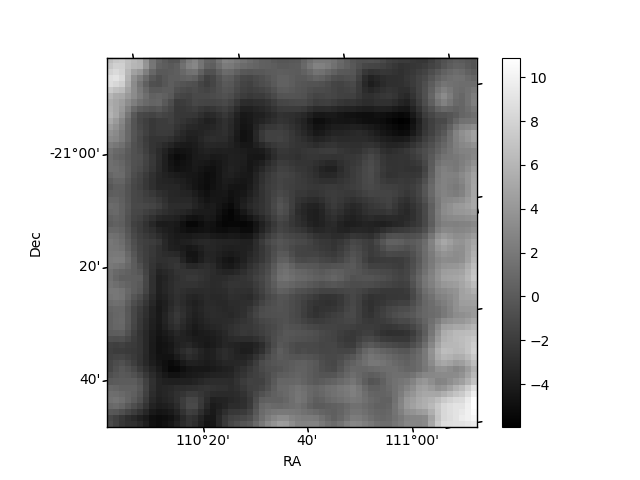
Histogram calculated using DETX and DETY for each event in the final _common_clean file
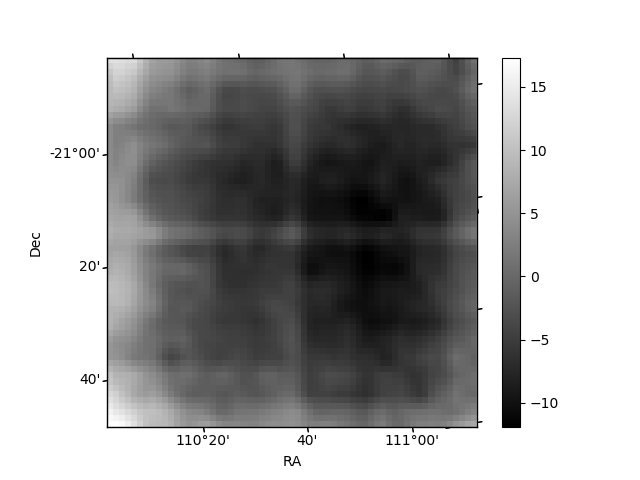
| Quadrant A | 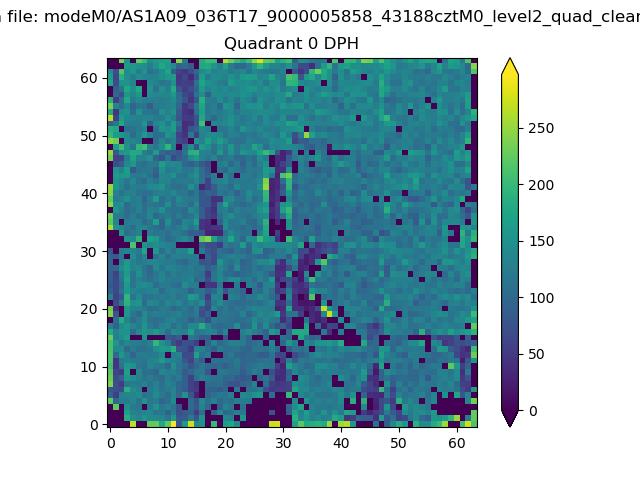 |
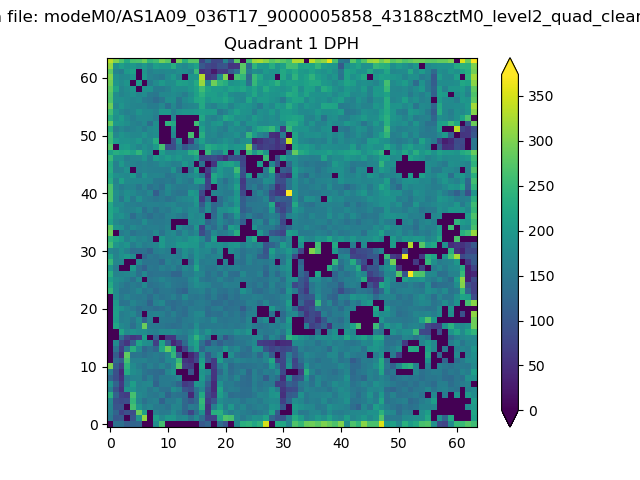 |
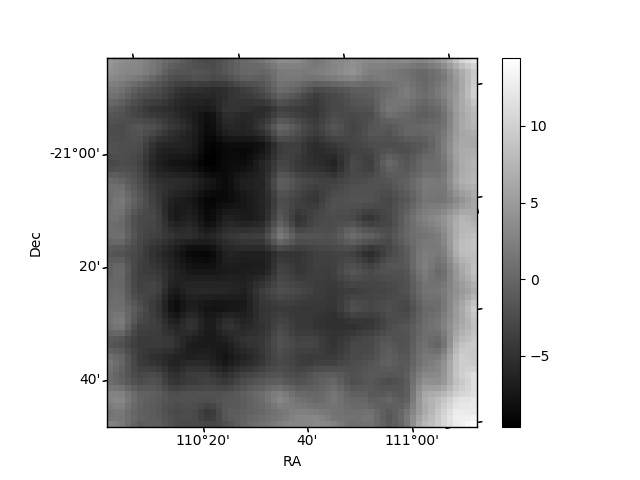
Quadrant B |
|---|---|---|---|
| Quadrant D | 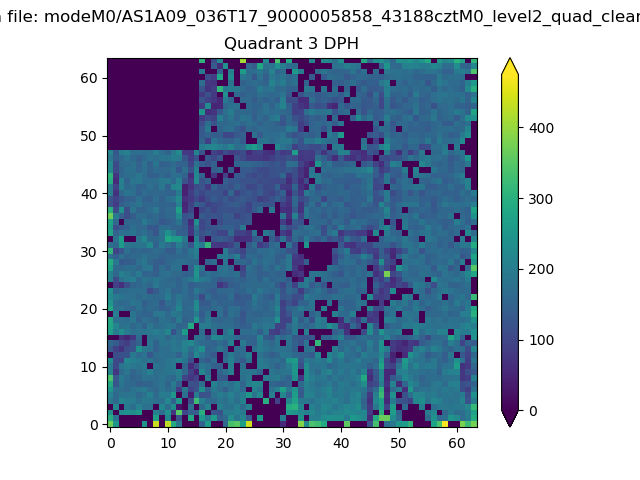 |
 |
Quadrant C |
| Plot type | Count rate plots | Images |
|---|---|---|
| Comparison with Poisson distribution Blue bars denote a histogram of data divided into 1 sec bins. Red curve is a Poisson curve with rate = median count rate of data. |
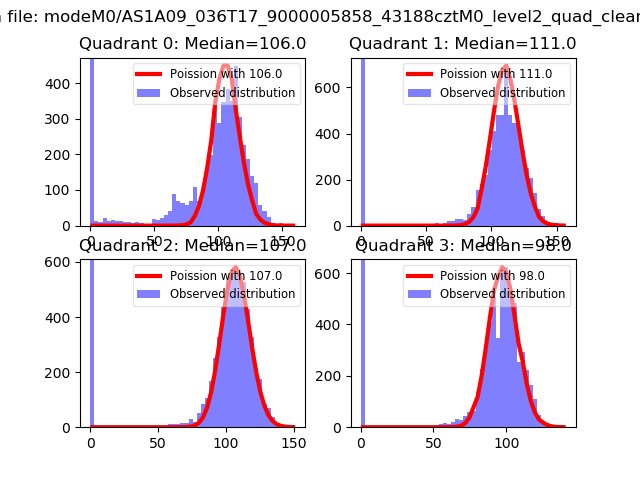 |
 |
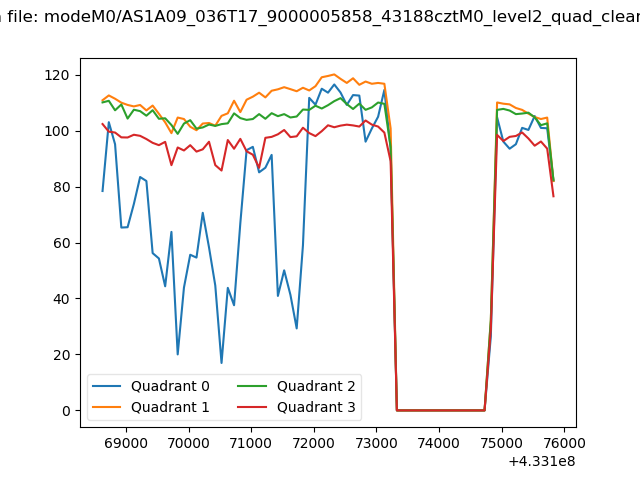
| Quadrant-wise count rates Data is divided into 100 sec bins |
 |
|
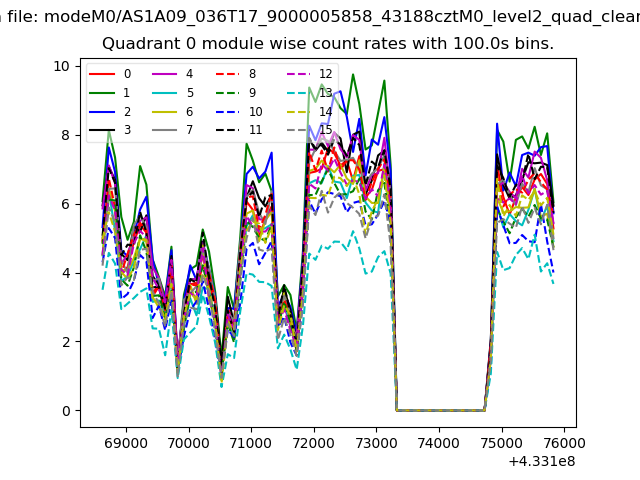
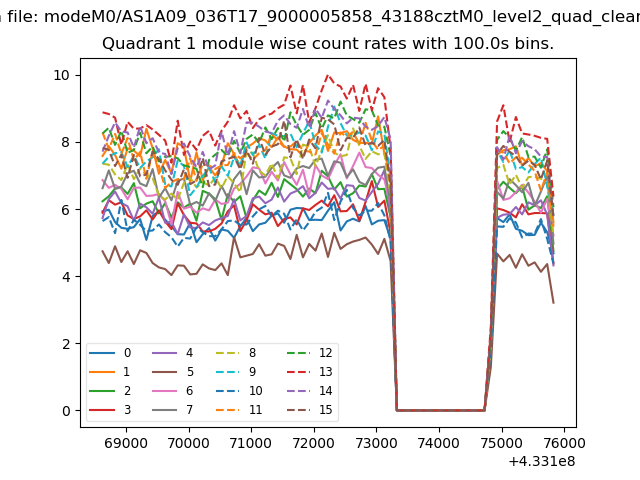
| Module-wise count rates for Quadrant A Data is divided into 100 sec bins |
 |
 |
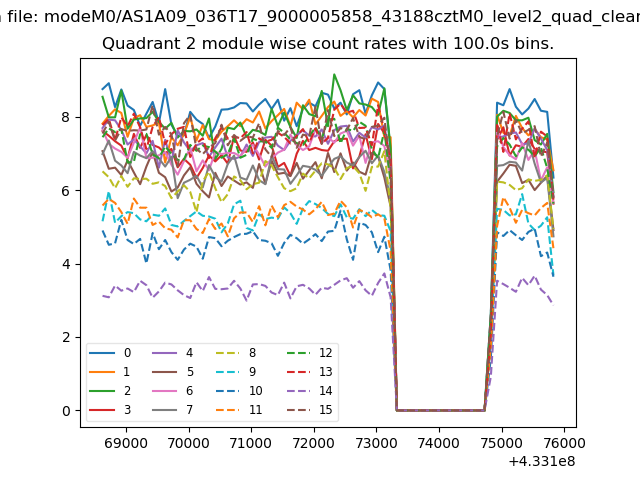
| Module-wise count rates for Quadrant B Data is divided into 100 sec bins |
 |
 |
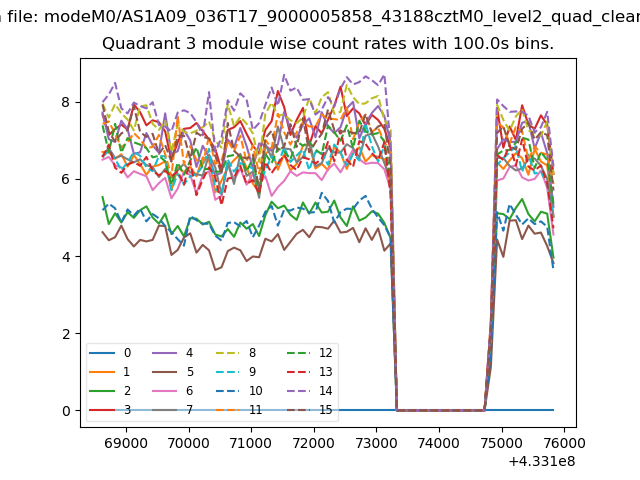
| Module-wise count rates for Quadrant C Data is divided into 100 sec bins |
 |
 |
| Module-wise count rates for Quadrant D Data is divided into 100 sec bins |
 |
 |
| Parameter | Plot |
|---|---|
| CZT HV Monitor | 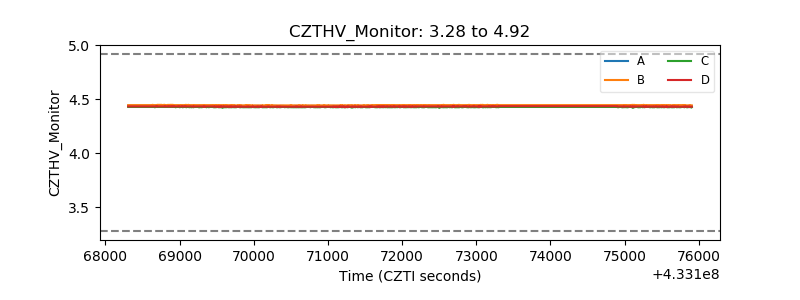 |
| D_VDD | 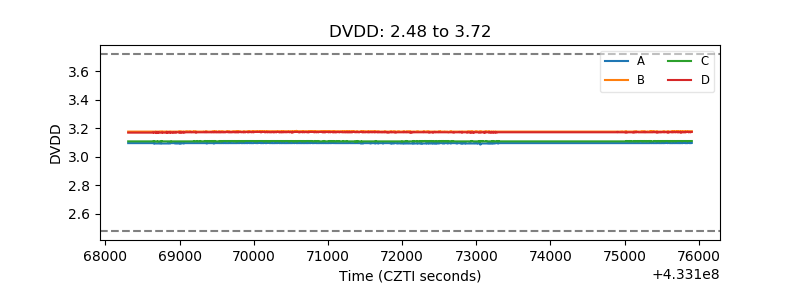 |
| Temperature 1 | 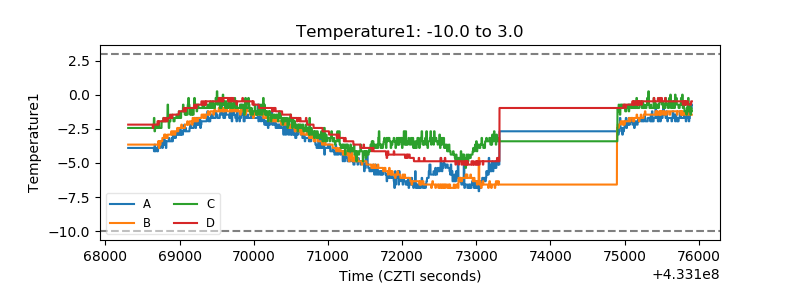 |
| Veto HV Monitor | 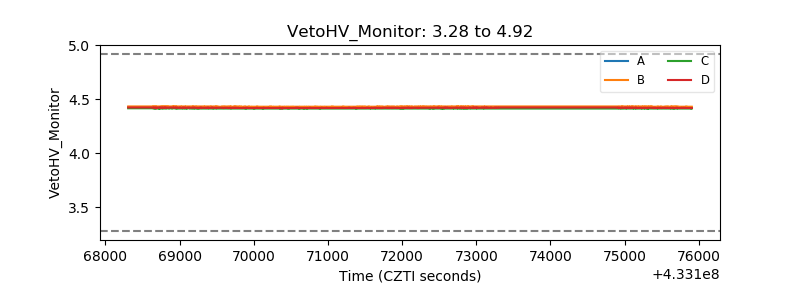 |
| Veto LLD | 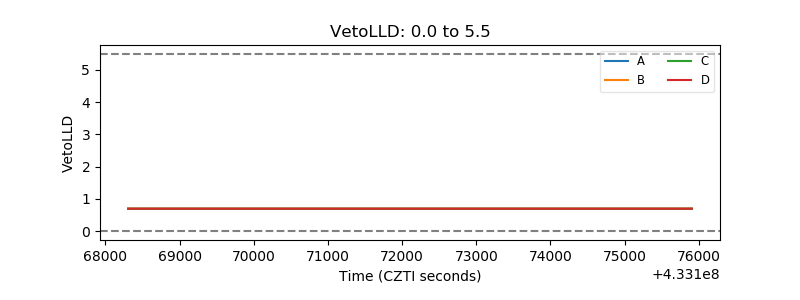 |
| Alpha Counter | 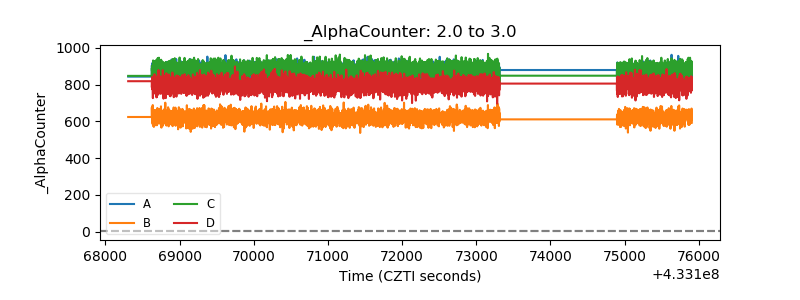 |
| _CPM_Rate | 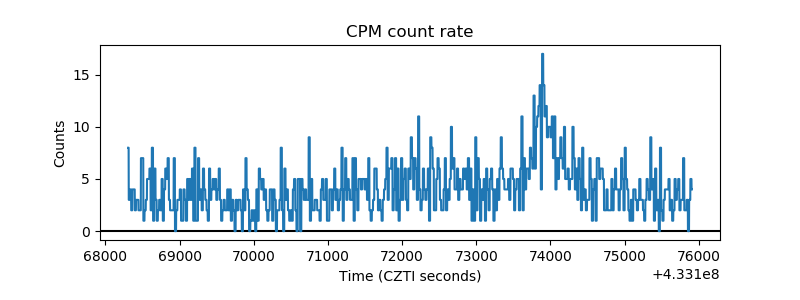 |
| CZT Counter | 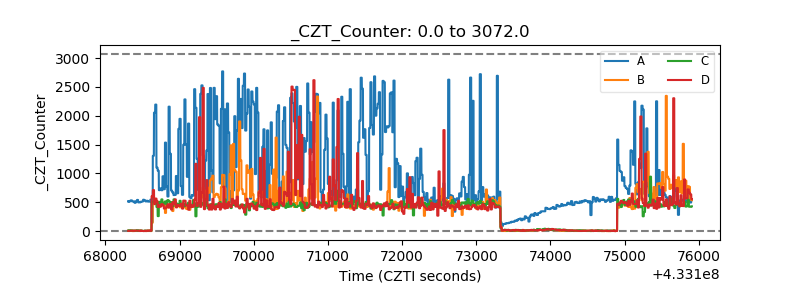 |
| +2.5 Volts monitor |  |
| +5 Volts monitor |  |
| _ROLL_ROT | 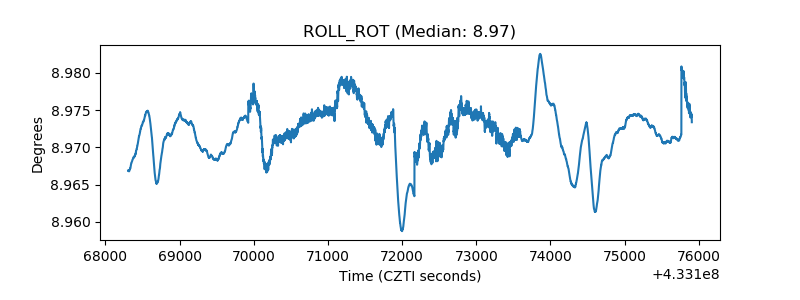 |
| _Roll_DEC |  |
| _Roll_RA | 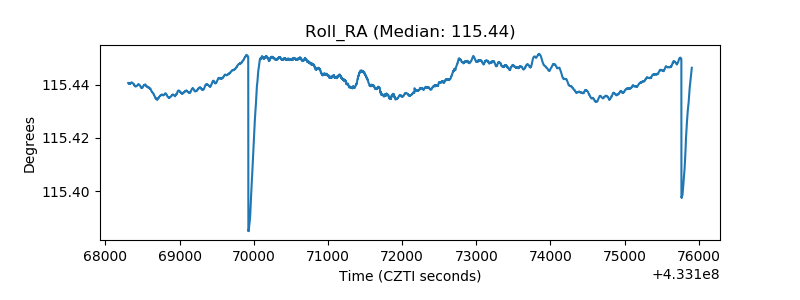 |
| Veto Counter | 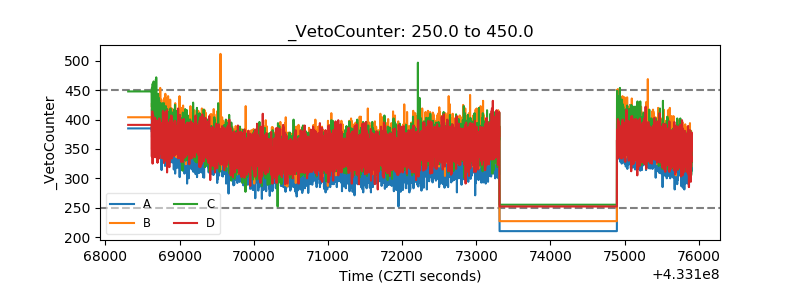 |