| Param | Original file | Final file |
|---|---|---|
| Filename | modeM0/AS1A09_036T17_9000005858_43190cztM0_level2.fits | modeM0/AS1A09_036T17_9000005858_43190cztM0_level2_quad_clean.evt |
| Size (bytes) | 441,843,840 | 93,432,960 |
| Size | 421.4 MB | 89.1 MB |
| Events in quadrant A | 4,768,763 | 616,818 |
| Events in quadrant B | 4,061,940 | 630,280 |
| Events in quadrant C | 2,843,543 | 616,004 |
| Events in quadrant D | 4,224,701 | 554,443 |
| Mode M0 | |||
|---|---|---|---|
| Quadrant | BADHDUFLAG | Total packets | Discarded packets |
| A | 0 | 18317 | 2 |
| B | 0 | 16166 | 2 |
| C | 0 | 12200 | 2 |
| D | 0 | 16648 | 2 |
| Mode SS | |||
|---|---|---|---|
| Quadrant | BADHDUFLAG | Total packets | Discarded packets |
| A | 0 | 122 | 0 |
| B | 0 | 122 | 0 |
| C | 0 | 122 | 0 |
| D | 0 | 122 | 0 |
| Mode M9 | |||
|---|---|---|---|
| Quadrant | BADHDUFLAG | Total packets | Discarded packets |
| A | 0 | 16 | 0 |
| B | 0 | 17 | 0 |
| C | 0 | 17 | 0 |
| D | 0 | 17 | 0 |
| Quadrant | Total seconds | Saturated seconds | Saturation percentage |
|---|---|---|---|
| A | 5881 | 269 | 4.574052% |
| B | 5881 | 272 | 4.625064% |
| C | 5881 | 32 | 0.544125% |
| D | 5881 | 293 | 4.982146% |
Noise dominated data is calculated using 1-second bins in cleaned event files. If a bin has >2000 counts, and if more than 50% of those come from <1% of pixels, then it is considered to be noise-dominated and hence unusable.
| Quadrant | # 1 sec bins | Bins with >0 counts | Bins with >2000 counts | High rate bins dominated by noise | Noise dominated (total time) | Noise dominated (detector-on time) | Marked lightcurve |
|---|---|---|---|---|---|---|---|
| A | 7163 | 5882 | 180 | 180 | 2.51% | 3.06% | 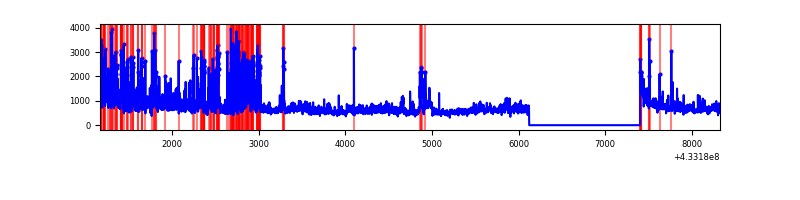 |
| B | 7163 | 5882 | 130 | 130 | 1.81% | 2.21% | 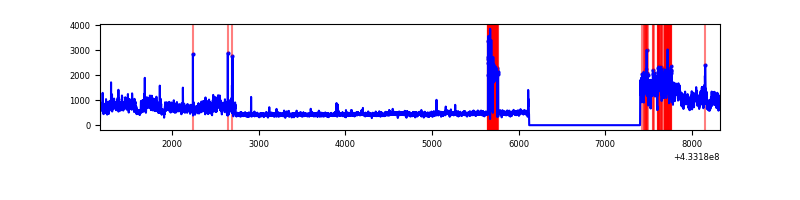 |
| C | 7163 | 5882 | 20 | 20 | 0.28% | 0.34% | 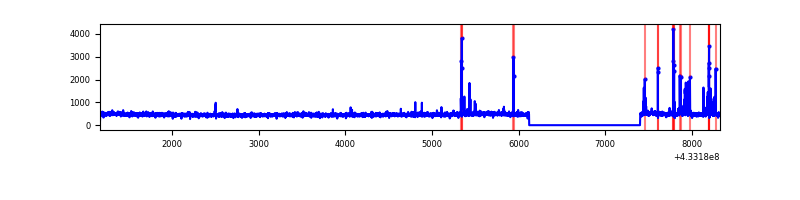 |
| D | 7163 | 5882 | 284 | 284 | 3.96% | 4.83% | 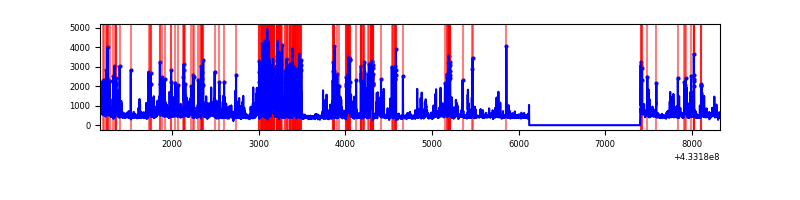 |
Top three noisy pixels from each quadrant. If the there are fewer than three noisy pixels in the level2.evt file, extra rows are filled as -1
| Pixel properties | Quadrant properties | ||||||
|---|---|---|---|---|---|---|---|
| Quadrant | DetID | PixID | Counts | Sigma | Mean | Median | Sigma |
| A | 15 | 222 | 731878 | 5484.74 | 636 | 621 | 133.3 |
| A | 10 | 83 | 649750 | 4868.74 | 636 | 621 | 133.3 |
| A | 12 | 189 | 411690 | 3083.19 | 636 | 621 | 133.3 |
| B | 0 | 186 | 1056118 | 8653.13 | 630 | 613 | 122.0 |
| B | 0 | 229 | 346571 | 2836.2 | 630 | 613 | 122.0 |
| B | 0 | 189 | 118778 | 968.73 | 630 | 613 | 122.0 |
| C | 15 | 214 | 243996 | 1657.24 | 626 | 631 | 146.8 |
| C | 14 | 254 | 137929 | 934.96 | 626 | 631 | 146.8 |
| C | 4 | 254 | 10284 | 65.73 | 626 | 631 | 146.8 |
| D | 1 | 52 | 1633680 | 10626.78 | 618 | 598 | 153.7 |
| D | 12 | 6 | 113672 | 735.79 | 618 | 598 | 153.7 |
| D | 5 | 171 | 54847 | 353.01 | 618 | 598 | 153.7 |
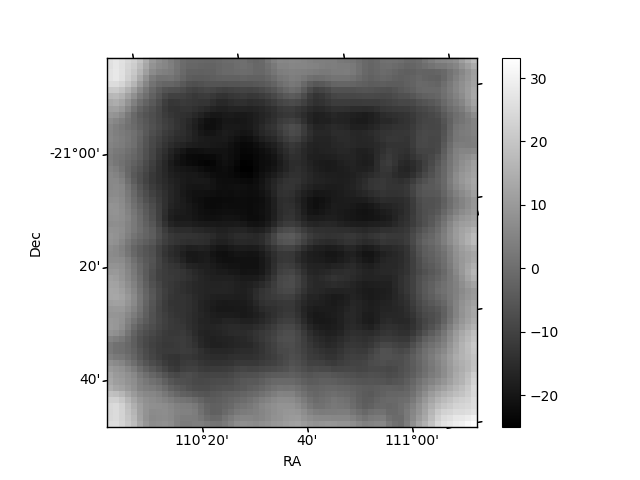
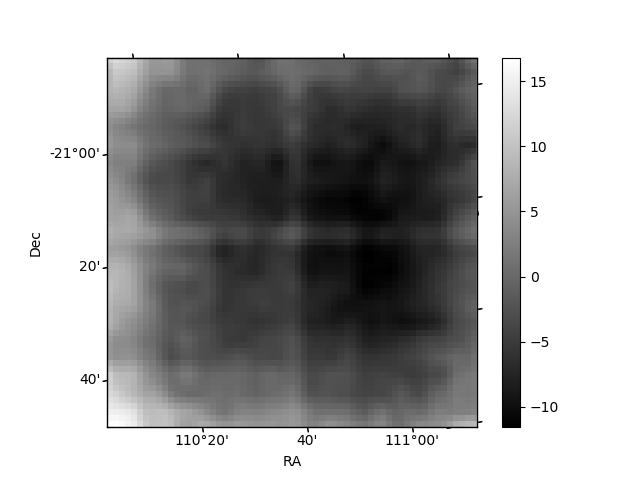
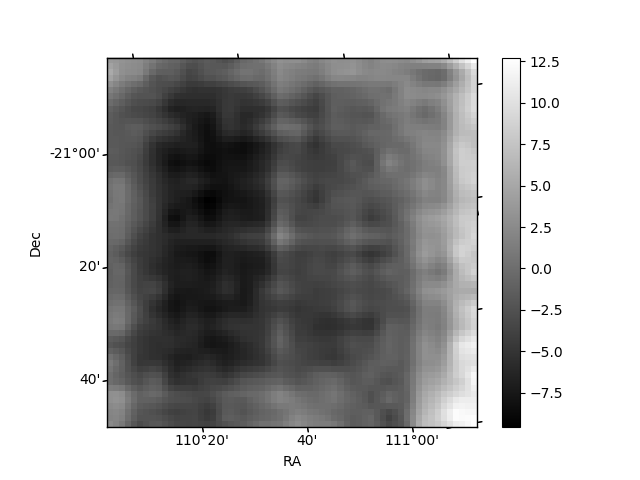
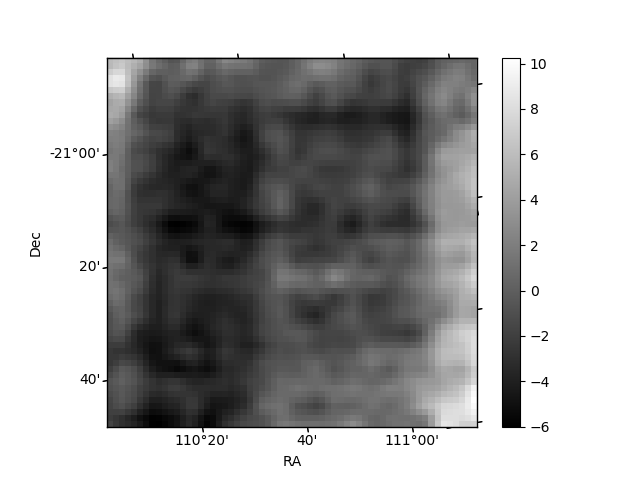
Histogram calculated using DETX and DETY for each event in the final _common_clean file
| Quadrant A | 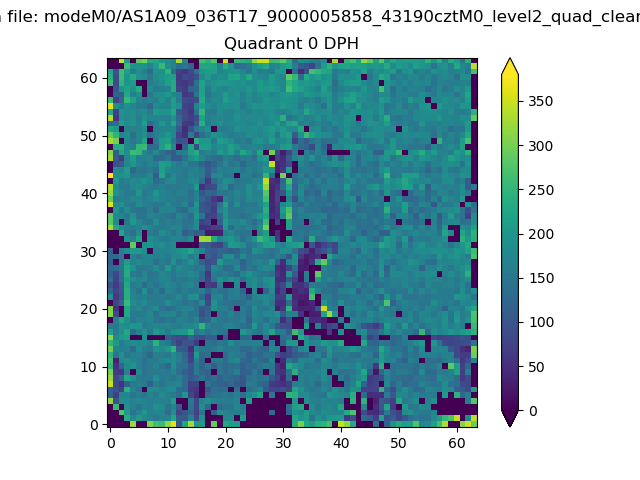 |
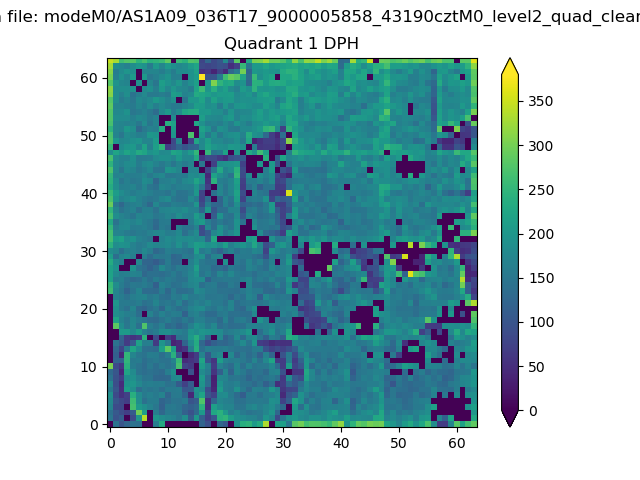 |
Quadrant B |
|---|---|---|---|
| Quadrant D | 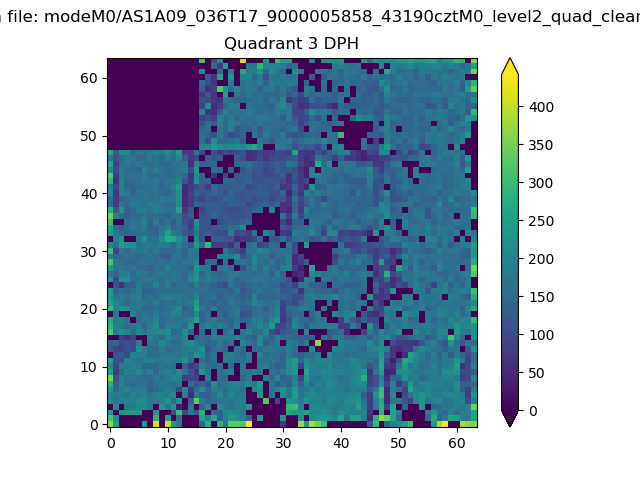 |
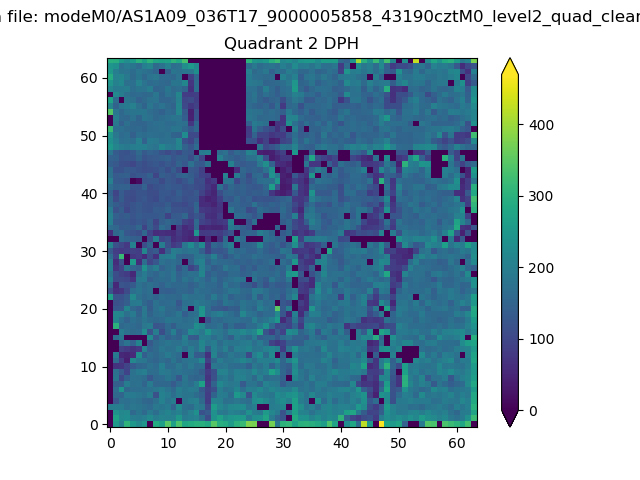 |
Quadrant C |
| Plot type | Count rate plots | Images |
|---|---|---|
| Comparison with Poisson distribution Blue bars denote a histogram of data divided into 1 sec bins. Red curve is a Poisson curve with rate = median count rate of data. |
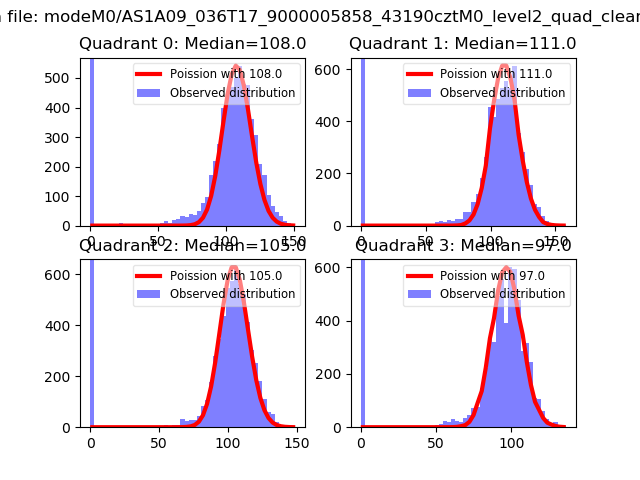 |
 |
| Quadrant-wise count rates Data is divided into 100 sec bins |
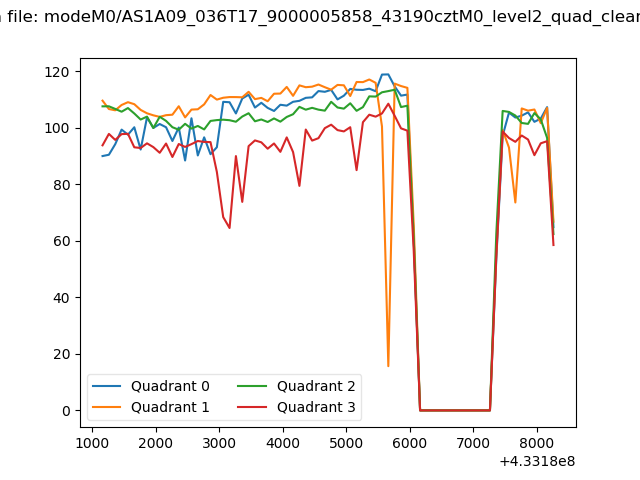 |
|
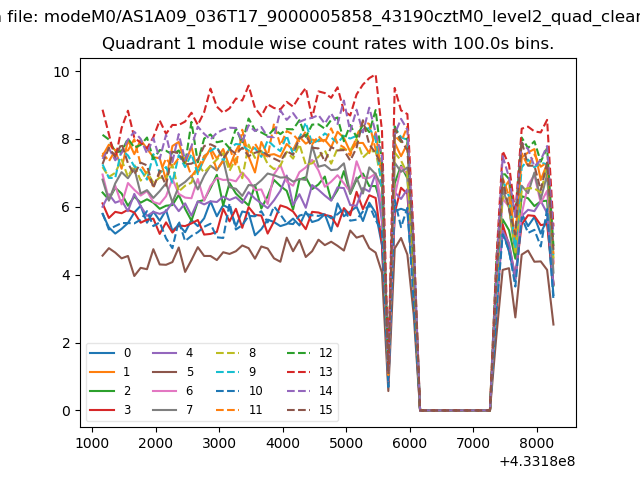
| Module-wise count rates for Quadrant A Data is divided into 100 sec bins |
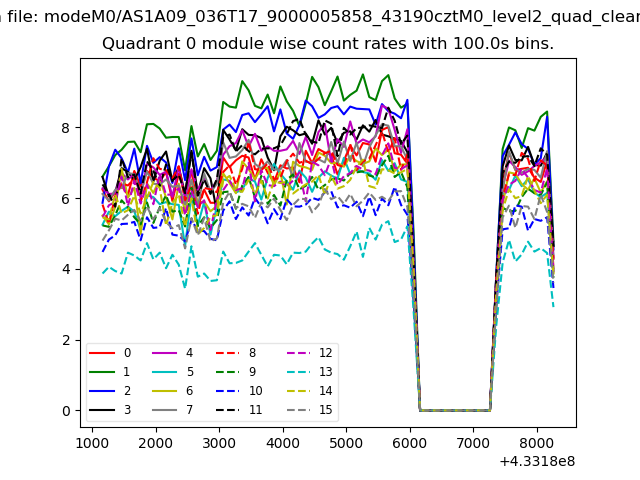 |
 |
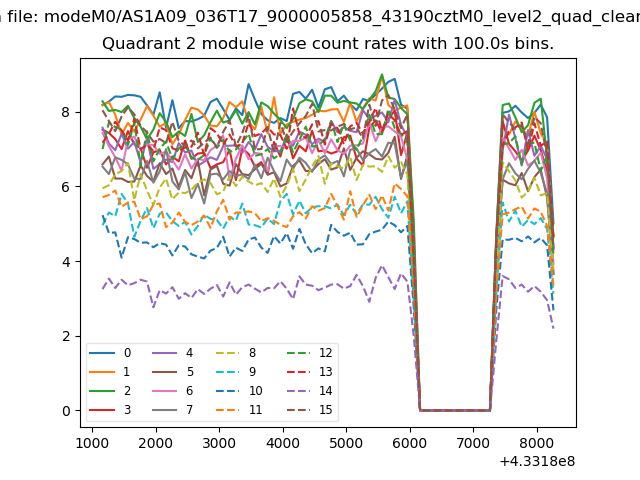
| Module-wise count rates for Quadrant B Data is divided into 100 sec bins |
 |
 |
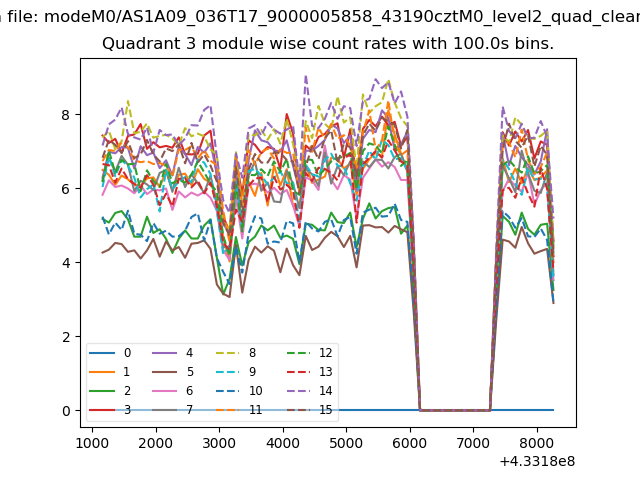
| Module-wise count rates for Quadrant C Data is divided into 100 sec bins |
 |
 |
| Module-wise count rates for Quadrant D Data is divided into 100 sec bins |
 |
 |
| Parameter | Plot |
|---|---|
| CZT HV Monitor | 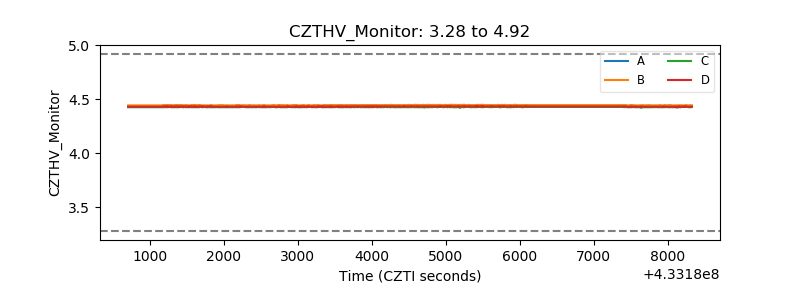 |
| D_VDD | 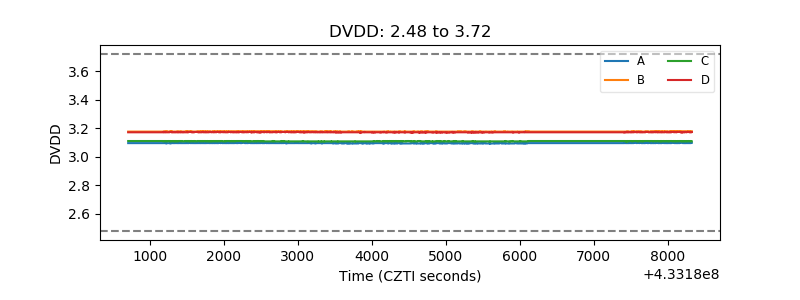 |
| Temperature 1 | 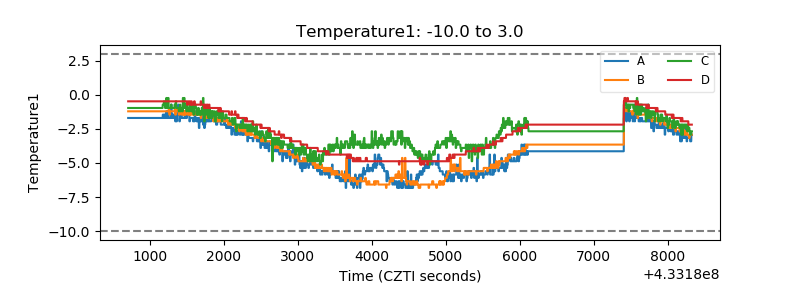 |
| Veto HV Monitor |  |
| Veto LLD | 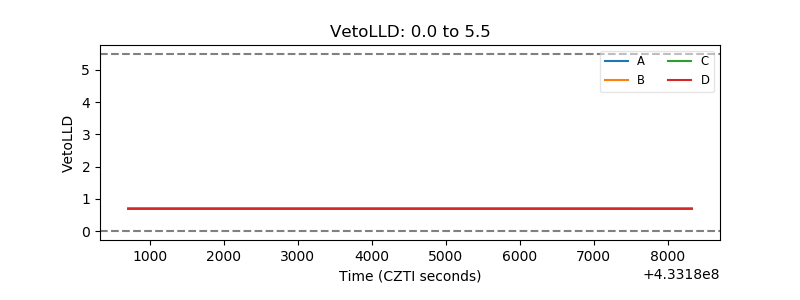 |
| Alpha Counter | 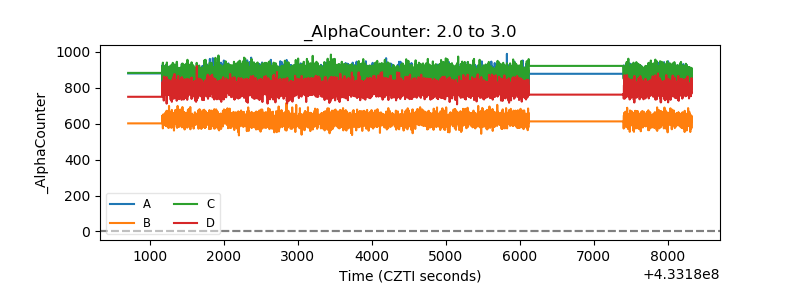 |
| _CPM_Rate | 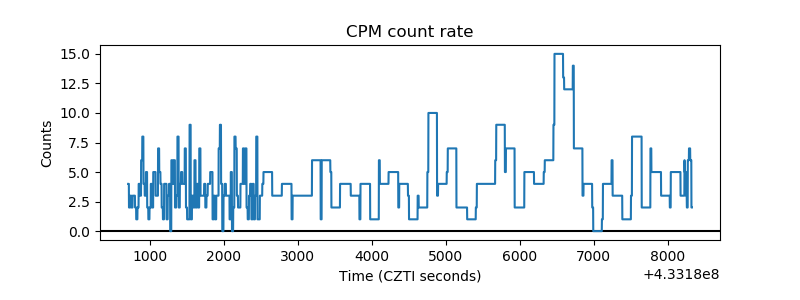 |
| CZT Counter | 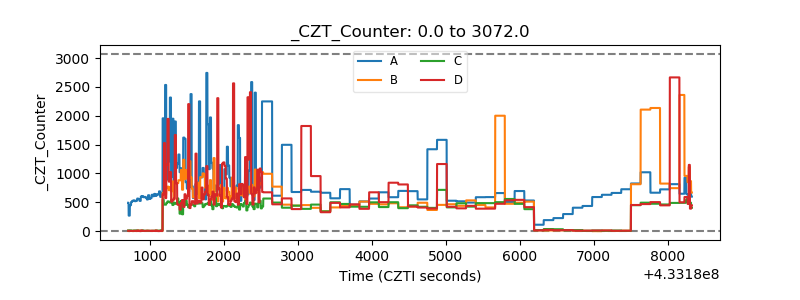 |
| +2.5 Volts monitor | 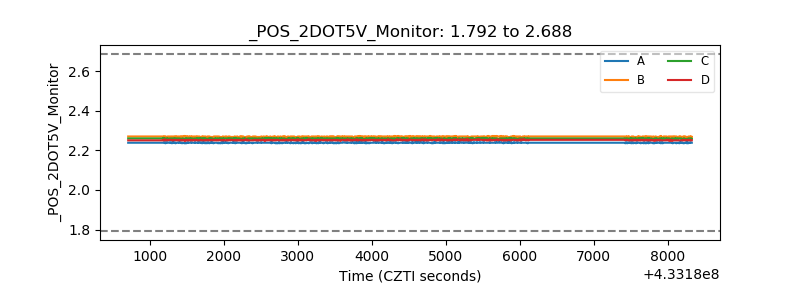 |
| +5 Volts monitor | 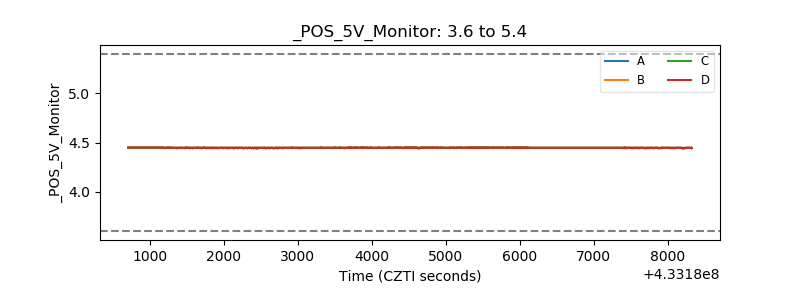 |
| _ROLL_ROT | 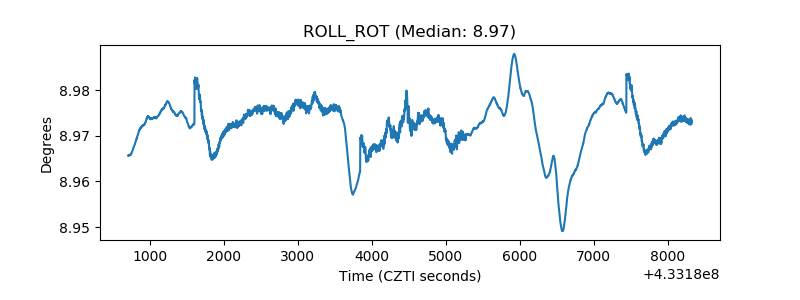 |
| _Roll_DEC |  |
| _Roll_RA | 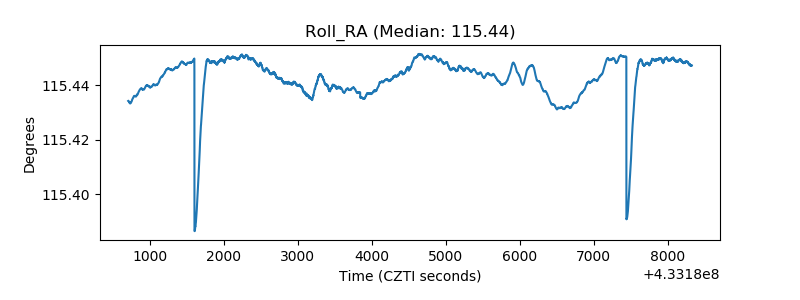 |
| Veto Counter | 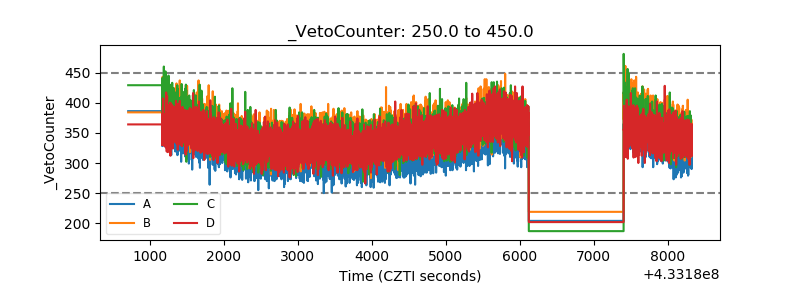 |