| Param | Original file | Final file |
|---|---|---|
| Filename | modeM0/AS1A09_036T17_9000005858_43192cztM0_level2.fits | modeM0/AS1A09_036T17_9000005858_43192cztM0_level2_quad_clean.evt |
| Size (bytes) | 530,697,600 | 124,240,320 |
| Size | 506.1 MB | 118.5 MB |
| Events in quadrant A | 6,055,416 | 813,921 |
| Events in quadrant B | 5,136,254 | 848,176 |
| Events in quadrant C | 3,880,842 | 808,909 |
| Events in quadrant D | 3,964,897 | 746,176 |
| Mode M0 | |||
|---|---|---|---|
| Quadrant | BADHDUFLAG | Total packets | Discarded packets |
| A | 0 | 23352 | 2 |
| B | 0 | 20636 | 2 |
| C | 0 | 16602 | 3 |
| D | 0 | 17557 | 2 |
| Mode SS | |||
|---|---|---|---|
| Quadrant | BADHDUFLAG | Total packets | Discarded packets |
| A | 0 | 160 | 0 |
| B | 0 | 160 | 0 |
| C | 0 | 160 | 0 |
| D | 0 | 160 | 0 |
| Mode M9 | |||
|---|---|---|---|
| Quadrant | BADHDUFLAG | Total packets | Discarded packets |
| A | 0 | 13 | 0 |
| B | 0 | 14 | 0 |
| C | 0 | 14 | 0 |
| D | 0 | 14 | 0 |
| Quadrant | Total seconds | Saturated seconds | Saturation percentage |
|---|---|---|---|
| A | 7828 | 300 | 3.832397% |
| B | 7828 | 203 | 2.593255% |
| C | 7827 | 46 | 0.587709% |
| D | 7827 | 97 | 1.239300% |
Noise dominated data is calculated using 1-second bins in cleaned event files. If a bin has >2000 counts, and if more than 50% of those come from <1% of pixels, then it is considered to be noise-dominated and hence unusable.
| Quadrant | # 1 sec bins | Bins with >0 counts | Bins with >2000 counts | High rate bins dominated by noise | Noise dominated (total time) | Noise dominated (detector-on time) | Marked lightcurve |
|---|---|---|---|---|---|---|---|
| A | 9170 | 7829 | 239 | 239 | 2.61% | 3.05% | 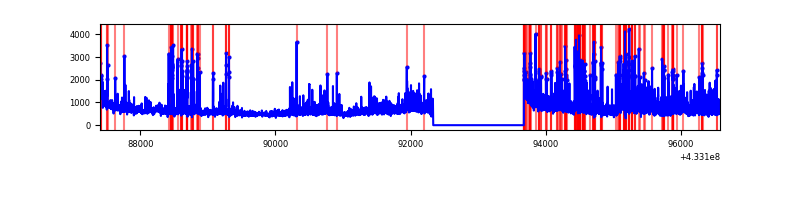 |
| B | 9170 | 7829 | 74 | 74 | 0.81% | 0.95% | 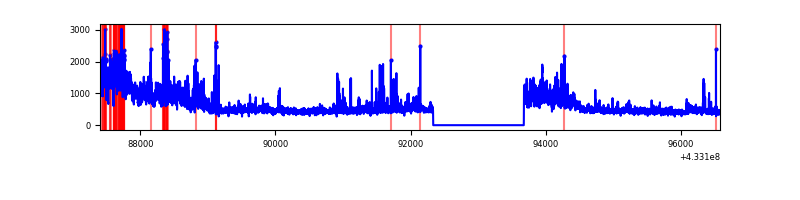 |
| C | 9169 | 7828 | 32 | 32 | 0.35% | 0.41% | 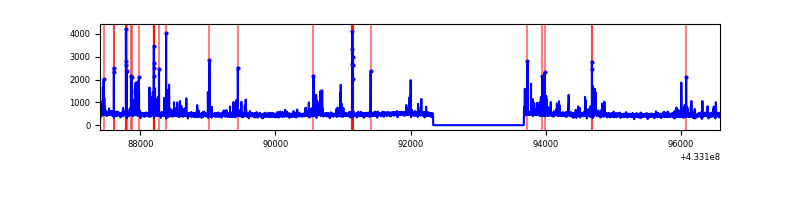 |
| D | 9169 | 7828 | 90 | 90 | 0.98% | 1.15% | 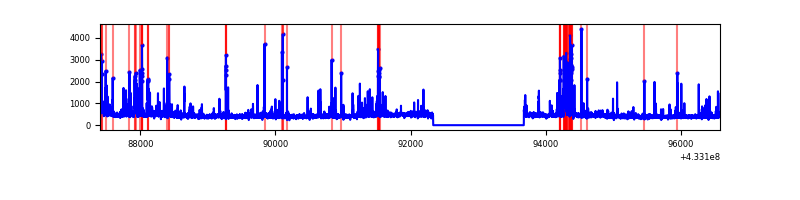 |
Top three noisy pixels from each quadrant. If the there are fewer than three noisy pixels in the level2.evt file, extra rows are filled as -1
| Pixel properties | Quadrant properties | ||||||
|---|---|---|---|---|---|---|---|
| Quadrant | DetID | PixID | Counts | Sigma | Mean | Median | Sigma |
| A | 15 | 222 | 1280063 | 7422.82 | 833 | 817 | 172.3 |
| A | 10 | 83 | 794369 | 4604.58 | 833 | 817 | 172.3 |
| A | 15 | 237 | 467393 | 2707.3 | 833 | 817 | 172.3 |
| B | 0 | 186 | 950234 | 5837.76 | 840 | 816 | 162.6 |
| B | 0 | 229 | 568580 | 3491.06 | 840 | 816 | 162.6 |
| B | 0 | 189 | 244610 | 1499.04 | 840 | 816 | 162.6 |
| C | 15 | 214 | 319782 | 1637.83 | 824 | 829 | 194.7 |
| C | 14 | 254 | 313766 | 1606.94 | 824 | 829 | 194.7 |
| C | 4 | 254 | 18358 | 90.01 | 824 | 829 | 194.7 |
| D | 1 | 52 | 450853 | 2217.36 | 822 | 799 | 203.0 |
| D | 12 | 6 | 121809 | 596.2 | 822 | 799 | 203.0 |
| D | 13 | 249 | 65870 | 320.6 | 822 | 799 | 203.0 |
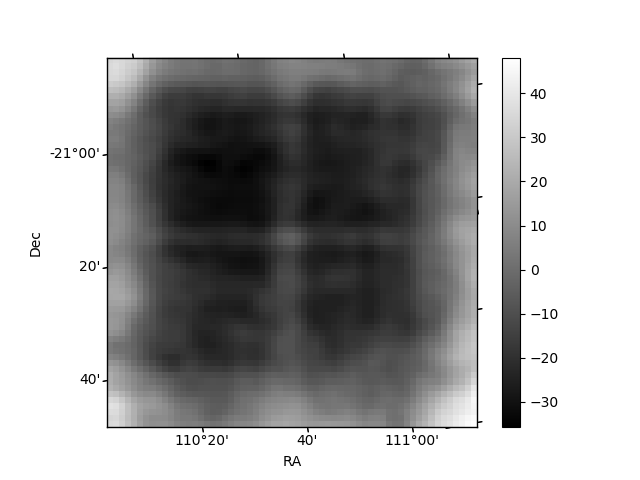
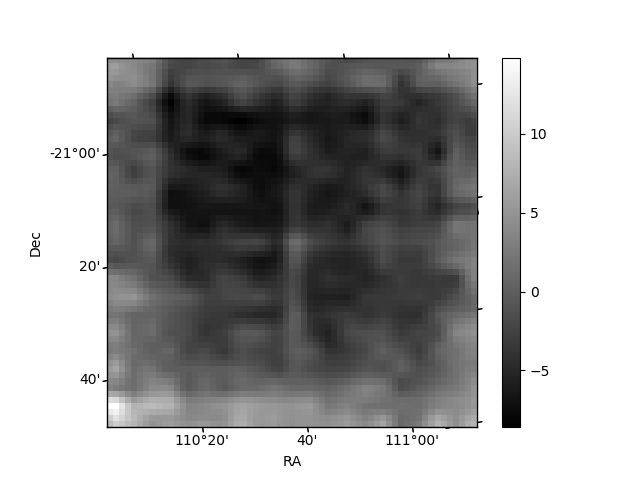
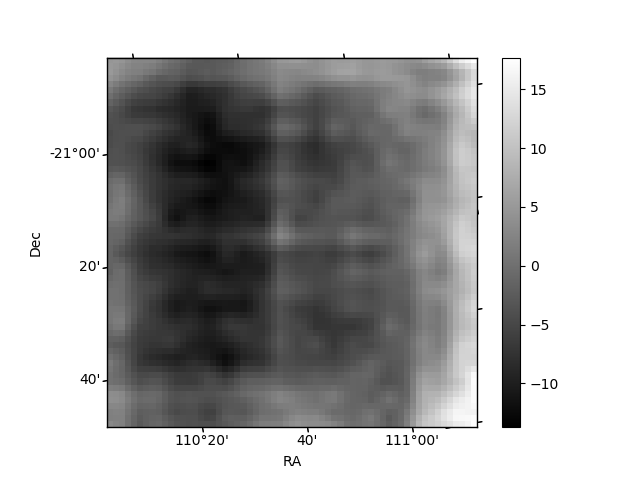
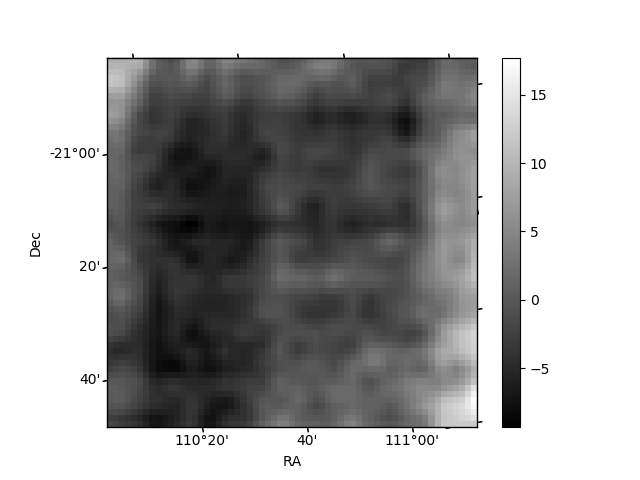
Histogram calculated using DETX and DETY for each event in the final _common_clean file
| Quadrant A | 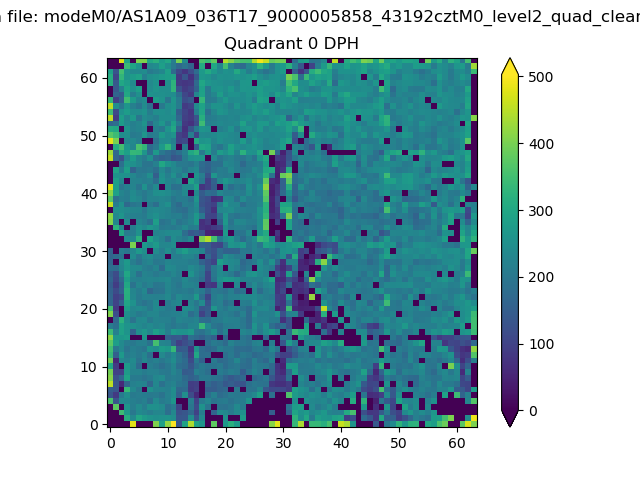 |
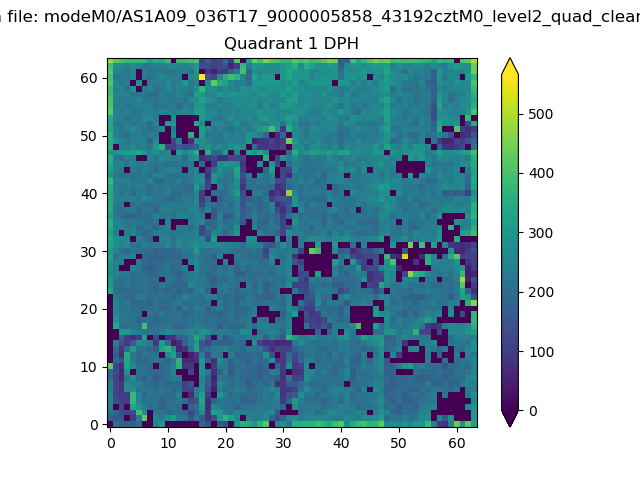 |
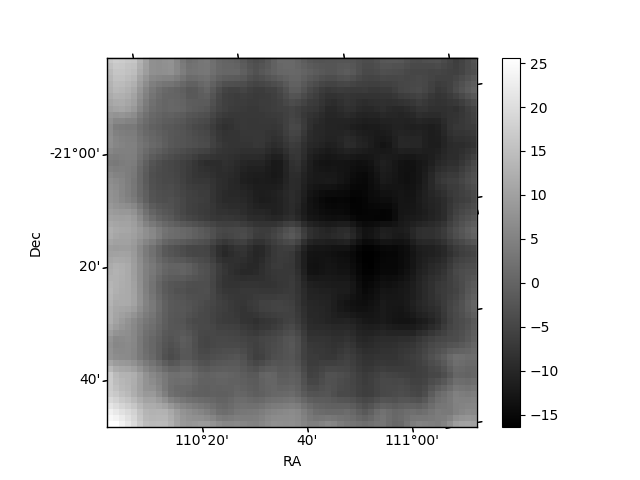
Quadrant B |
|---|---|---|---|
| Quadrant D | 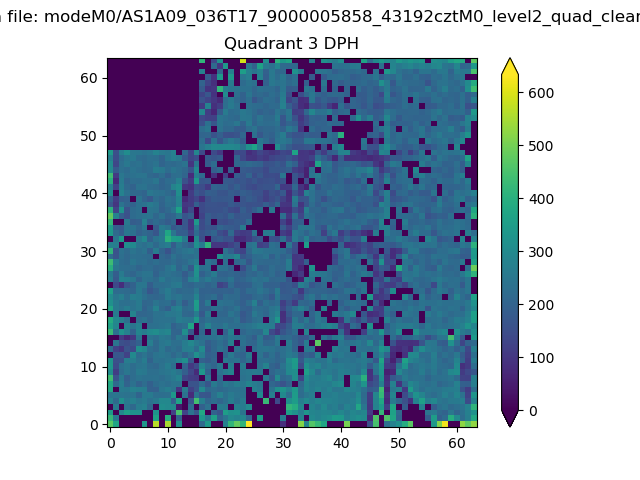 |
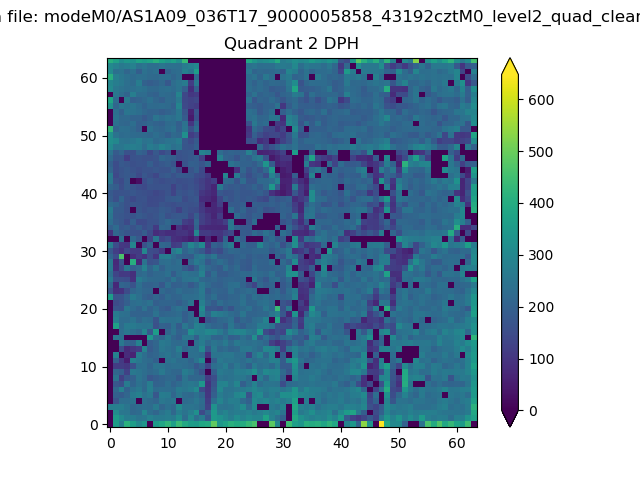 |
Quadrant C |
| Plot type | Count rate plots | Images |
|---|---|---|
| Comparison with Poisson distribution Blue bars denote a histogram of data divided into 1 sec bins. Red curve is a Poisson curve with rate = median count rate of data. |
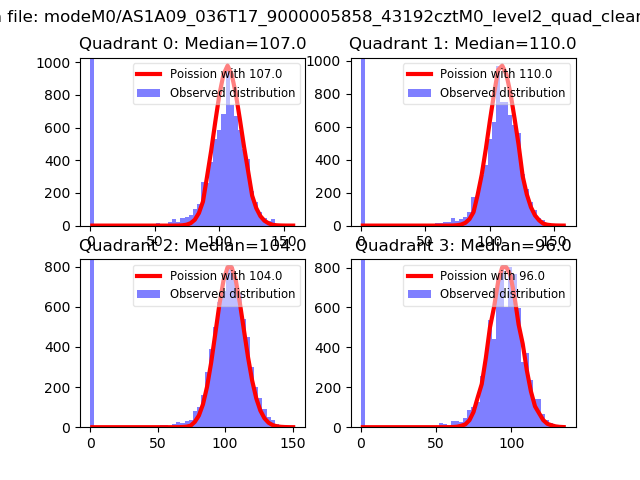 |
 |
| Quadrant-wise count rates Data is divided into 100 sec bins |
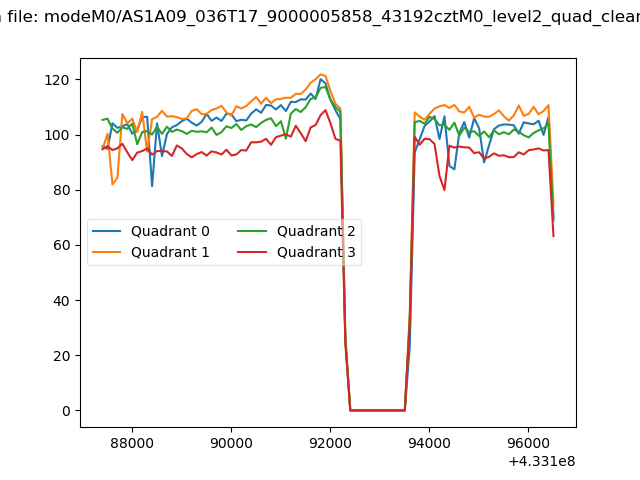 |
|
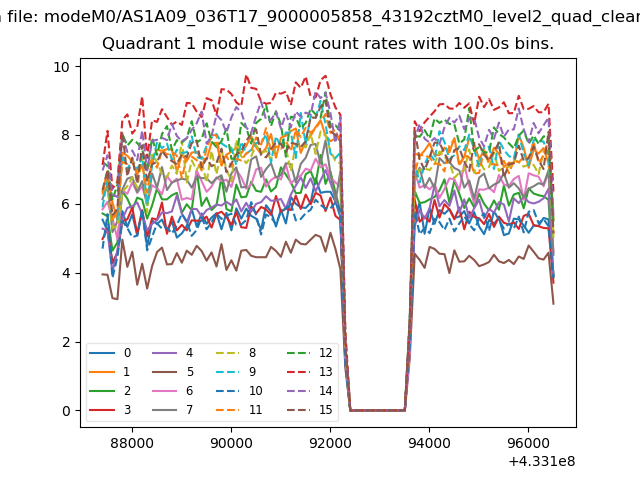
| Module-wise count rates for Quadrant A Data is divided into 100 sec bins |
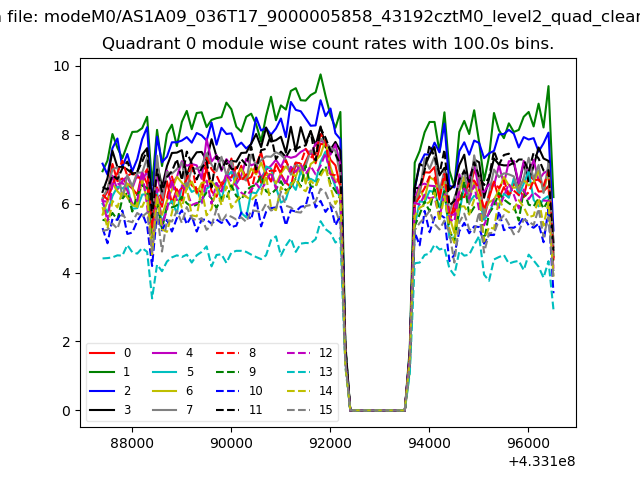 |
 |
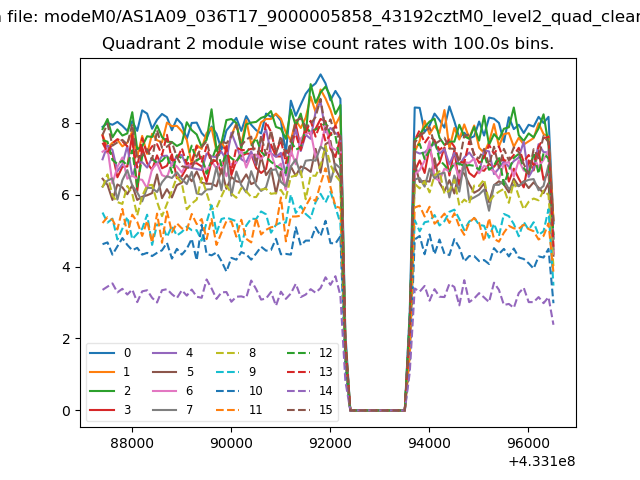
| Module-wise count rates for Quadrant B Data is divided into 100 sec bins |
 |
 |
| Module-wise count rates for Quadrant C Data is divided into 100 sec bins |
 |
 |
| Module-wise count rates for Quadrant D Data is divided into 100 sec bins |
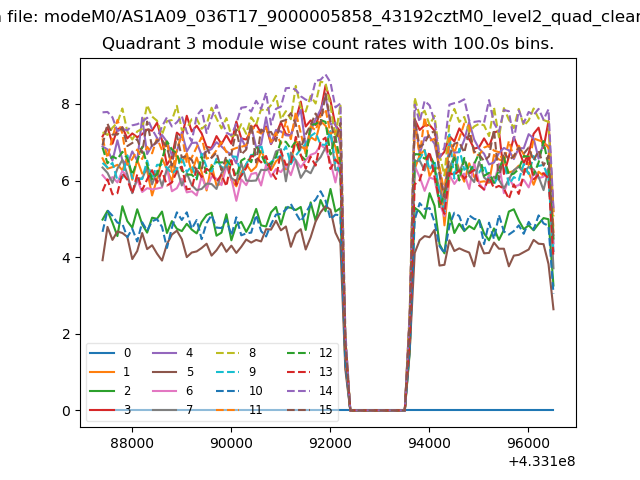 |
 |
| Parameter | Plot |
|---|---|
| CZT HV Monitor | 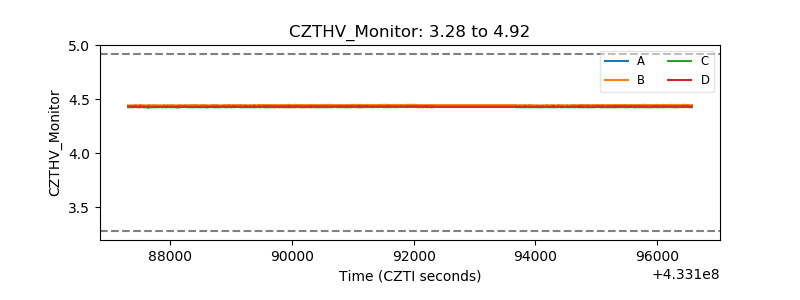 |
| D_VDD | 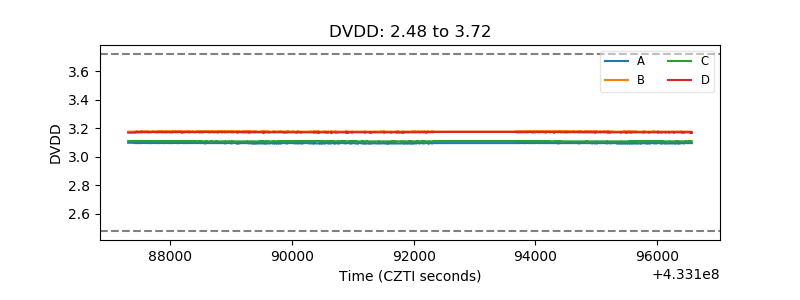 |
| Temperature 1 | 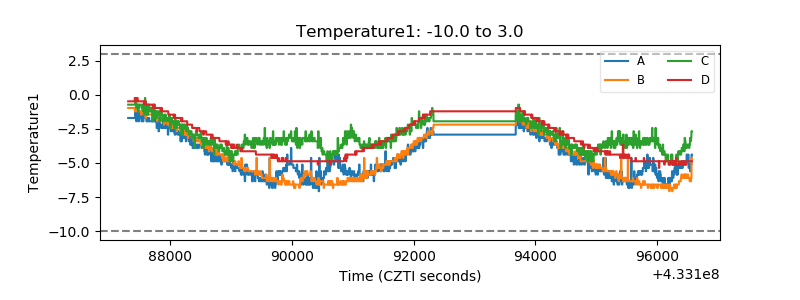 |
| Veto HV Monitor | 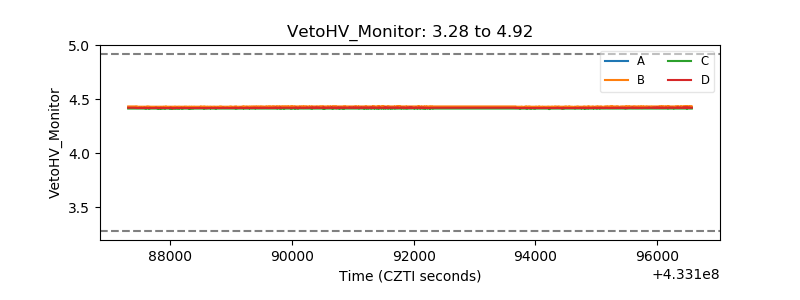 |
| Veto LLD | 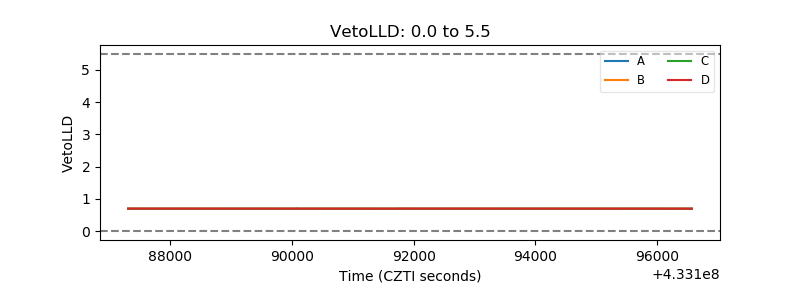 |
| Alpha Counter | 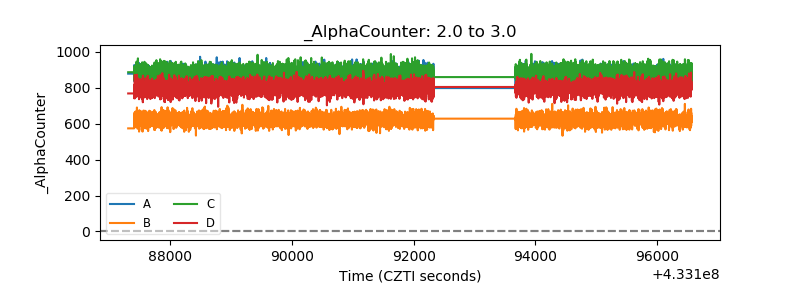 |
| _CPM_Rate | 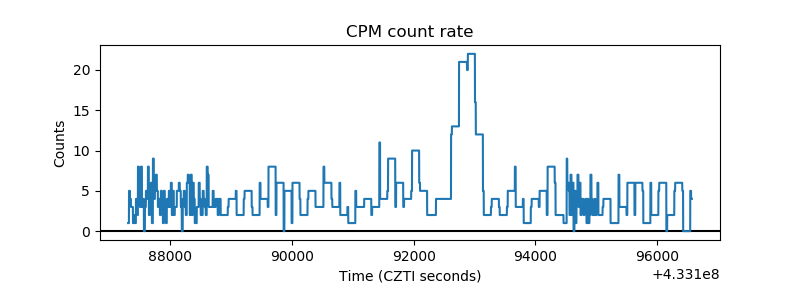 |
| CZT Counter | 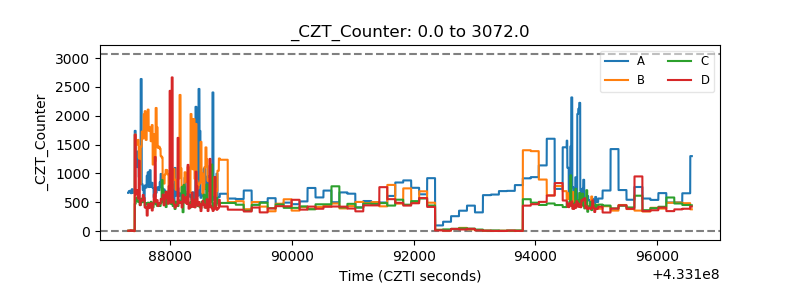 |
| +2.5 Volts monitor | 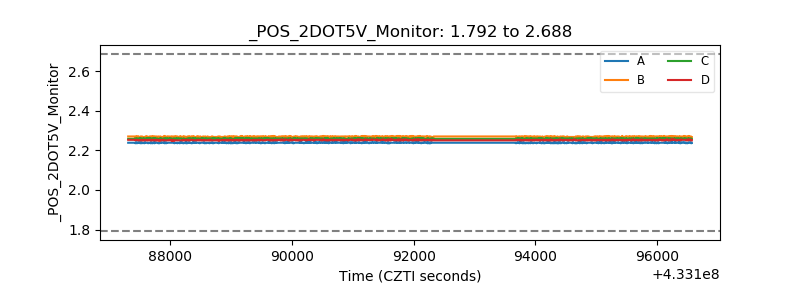 |
| +5 Volts monitor | 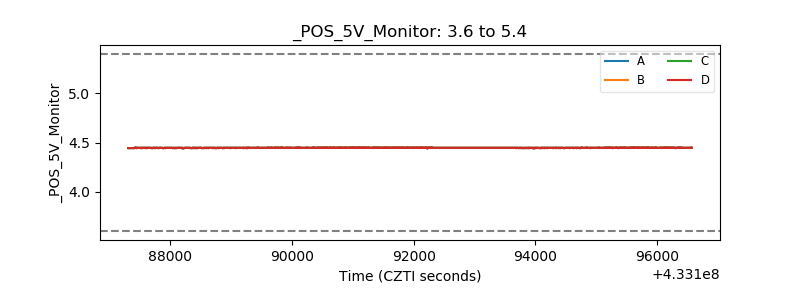 |
| _ROLL_ROT | 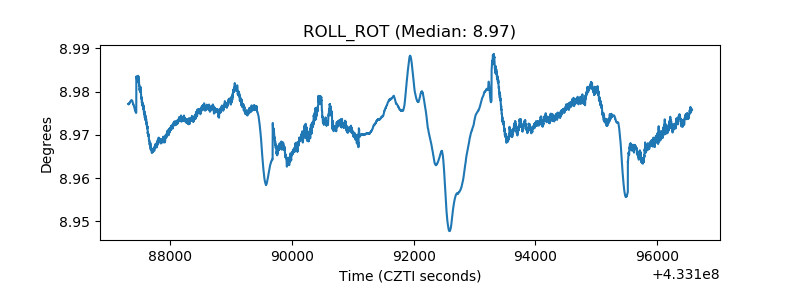 |
| _Roll_DEC | 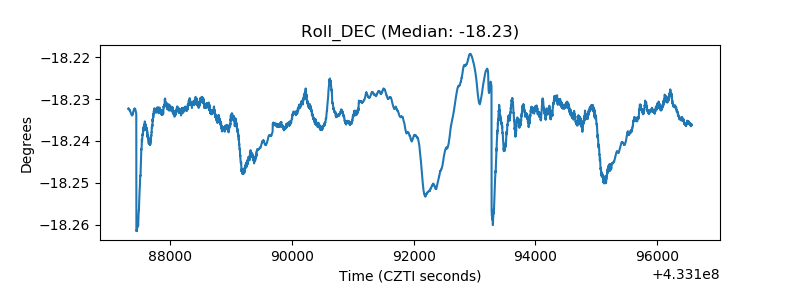 |
| _Roll_RA | 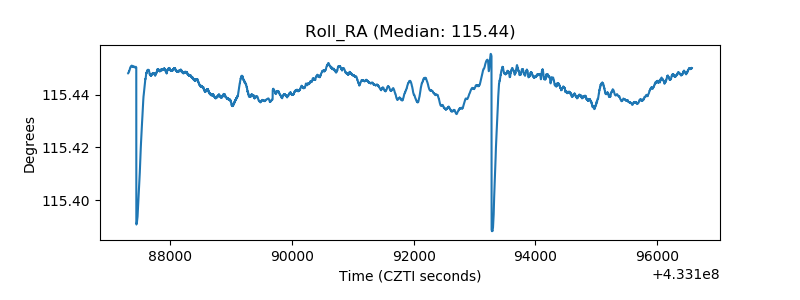 |
| Veto Counter | 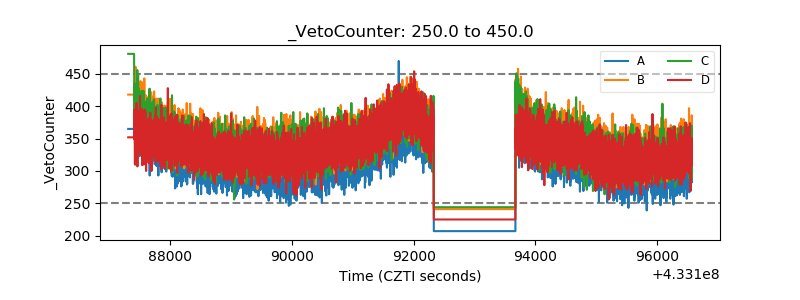 |