| Param | Original file | Final file |
|---|---|---|
| Filename | modeM0/AS1A09_036T17_9000005858_43193cztM0_level2.fits | modeM0/AS1A09_036T17_9000005858_43193cztM0_level2_quad_clean.evt |
| Size (bytes) | 524,989,440 | 135,443,520 |
| Size | 500.7 MB | 129.2 MB |
| Events in quadrant A | 5,994,212 | 891,541 |
| Events in quadrant B | 4,166,994 | 933,759 |
| Events in quadrant C | 4,017,321 | 884,162 |
| Events in quadrant D | 4,606,654 | 811,716 |
| Mode M0 | |||
|---|---|---|---|
| Quadrant | BADHDUFLAG | Total packets | Discarded packets |
| A | 0 | 23360 | 3 |
| B | 0 | 18129 | 2 |
| C | 0 | 17206 | 2 |
| D | 0 | 19560 | 2 |
| Mode SS | |||
|---|---|---|---|
| Quadrant | BADHDUFLAG | Total packets | Discarded packets |
| A | 0 | 170 | 0 |
| B | 0 | 170 | 0 |
| C | 0 | 170 | 0 |
| D | 0 | 170 | 0 |
| Mode M9 | |||
|---|---|---|---|
| Quadrant | BADHDUFLAG | Total packets | Discarded packets |
| A | 0 | 30 | 0 |
| B | 0 | 30 | 0 |
| C | 0 | 30 | 0 |
| D | 0 | 30 | 0 |
| Quadrant | Total seconds | Saturated seconds | Saturation percentage |
|---|---|---|---|
| A | 8347 | 308 | 3.689948% |
| B | 8348 | 78 | 0.934356% |
| C | 8348 | 39 | 0.467178% |
| D | 8348 | 128 | 1.533301% |
Noise dominated data is calculated using 1-second bins in cleaned event files. If a bin has >2000 counts, and if more than 50% of those come from <1% of pixels, then it is considered to be noise-dominated and hence unusable.
| Quadrant | # 1 sec bins | Bins with >0 counts | Bins with >2000 counts | High rate bins dominated by noise | Noise dominated (total time) | Noise dominated (detector-on time) | Marked lightcurve |
|---|---|---|---|---|---|---|---|
| A | 11332 | 8349 | 260 | 260 | 2.29% | 3.11% | 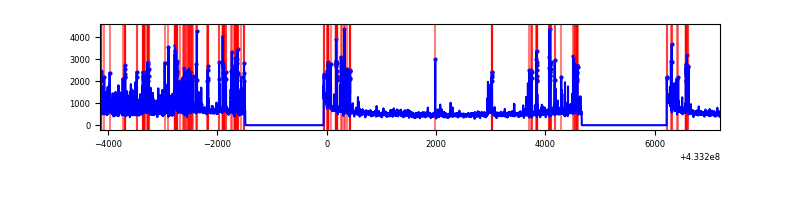 |
| B | 11333 | 8350 | 35 | 35 | 0.31% | 0.42% | 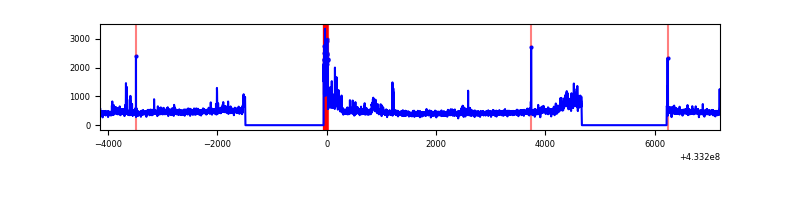 |
| C | 11333 | 8350 | 28 | 28 | 0.25% | 0.34% | 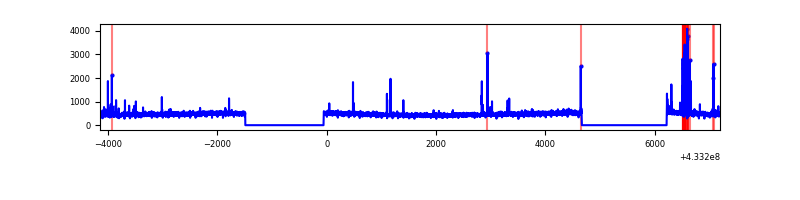 |
| D | 11333 | 8350 | 122 | 122 | 1.08% | 1.46% | 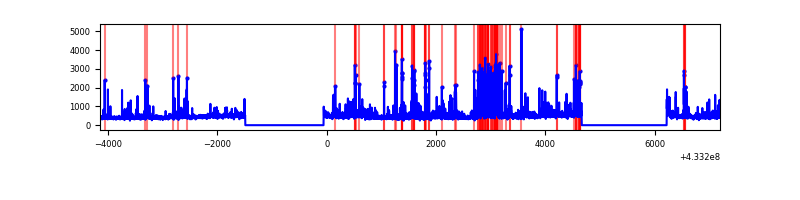 |
Top three noisy pixels from each quadrant. If the there are fewer than three noisy pixels in the level2.evt file, extra rows are filled as -1
| Pixel properties | Quadrant properties | ||||||
|---|---|---|---|---|---|---|---|
| Quadrant | DetID | PixID | Counts | Sigma | Mean | Median | Sigma |
| A | 15 | 237 | 820958 | 4409.38 | 905 | 887 | 186.0 |
| A | 10 | 83 | 774932 | 4161.9 | 905 | 887 | 186.0 |
| A | 15 | 222 | 563516 | 3025.16 | 905 | 887 | 186.0 |
| B | 0 | 186 | 210029 | 1182.42 | 912 | 885 | 176.9 |
| B | 0 | 229 | 204593 | 1151.69 | 912 | 885 | 176.9 |
| B | 0 | 189 | 78536 | 439.01 | 912 | 885 | 176.9 |
| C | 15 | 214 | 337862 | 1590.42 | 898 | 904 | 211.9 |
| C | 15 | 159 | 102982 | 481.8 | 898 | 904 | 211.9 |
| C | 14 | 254 | 63057 | 293.36 | 898 | 904 | 211.9 |
| D | 1 | 52 | 644004 | 2874.03 | 897 | 871 | 223.8 |
| D | 13 | 249 | 202201 | 899.7 | 897 | 871 | 223.8 |
| D | 12 | 6 | 162337 | 721.56 | 897 | 871 | 223.8 |
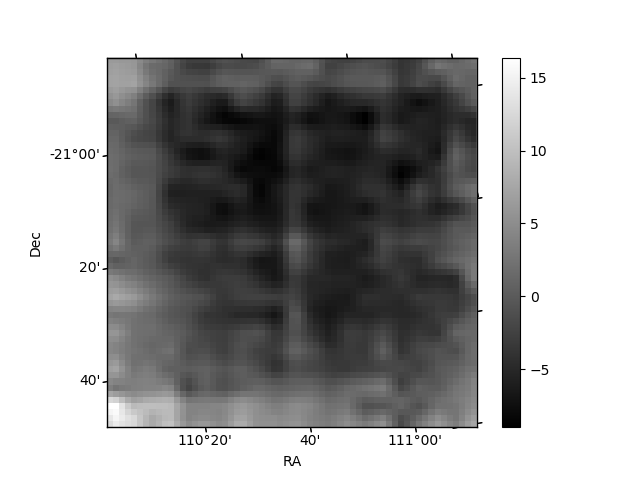
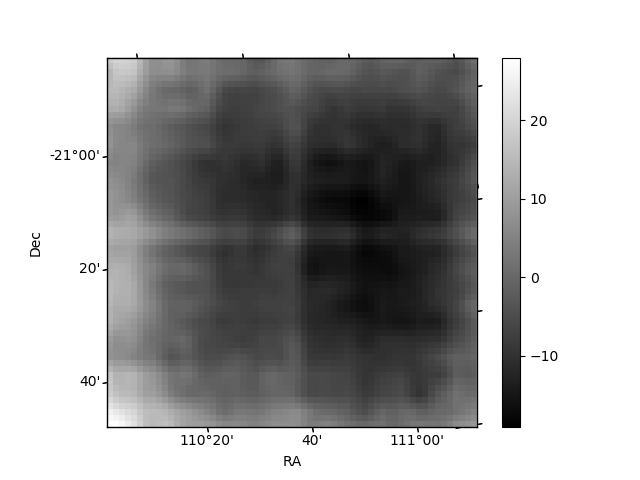
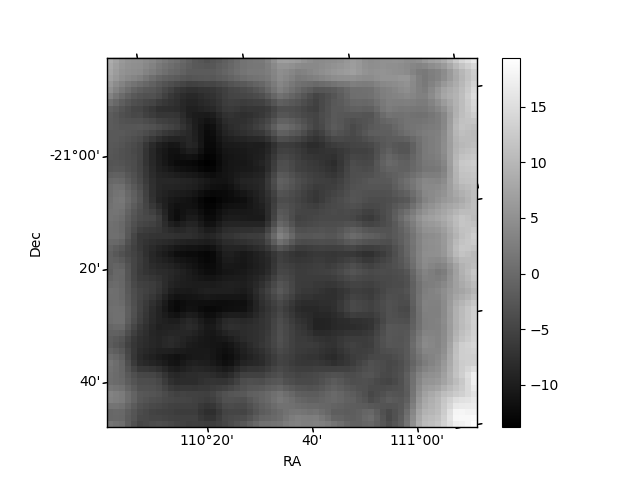
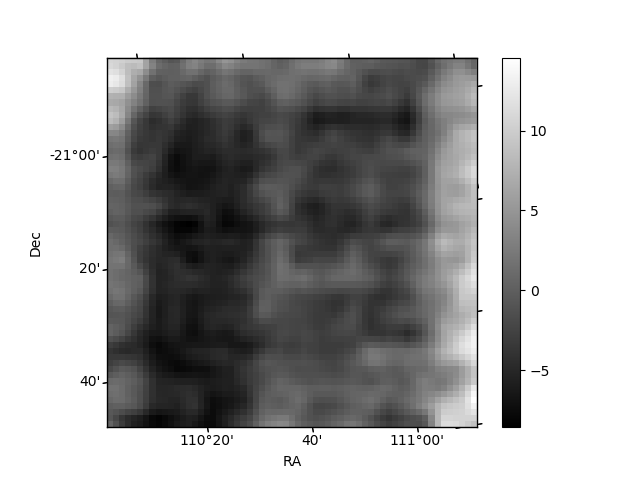
Histogram calculated using DETX and DETY for each event in the final _common_clean file
| Quadrant A | 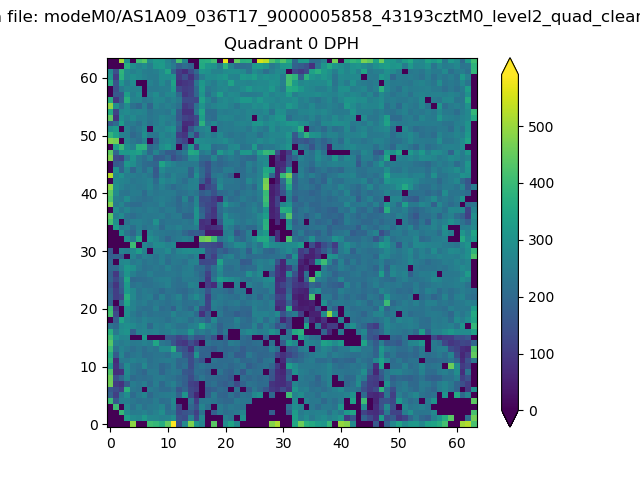 |
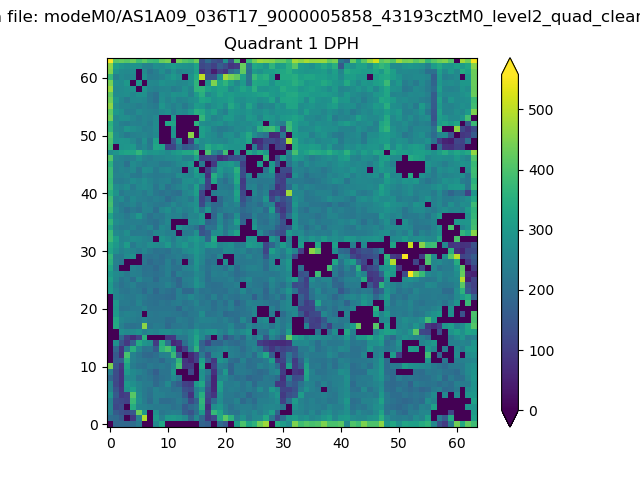 |
Quadrant B |
|---|---|---|---|
| Quadrant D | 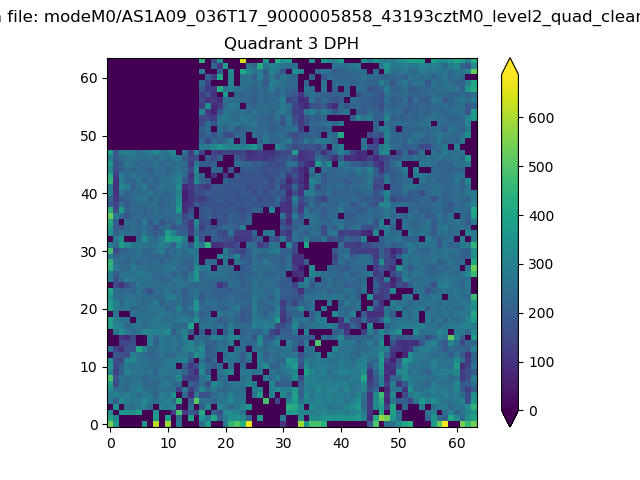 |
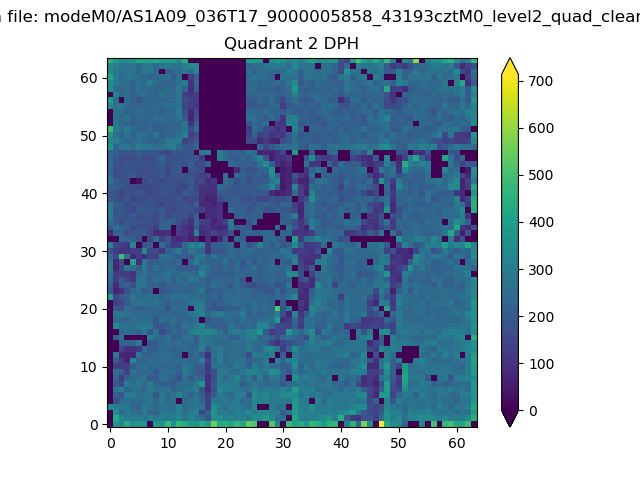 |
Quadrant C |
| Plot type | Count rate plots | Images |
|---|---|---|
| Comparison with Poisson distribution Blue bars denote a histogram of data divided into 1 sec bins. Red curve is a Poisson curve with rate = median count rate of data. |
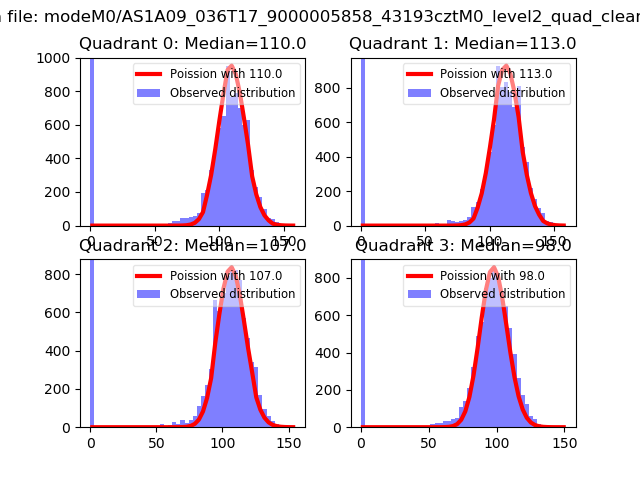 |
 |
| Quadrant-wise count rates Data is divided into 100 sec bins |
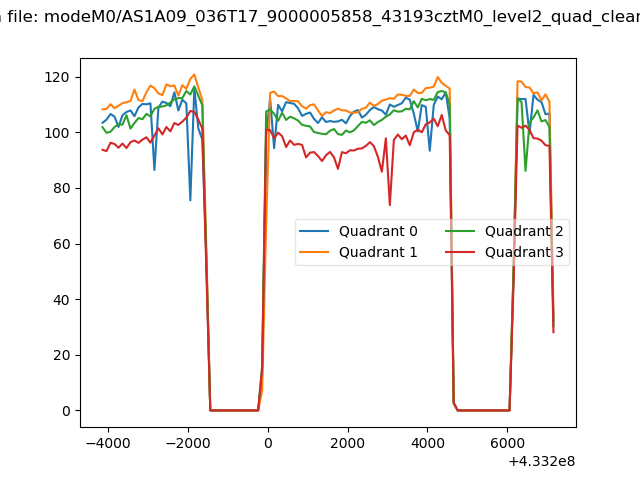 |
|
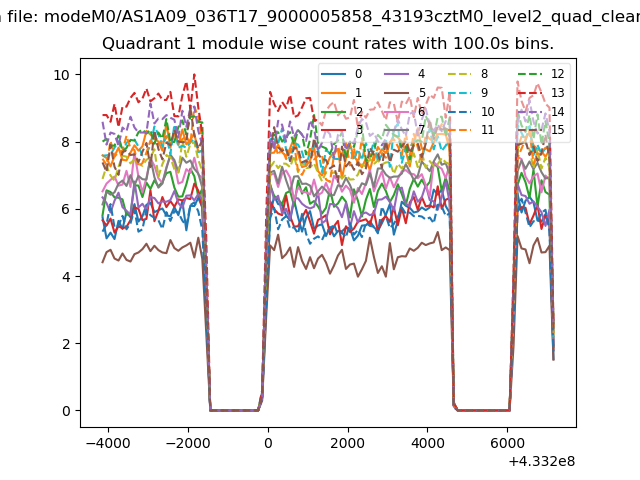
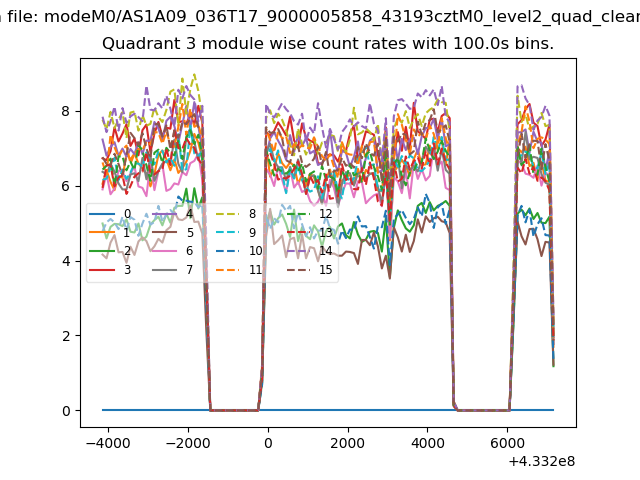
| Module-wise count rates for Quadrant A Data is divided into 100 sec bins |
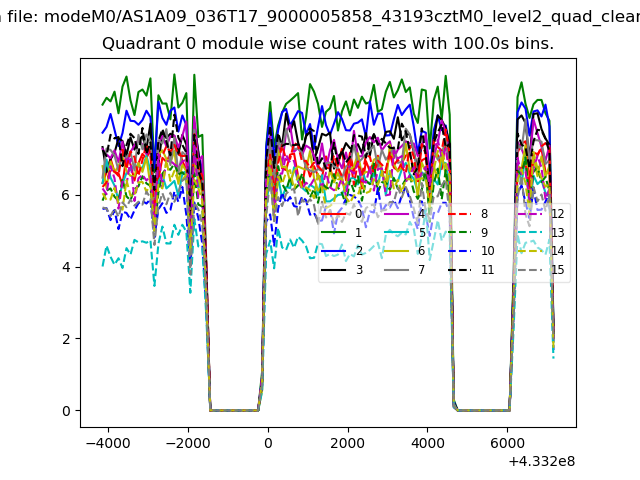 |
 |
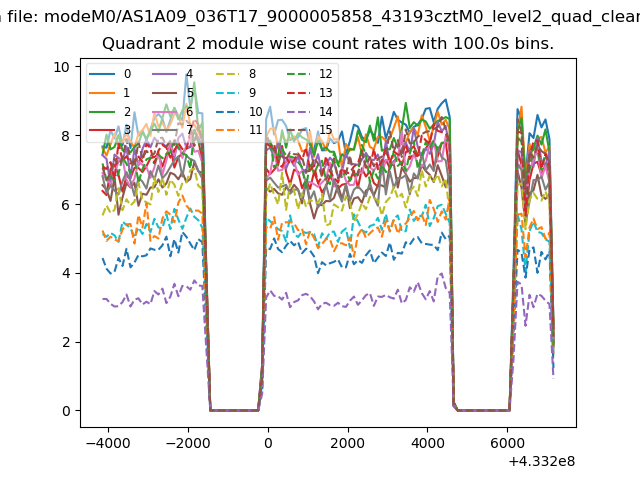
| Module-wise count rates for Quadrant B Data is divided into 100 sec bins |
 |
 |
| Module-wise count rates for Quadrant C Data is divided into 100 sec bins |
 |
 |
| Module-wise count rates for Quadrant D Data is divided into 100 sec bins |
 |
 |
| Parameter | Plot |
|---|---|
| CZT HV Monitor | 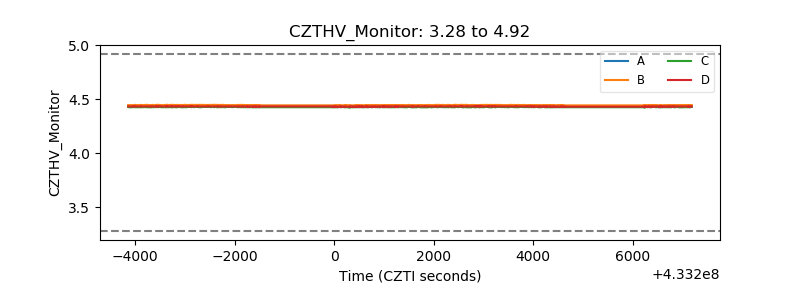 |
| D_VDD | 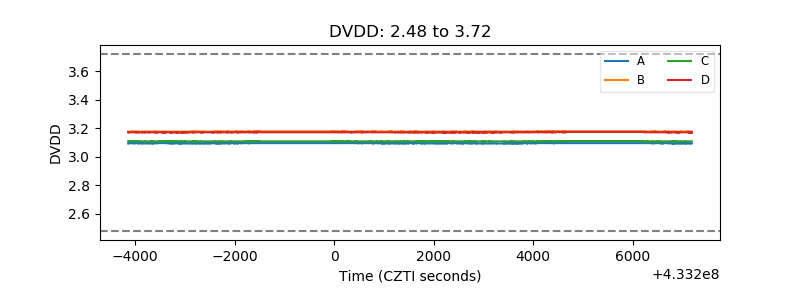 |
| Temperature 1 | 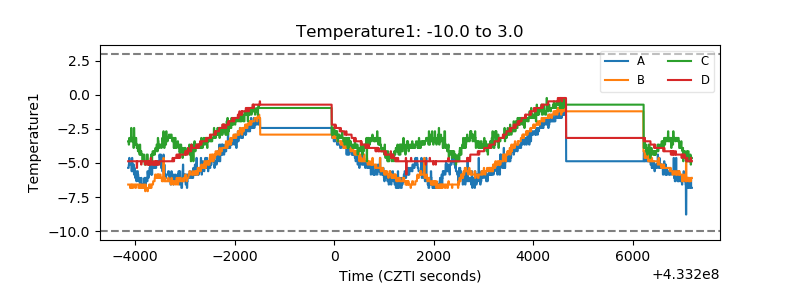 |
| Veto HV Monitor | 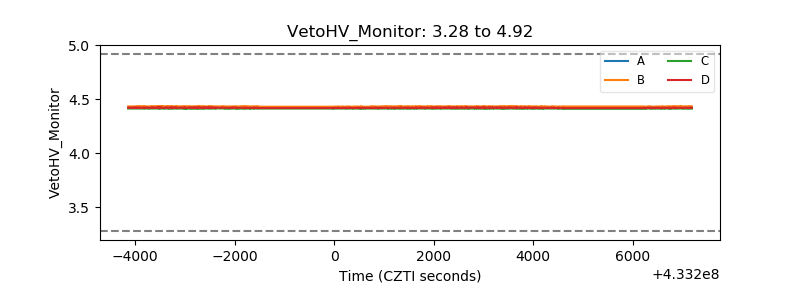 |
| Veto LLD | 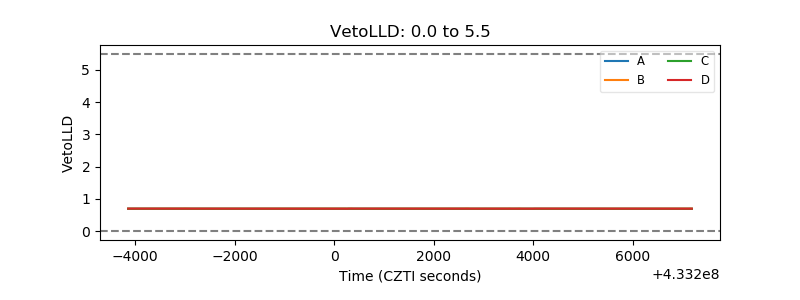 |
| Alpha Counter | 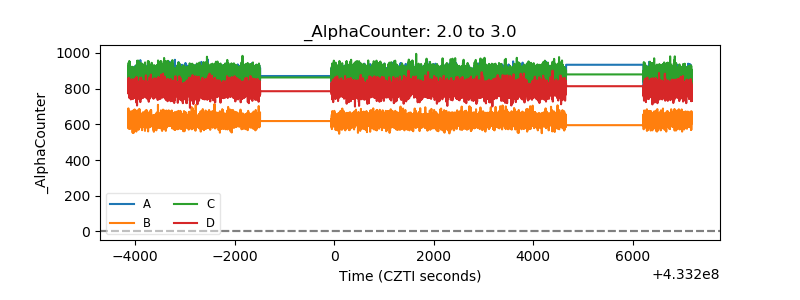 |
| _CPM_Rate | 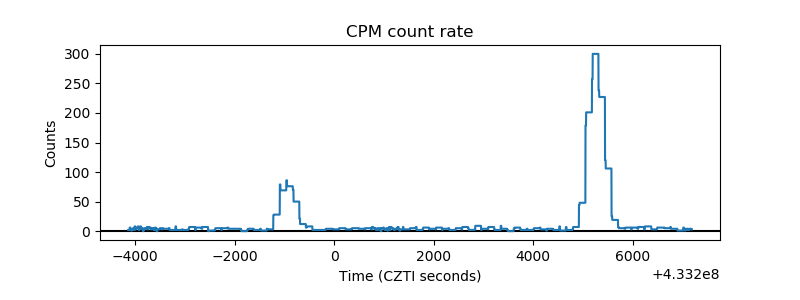 |
| CZT Counter | 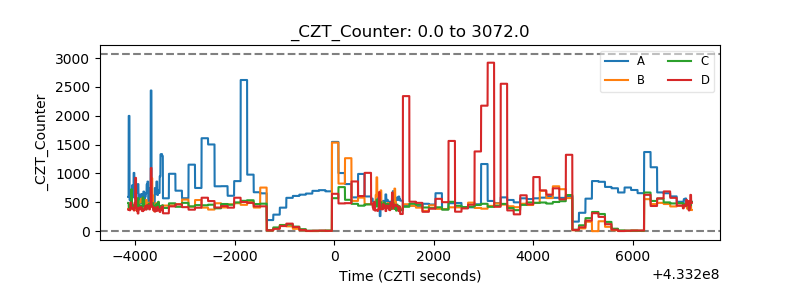 |
| +2.5 Volts monitor | 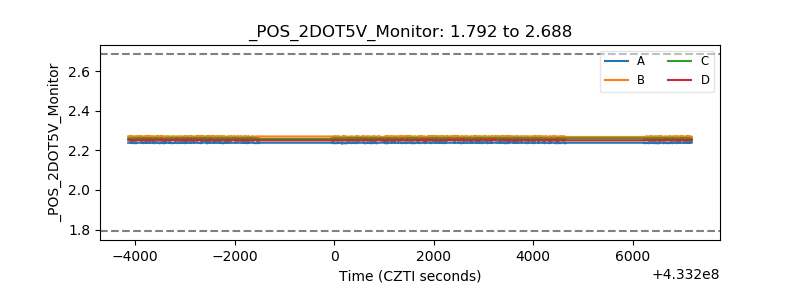 |
| +5 Volts monitor | 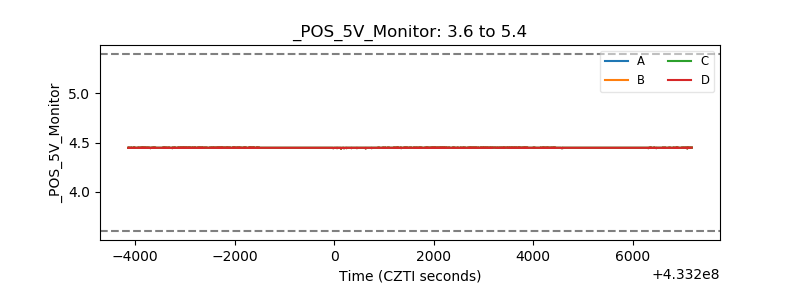 |
| _ROLL_ROT | 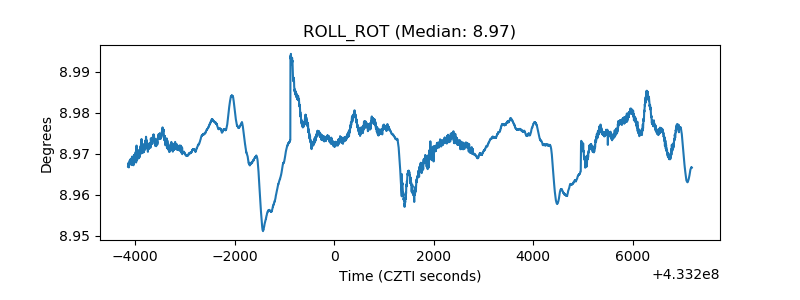 |
| _Roll_DEC | 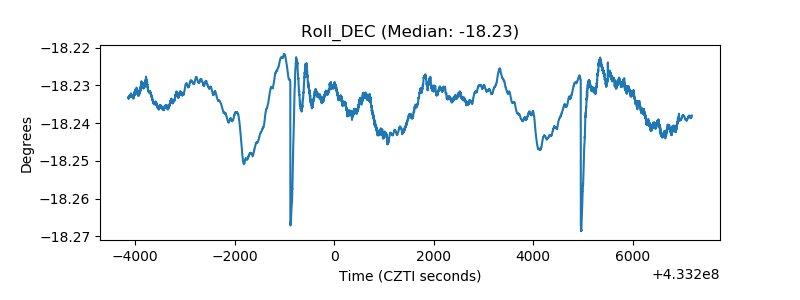 |
| _Roll_RA |  |
| Veto Counter | 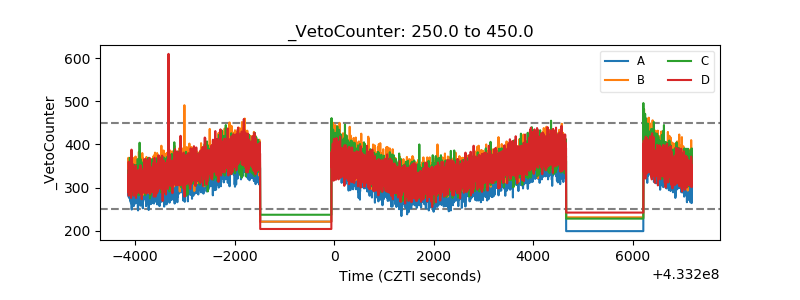 |