| Param | Original file | Final file |
|---|---|---|
| Filename | modeM0/AS1A09_036T17_9000005858_43201cztM0_level2.fits | modeM0/AS1A09_036T17_9000005858_43201cztM0_level2_quad_clean.evt |
| Size (bytes) | 335,194,560 | 86,855,040 |
| Size | 319.7 MB | 82.8 MB |
| Events in quadrant A | 3,944,507 | 555,505 |
| Events in quadrant B | 2,645,414 | 601,257 |
| Events in quadrant C | 2,524,153 | 576,500 |
| Events in quadrant D | 2,884,911 | 528,826 |
| Mode M0 | |||
|---|---|---|---|
| Quadrant | BADHDUFLAG | Total packets | Discarded packets |
| A | 0 | 15034 | 2 |
| B | 0 | 11349 | 3 |
| C | 0 | 10705 | 2 |
| D | 0 | 12137 | 2 |
| Mode SS | |||
|---|---|---|---|
| Quadrant | BADHDUFLAG | Total packets | Discarded packets |
| A | 0 | 108 | 0 |
| B | 0 | 108 | 0 |
| C | 0 | 108 | 0 |
| D | 0 | 108 | 0 |
| Mode M9 | |||
|---|---|---|---|
| Quadrant | BADHDUFLAG | Total packets | Discarded packets |
| A | 0 | 21 | 0 |
| B | 0 | 22 | 0 |
| C | 0 | 22 | 0 |
| D | 0 | 22 | 0 |
| Quadrant | Total seconds | Saturated seconds | Saturation percentage |
|---|---|---|---|
| A | 5248 | 333 | 6.345274% |
| B | 5247 | 15 | 0.285878% |
| C | 5247 | 8 | 0.152468% |
| D | 5247 | 50 | 0.952925% |
Noise dominated data is calculated using 1-second bins in cleaned event files. If a bin has >2000 counts, and if more than 50% of those come from <1% of pixels, then it is considered to be noise-dominated and hence unusable.
| Quadrant | # 1 sec bins | Bins with >0 counts | Bins with >2000 counts | High rate bins dominated by noise | Noise dominated (total time) | Noise dominated (detector-on time) | Marked lightcurve |
|---|---|---|---|---|---|---|---|
| A | 7279 | 5249 | 256 | 256 | 3.52% | 4.88% | 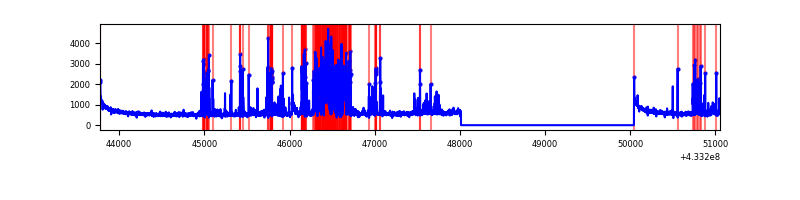 |
| B | 7278 | 5248 | 4 | 4 | 0.05% | 0.08% | 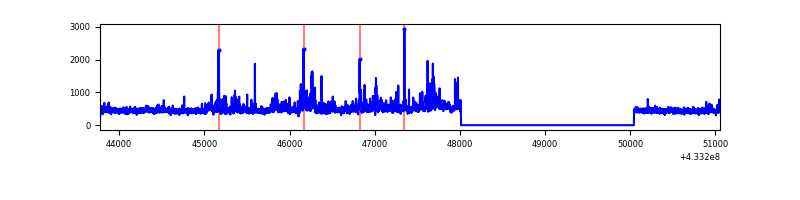 |
| C | 7278 | 5248 | 4 | 4 | 0.05% | 0.08% |  |
| D | 7278 | 5248 | 59 | 59 | 0.81% | 1.12% | 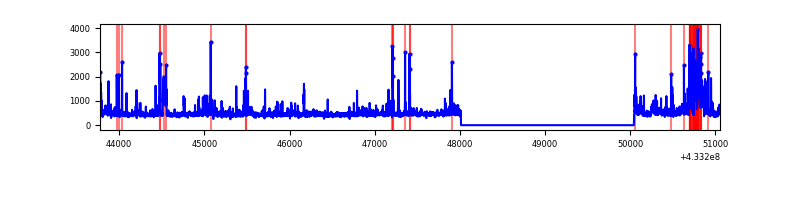 |
Top three noisy pixels from each quadrant. If the there are fewer than three noisy pixels in the level2.evt file, extra rows are filled as -1
| Pixel properties | Quadrant properties | ||||||
|---|---|---|---|---|---|---|---|
| Quadrant | DetID | PixID | Counts | Sigma | Mean | Median | Sigma |
| A | 15 | 237 | 854286 | 7301.28 | 572 | 562 | 116.9 |
| A | 10 | 83 | 600974 | 5134.88 | 572 | 562 | 116.9 |
| A | 13 | 248 | 173443 | 1478.52 | 572 | 562 | 116.9 |
| B | 0 | 229 | 152869 | 1339.6 | 583 | 569 | 113.7 |
| B | 0 | 189 | 99308 | 868.49 | 583 | 569 | 113.7 |
| B | 0 | 186 | 53892 | 469.02 | 583 | 569 | 113.7 |
| C | 15 | 214 | 220702 | 1610.27 | 574 | 579 | 136.7 |
| C | 14 | 254 | 41288 | 297.8 | 574 | 579 | 136.7 |
| C | 15 | 159 | 18118 | 128.3 | 574 | 579 | 136.7 |
| D | 1 | 52 | 340607 | 2393.93 | 577 | 561 | 142.0 |
| D | 12 | 16 | 162747 | 1141.79 | 577 | 561 | 142.0 |
| D | 13 | 249 | 61573 | 429.53 | 577 | 561 | 142.0 |
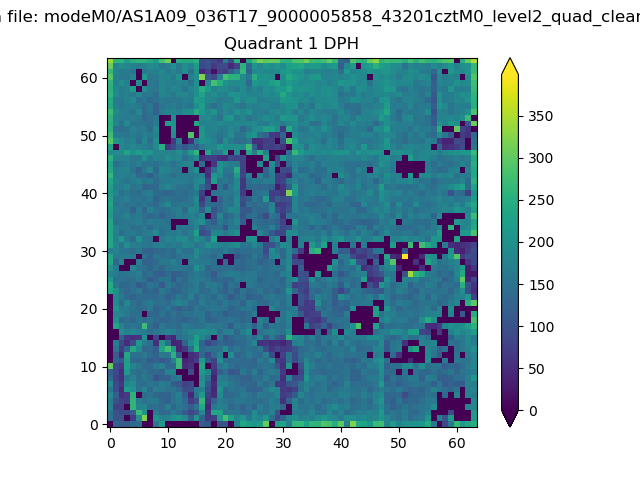
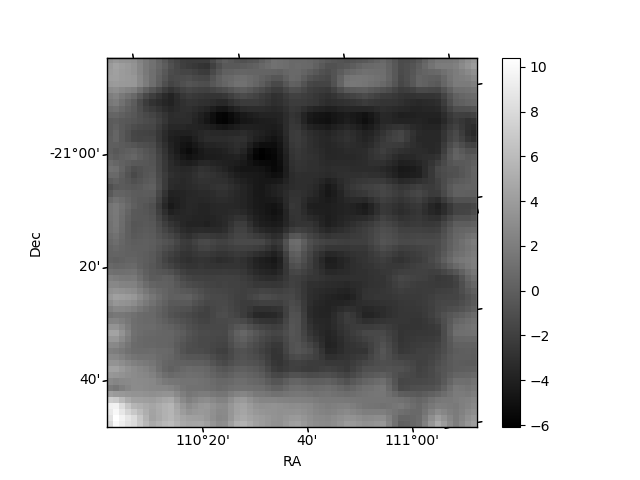
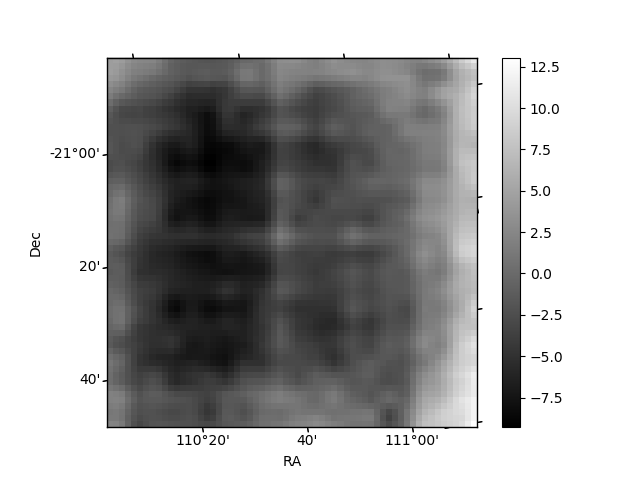
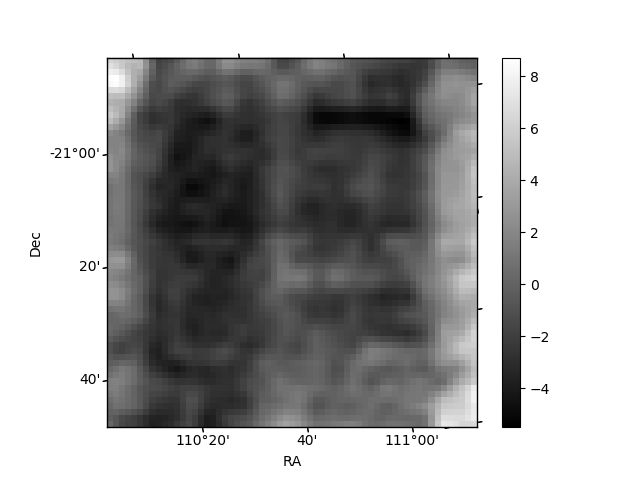
Histogram calculated using DETX and DETY for each event in the final _common_clean file
| Quadrant A | 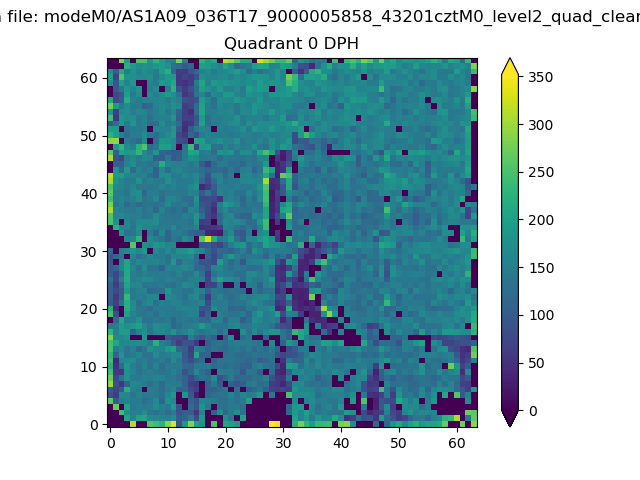 |
 |
Quadrant B |
|---|---|---|---|
| Quadrant D | 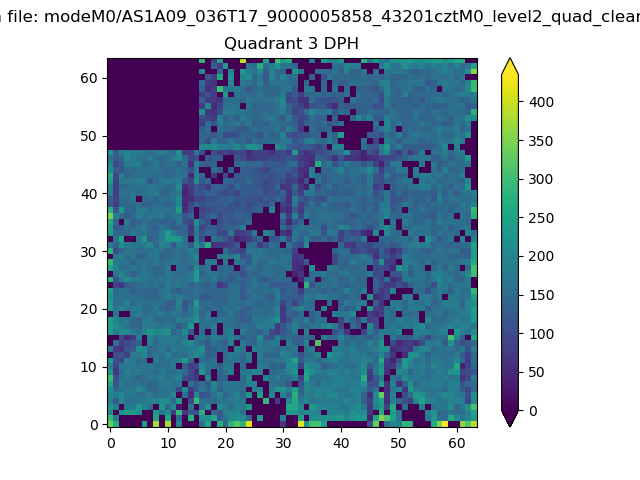 |
 |
Quadrant C |
| Plot type | Count rate plots | Images |
|---|---|---|
| Comparison with Poisson distribution Blue bars denote a histogram of data divided into 1 sec bins. Red curve is a Poisson curve with rate = median count rate of data. |
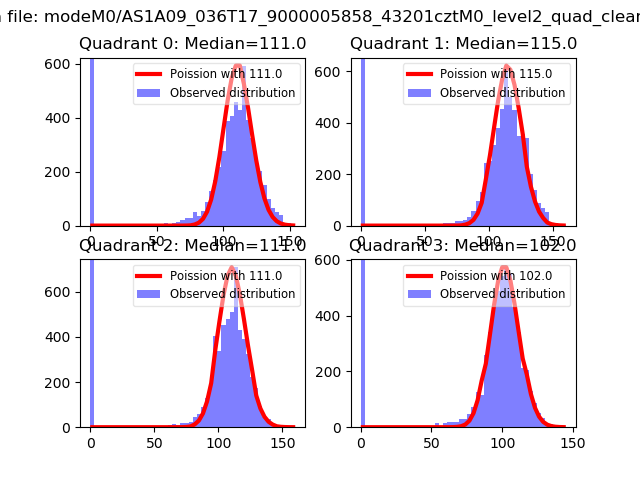 |
 |
| Quadrant-wise count rates Data is divided into 100 sec bins |
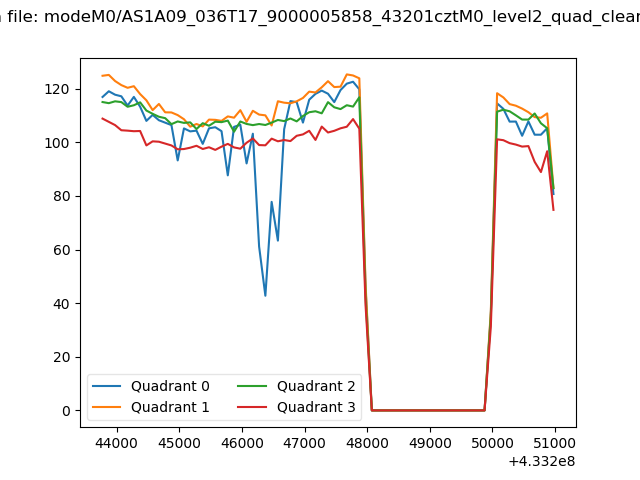 |
|
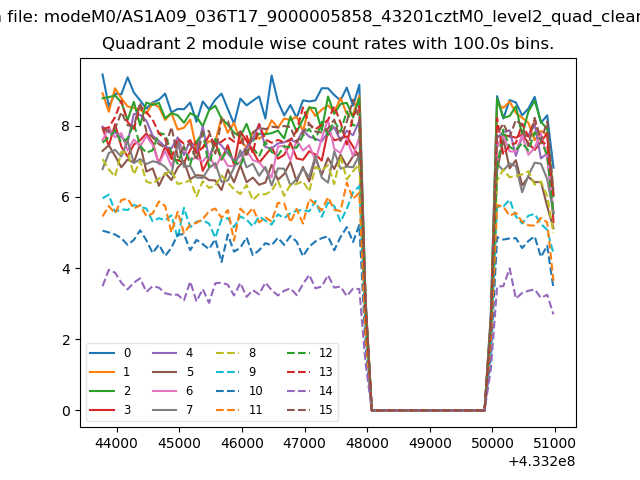
| Module-wise count rates for Quadrant A Data is divided into 100 sec bins |
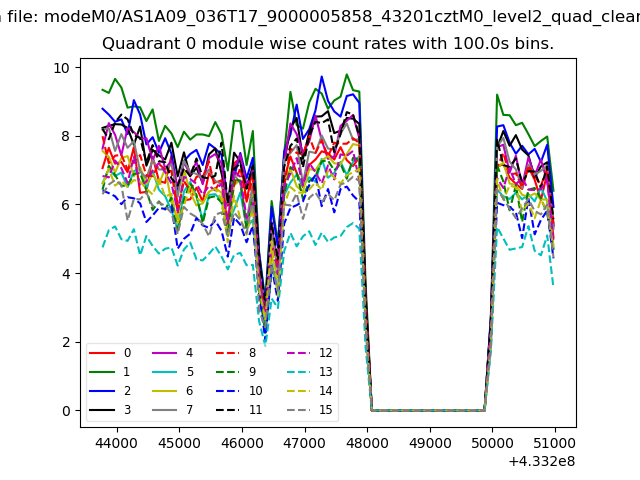 |
 |
| Module-wise count rates for Quadrant B Data is divided into 100 sec bins |
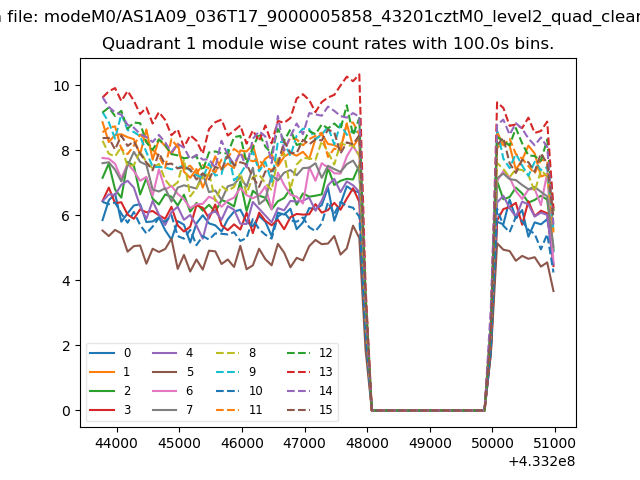 |
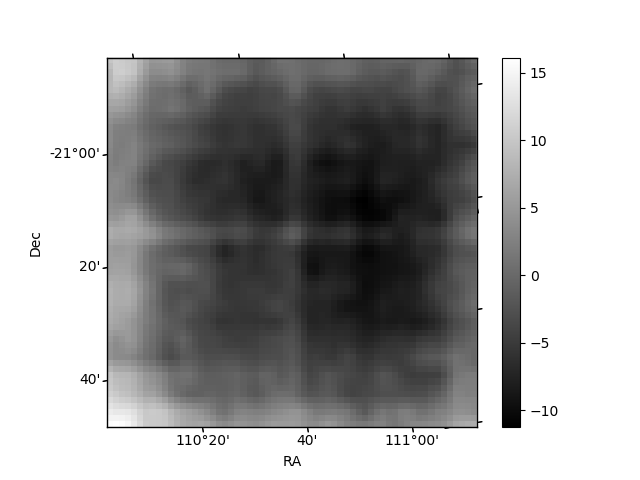 |
| Module-wise count rates for Quadrant C Data is divided into 100 sec bins |
 |
 |
| Module-wise count rates for Quadrant D Data is divided into 100 sec bins |
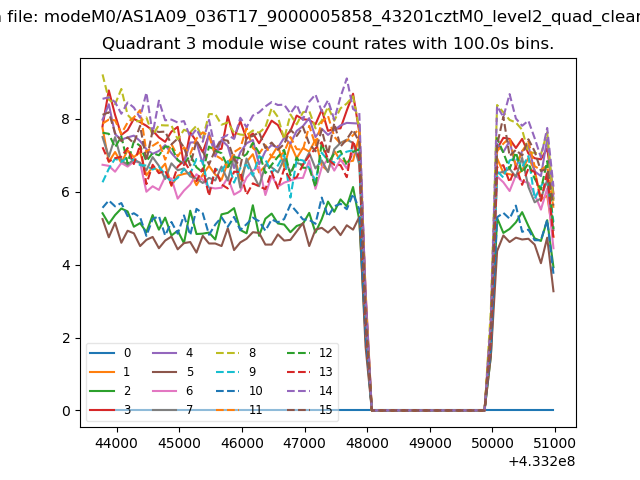 |
 |
| Parameter | Plot |
|---|---|
| CZT HV Monitor | 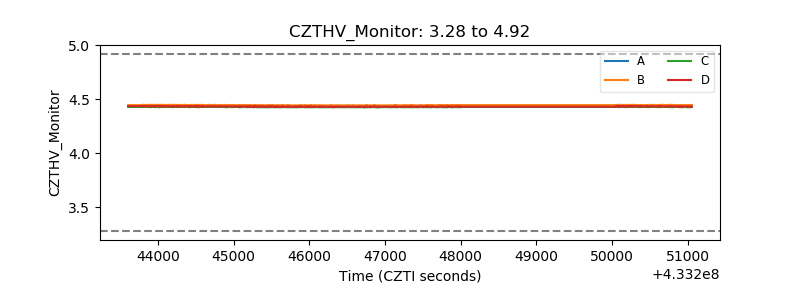 |
| D_VDD | 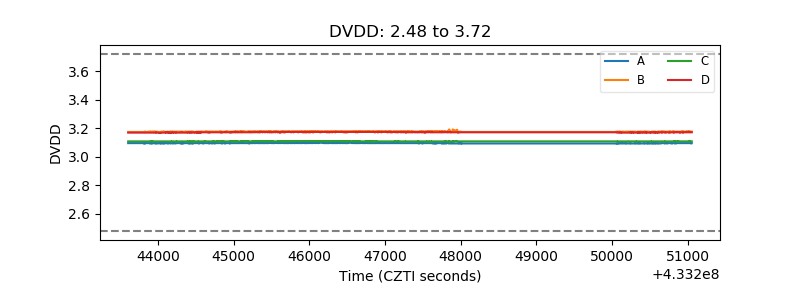 |
| Temperature 1 | 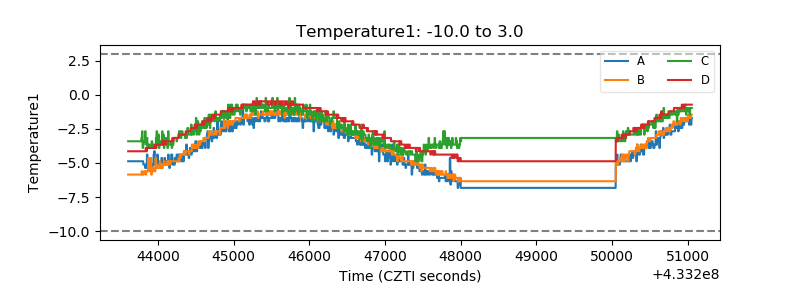 |
| Veto HV Monitor | 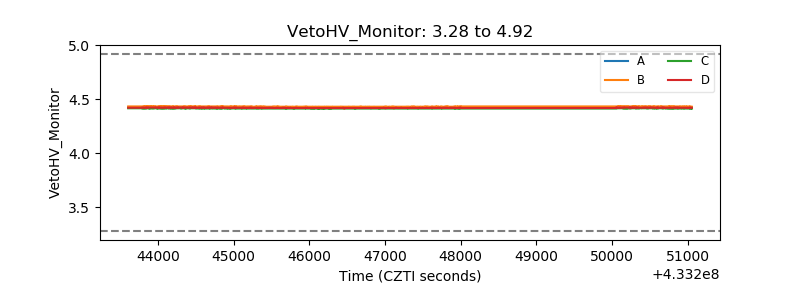 |
| Veto LLD | 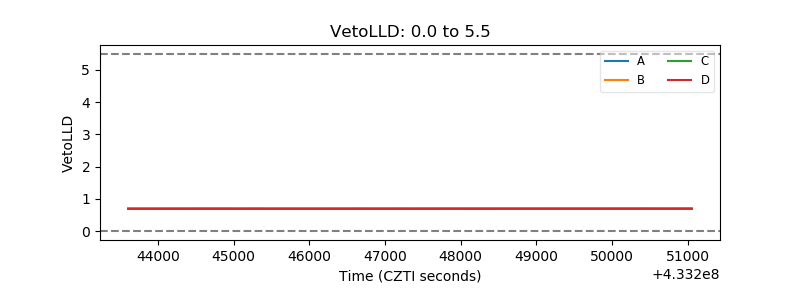 |
| Alpha Counter | 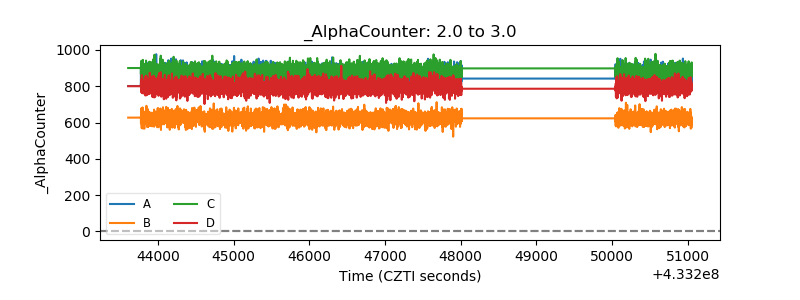 |
| _CPM_Rate | 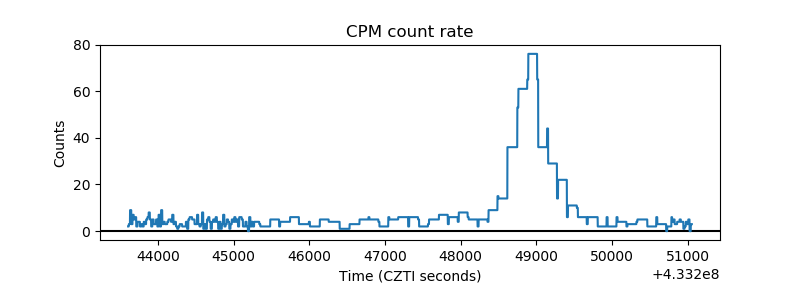 |
| CZT Counter | 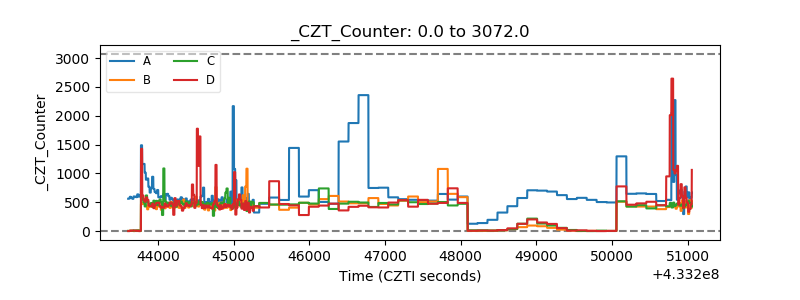 |
| +2.5 Volts monitor |  |
| +5 Volts monitor | 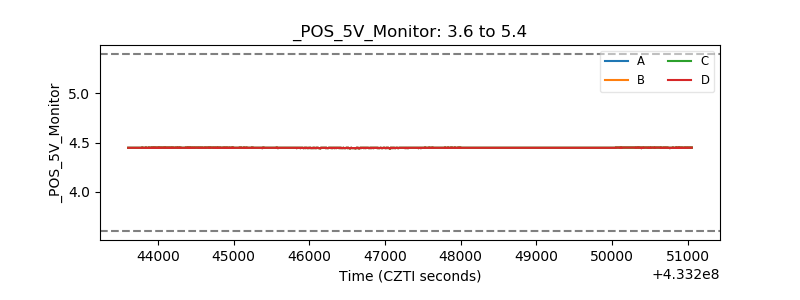 |
| _ROLL_ROT | 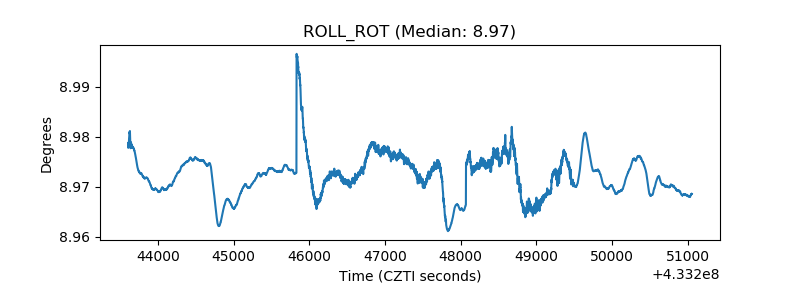 |
| _Roll_DEC | 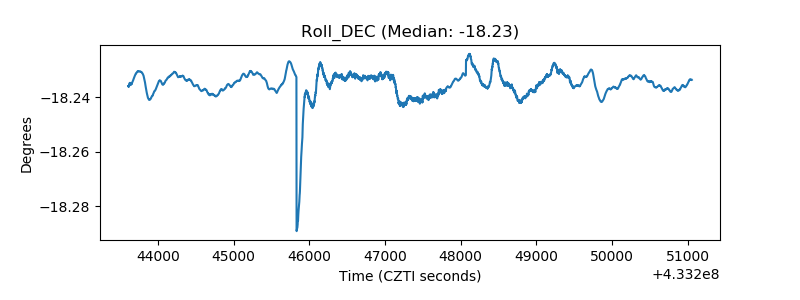 |
| _Roll_RA | 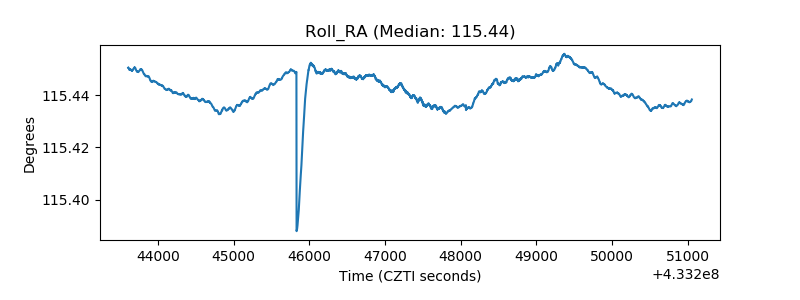 |
| Veto Counter | 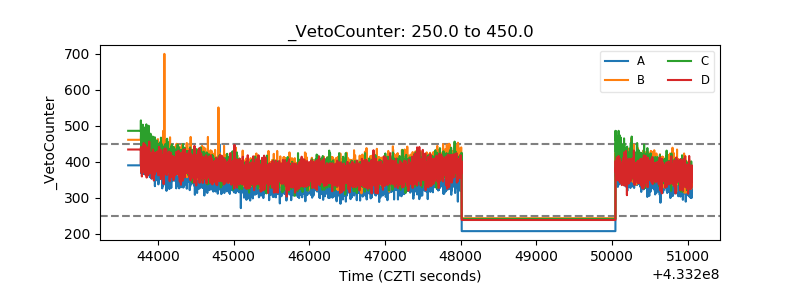 |