| Param | Original file | Final file |
|---|---|---|
| Filename | modeM0/AS1A09_036T17_9000005858_43203cztM0_level2.fits | modeM0/AS1A09_036T17_9000005858_43203cztM0_level2_quad_clean.evt |
| Size (bytes) | 426,548,160 | 93,009,600 |
| Size | 406.8 MB | 88.7 MB |
| Events in quadrant A | 4,456,134 | 598,156 |
| Events in quadrant B | 3,805,531 | 634,826 |
| Events in quadrant C | 2,994,372 | 614,262 |
| Events in quadrant D | 4,080,174 | 561,299 |
| Mode M0 | |||
|---|---|---|---|
| Quadrant | BADHDUFLAG | Total packets | Discarded packets |
| A | 0 | 16934 | 2 |
| B | 0 | 15137 | 2 |
| C | 0 | 12532 | 2 |
| D | 0 | 16114 | 2 |
| Mode SS | |||
|---|---|---|---|
| Quadrant | BADHDUFLAG | Total packets | Discarded packets |
| A | 0 | 118 | 0 |
| B | 0 | 118 | 0 |
| C | 0 | 118 | 0 |
| D | 0 | 118 | 0 |
| Mode M9 | |||
|---|---|---|---|
| Quadrant | BADHDUFLAG | Total packets | Discarded packets |
| A | 0 | 14 | 0 |
| B | 0 | 15 | 0 |
| C | 0 | 15 | 0 |
| D | 0 | 15 | 0 |
| Quadrant | Total seconds | Saturated seconds | Saturation percentage |
|---|---|---|---|
| A | 5831 | 375 | 6.431144% |
| B | 5831 | 165 | 2.829703% |
| C | 5831 | 38 | 0.651689% |
| D | 5831 | 141 | 2.418110% |
Noise dominated data is calculated using 1-second bins in cleaned event files. If a bin has >2000 counts, and if more than 50% of those come from <1% of pixels, then it is considered to be noise-dominated and hence unusable.
| Quadrant | # 1 sec bins | Bins with >0 counts | Bins with >2000 counts | High rate bins dominated by noise | Noise dominated (total time) | Noise dominated (detector-on time) | Marked lightcurve |
|---|---|---|---|---|---|---|---|
| A | 7264 | 5832 | 273 | 273 | 3.76% | 4.68% | 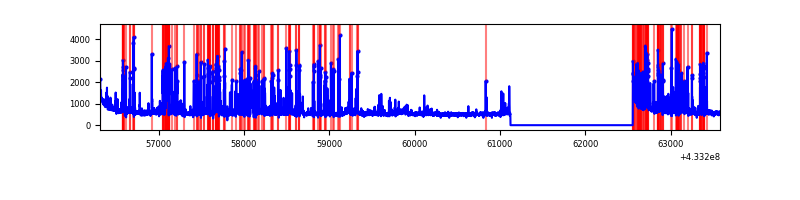 |
| B | 7264 | 5832 | 73 | 73 | 1.00% | 1.25% | 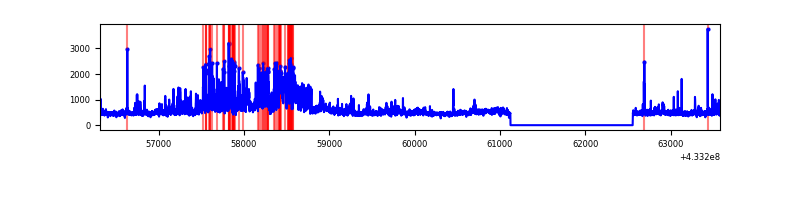 |
| C | 7264 | 5832 | 36 | 36 | 0.50% | 0.62% | 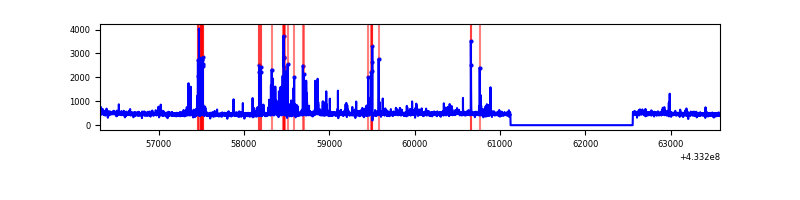 |
| D | 7264 | 5832 | 135 | 135 | 1.86% | 2.31% | 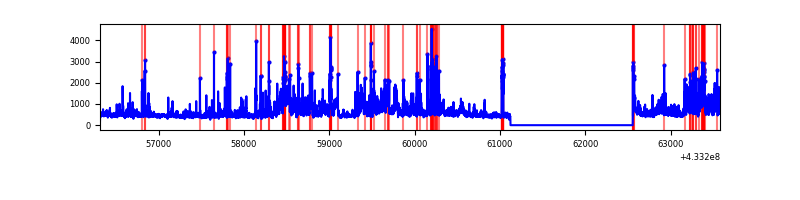 |
Top three noisy pixels from each quadrant. If the there are fewer than three noisy pixels in the level2.evt file, extra rows are filled as -1
| Pixel properties | Quadrant properties | ||||||
|---|---|---|---|---|---|---|---|
| Quadrant | DetID | PixID | Counts | Sigma | Mean | Median | Sigma |
| A | 15 | 237 | 927988 | 7217.78 | 623 | 610 | 128.5 |
| A | 10 | 83 | 665348 | 5173.65 | 623 | 610 | 128.5 |
| A | 13 | 248 | 259258 | 2013.06 | 623 | 610 | 128.5 |
| B | 0 | 229 | 929530 | 7512.89 | 634 | 617 | 123.6 |
| B | 0 | 186 | 172163 | 1387.43 | 634 | 617 | 123.6 |
| B | 0 | 190 | 112072 | 901.43 | 634 | 617 | 123.6 |
| C | 15 | 214 | 246546 | 1654.94 | 625 | 627 | 148.6 |
| C | 14 | 254 | 217122 | 1456.93 | 625 | 627 | 148.6 |
| C | 4 | 254 | 73593 | 491.03 | 625 | 627 | 148.6 |
| D | 1 | 52 | 1290111 | 8275.81 | 623 | 603 | 155.8 |
| D | 12 | 16 | 179545 | 1148.41 | 623 | 603 | 155.8 |
| D | 13 | 249 | 48576 | 307.88 | 623 | 603 | 155.8 |
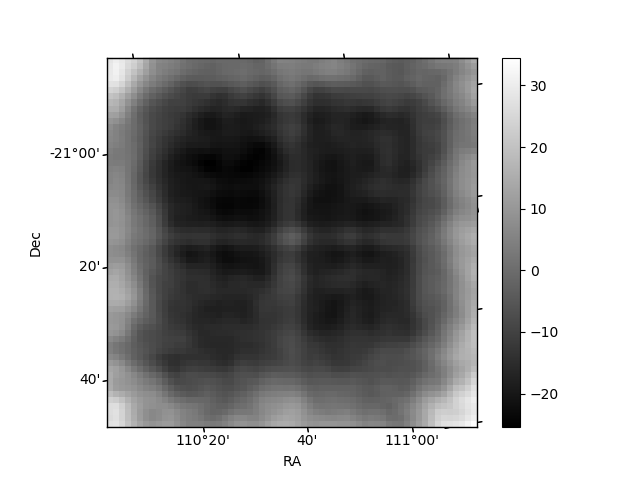
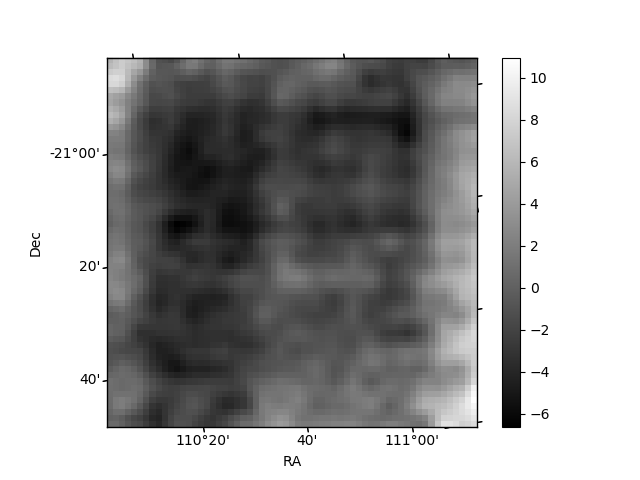
Histogram calculated using DETX and DETY for each event in the final _common_clean file
| Quadrant A | 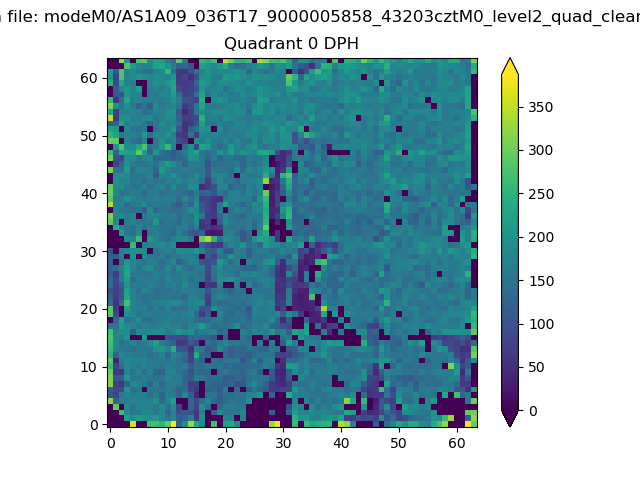 |
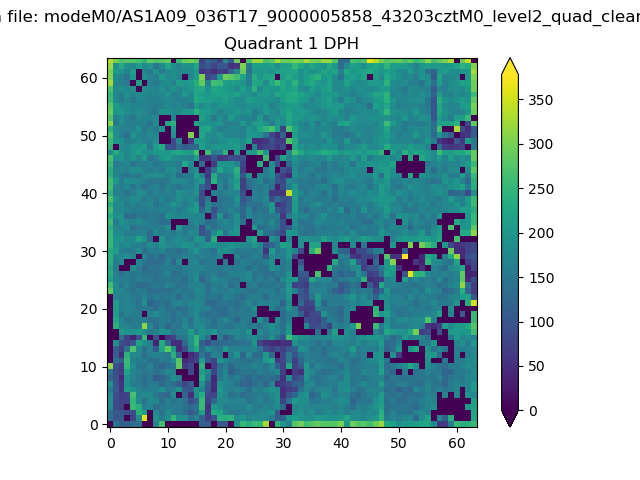 |
Quadrant B |
|---|---|---|---|
| Quadrant D | 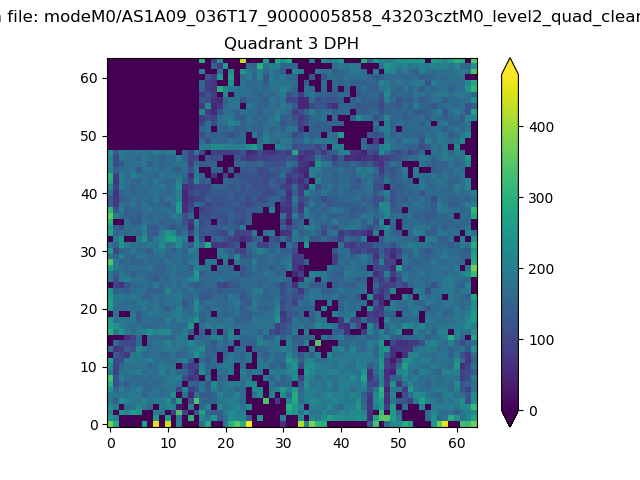 |
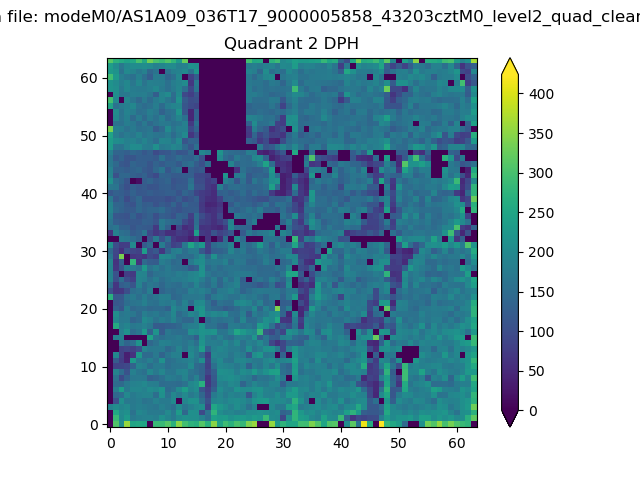 |
Quadrant C |
| Plot type | Count rate plots | Images |
|---|---|---|
| Comparison with Poisson distribution Blue bars denote a histogram of data divided into 1 sec bins. Red curve is a Poisson curve with rate = median count rate of data. |
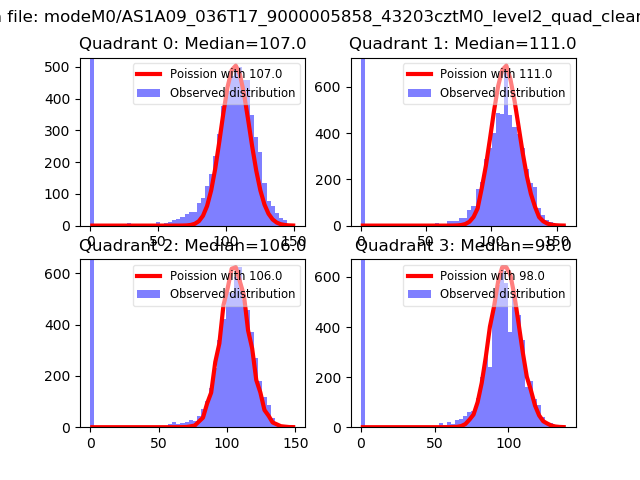 |
 |
| Quadrant-wise count rates Data is divided into 100 sec bins |
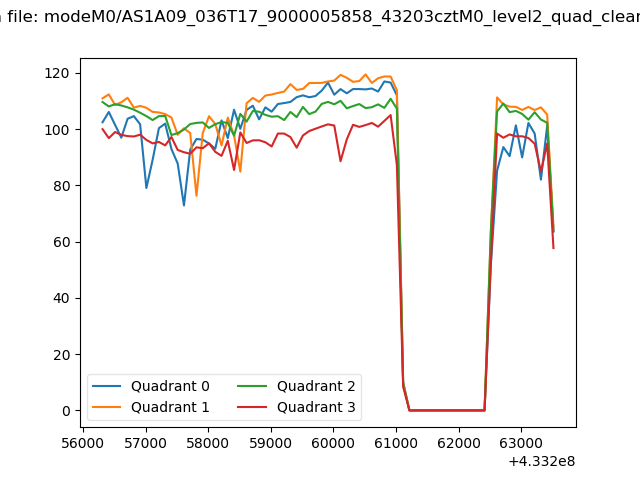 |
|
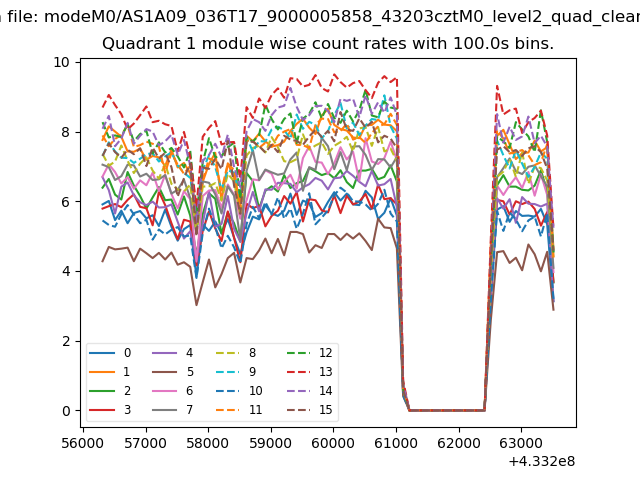
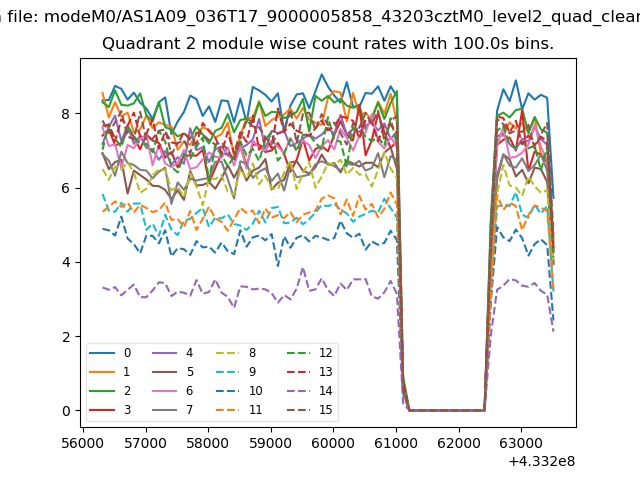
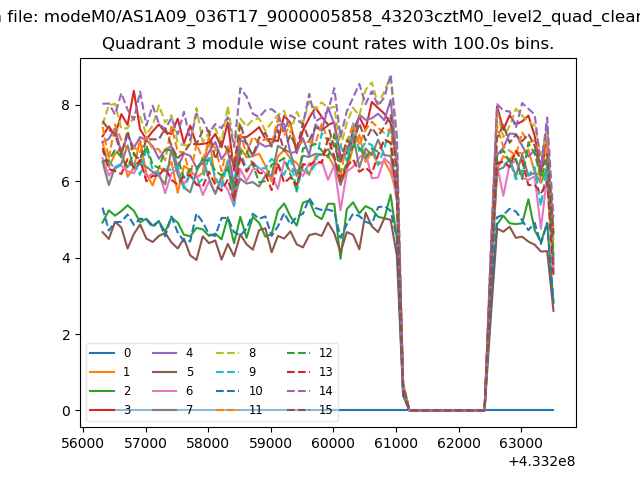
| Module-wise count rates for Quadrant A Data is divided into 100 sec bins |
 |
 |
| Module-wise count rates for Quadrant B Data is divided into 100 sec bins |
 |
 |
| Module-wise count rates for Quadrant C Data is divided into 100 sec bins |
 |
 |
| Module-wise count rates for Quadrant D Data is divided into 100 sec bins |
 |
 |
| Parameter | Plot |
|---|---|
| CZT HV Monitor | 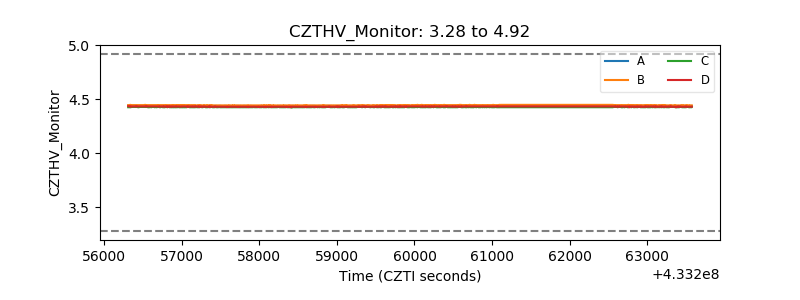 |
| D_VDD | 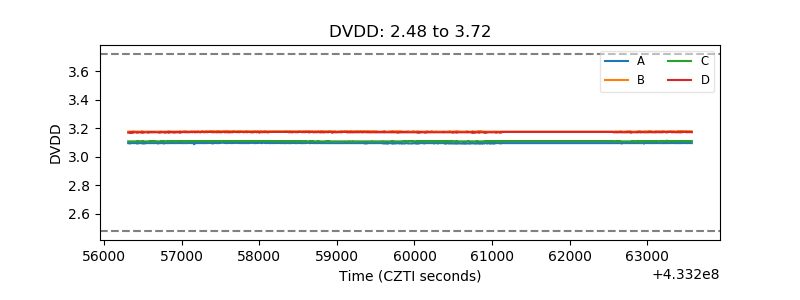 |
| Temperature 1 | 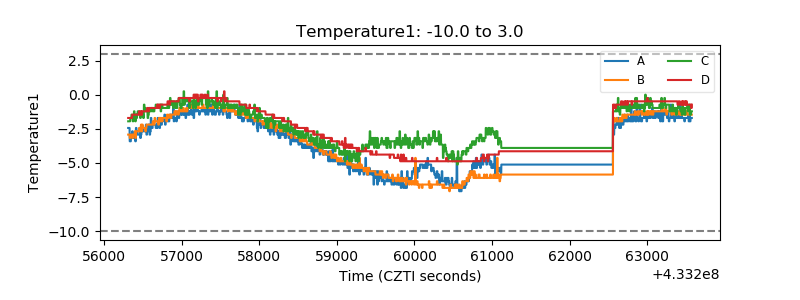 |
| Veto HV Monitor | 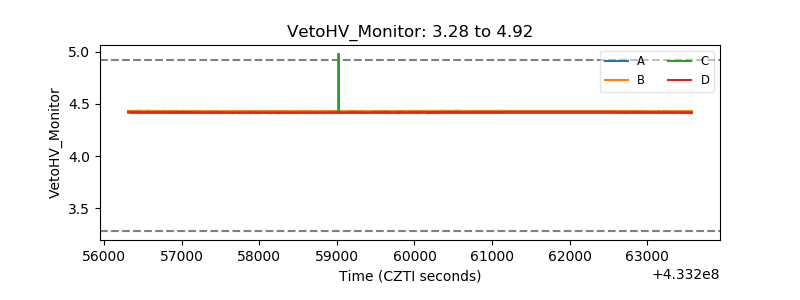 |
| Veto LLD | 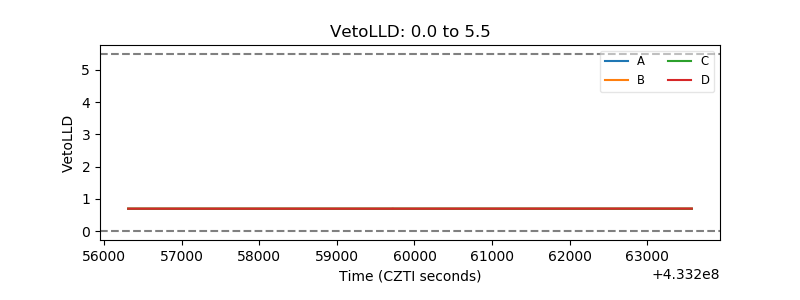 |
| Alpha Counter | 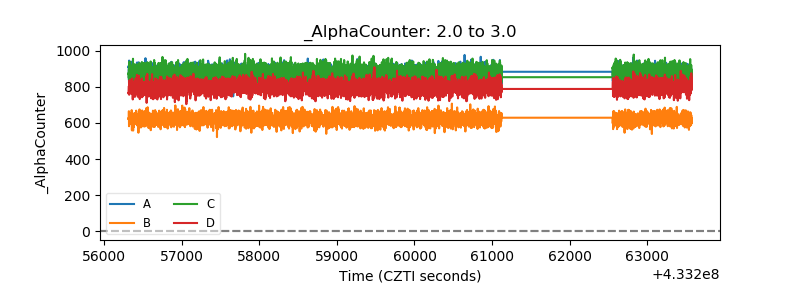 |
| _CPM_Rate | 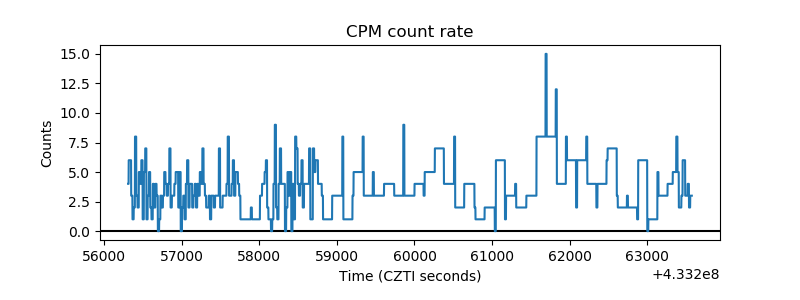 |
| CZT Counter | 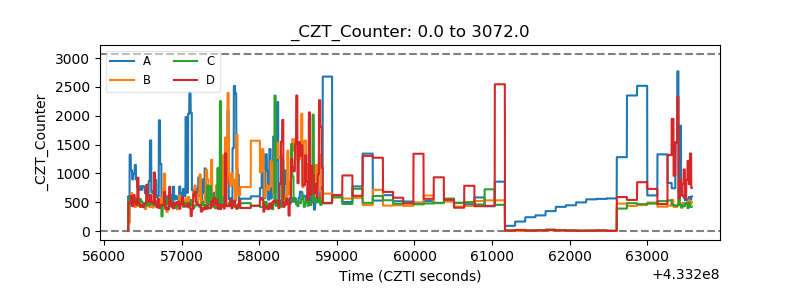 |
| +2.5 Volts monitor | 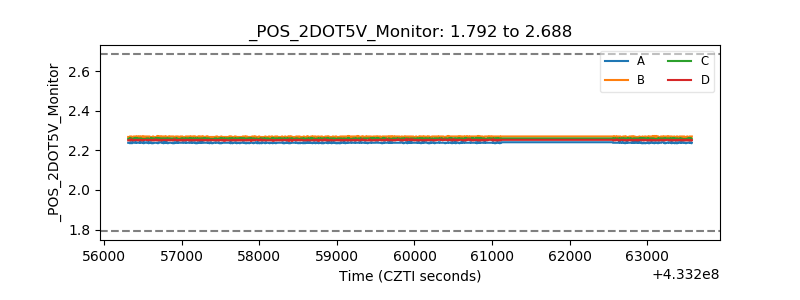 |
| +5 Volts monitor | 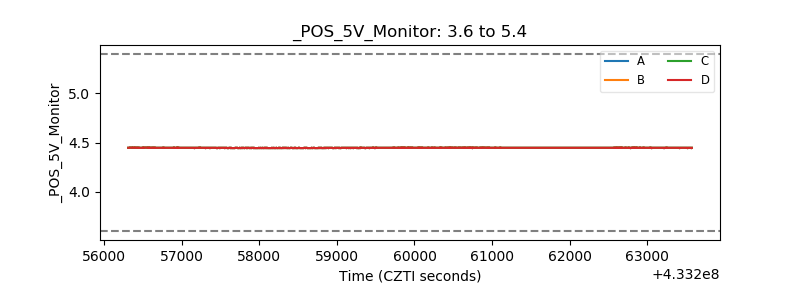 |
| _ROLL_ROT | 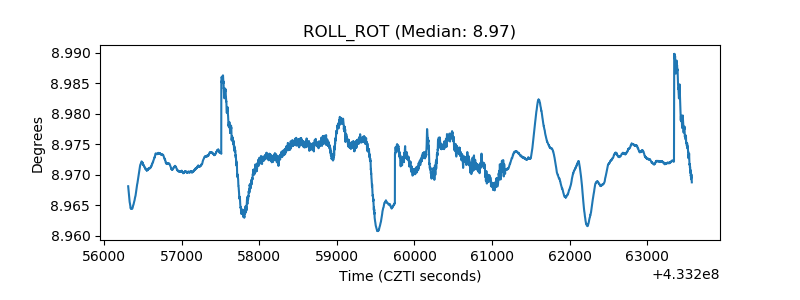 |
| _Roll_DEC | 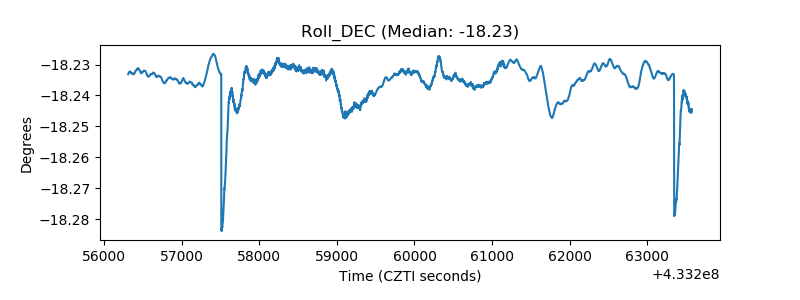 |
| _Roll_RA | 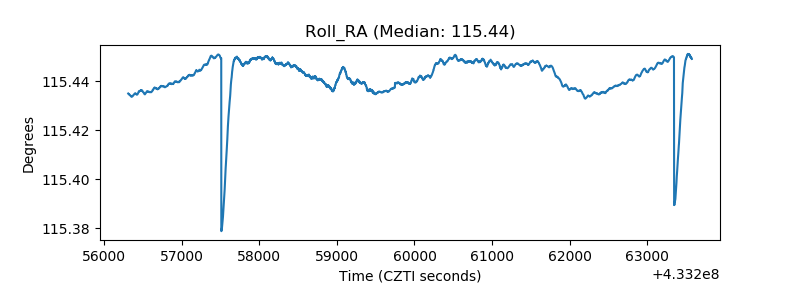 |
| Veto Counter | 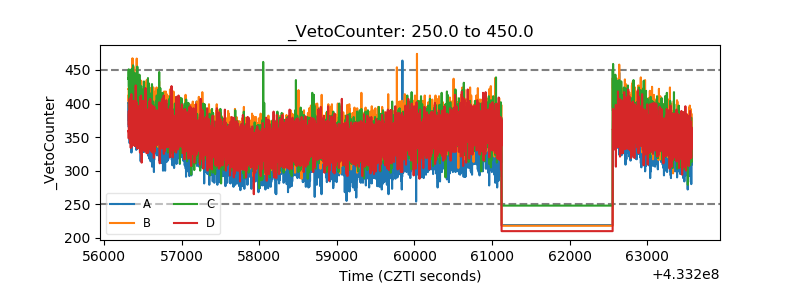 |