| Param | Original file | Final file |
|---|---|---|
| Filename | modeM0/AS1A09_036T17_9000005858_43204cztM0_level2.fits | modeM0/AS1A09_036T17_9000005858_43204cztM0_level2_quad_clean.evt |
| Size (bytes) | 405,230,400 | 92,845,440 |
| Size | 386.5 MB | 88.5 MB |
| Events in quadrant A | 3,999,721 | 608,325 |
| Events in quadrant B | 2,792,354 | 642,274 |
| Events in quadrant C | 2,896,007 | 610,138 |
| Events in quadrant D | 4,859,976 | 543,787 |
| Mode M0 | |||
|---|---|---|---|
| Quadrant | BADHDUFLAG | Total packets | Discarded packets |
| A | 0 | 15382 | 2 |
| B | 0 | 12087 | 2 |
| C | 0 | 12268 | 2 |
| D | 0 | 18361 | 2 |
| Mode SS | |||
|---|---|---|---|
| Quadrant | BADHDUFLAG | Total packets | Discarded packets |
| A | 0 | 118 | 0 |
| B | 0 | 118 | 0 |
| C | 0 | 118 | 0 |
| D | 0 | 118 | 0 |
| Mode M9 | |||
|---|---|---|---|
| Quadrant | BADHDUFLAG | Total packets | Discarded packets |
| A | 0 | 14 | 0 |
| B | 0 | 15 | 0 |
| C | 0 | 15 | 0 |
| D | 0 | 15 | 0 |
| Quadrant | Total seconds | Saturated seconds | Saturation percentage |
|---|---|---|---|
| A | 5815 | 238 | 4.092863% |
| B | 5815 | 9 | 0.154772% |
| C | 5815 | 31 | 0.533104% |
| D | 5815 | 345 | 5.932932% |
Noise dominated data is calculated using 1-second bins in cleaned event files. If a bin has >2000 counts, and if more than 50% of those come from <1% of pixels, then it is considered to be noise-dominated and hence unusable.
| Quadrant | # 1 sec bins | Bins with >0 counts | Bins with >2000 counts | High rate bins dominated by noise | Noise dominated (total time) | Noise dominated (detector-on time) | Marked lightcurve |
|---|---|---|---|---|---|---|---|
| A | 7128 | 5816 | 179 | 179 | 2.51% | 3.08% |  |
| B | 7128 | 5816 | 3 | 3 | 0.04% | 0.05% | 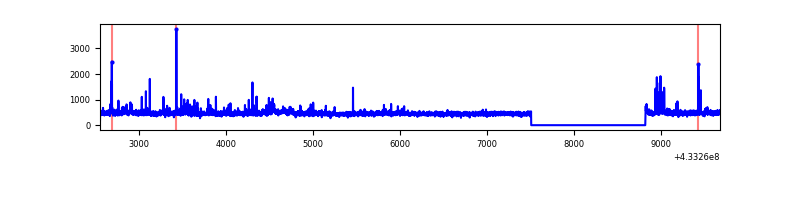 |
| C | 7128 | 5816 | 26 | 26 | 0.36% | 0.45% |  |
| D | 7128 | 5816 | 355 | 355 | 4.98% | 6.10% | 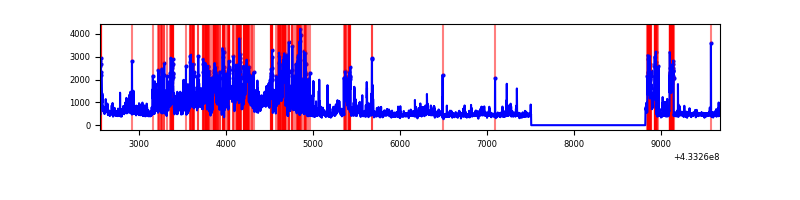 |
Top three noisy pixels from each quadrant. If the there are fewer than three noisy pixels in the level2.evt file, extra rows are filled as -1
| Pixel properties | Quadrant properties | ||||||
|---|---|---|---|---|---|---|---|
| Quadrant | DetID | PixID | Counts | Sigma | Mean | Median | Sigma |
| A | 10 | 83 | 656450 | 5071.08 | 627 | 614 | 129.3 |
| A | 15 | 237 | 652823 | 5043.03 | 627 | 614 | 129.3 |
| A | 13 | 248 | 152391 | 1173.58 | 627 | 614 | 129.3 |
| B | 0 | 229 | 162297 | 1315.43 | 636 | 619 | 122.9 |
| B | 0 | 186 | 42106 | 337.54 | 636 | 619 | 122.9 |
| B | 3 | 112 | 32961 | 263.14 | 636 | 619 | 122.9 |
| C | 15 | 214 | 243510 | 1654.29 | 622 | 623 | 146.8 |
| C | 14 | 254 | 175600 | 1191.76 | 622 | 623 | 146.8 |
| C | 4 | 254 | 30380 | 202.67 | 622 | 623 | 146.8 |
| D | 1 | 52 | 2104777 | 13750.26 | 614 | 596 | 153.0 |
| D | 12 | 16 | 253128 | 1650.23 | 614 | 596 | 153.0 |
| D | 7 | 96 | 44640 | 287.82 | 614 | 596 | 153.0 |
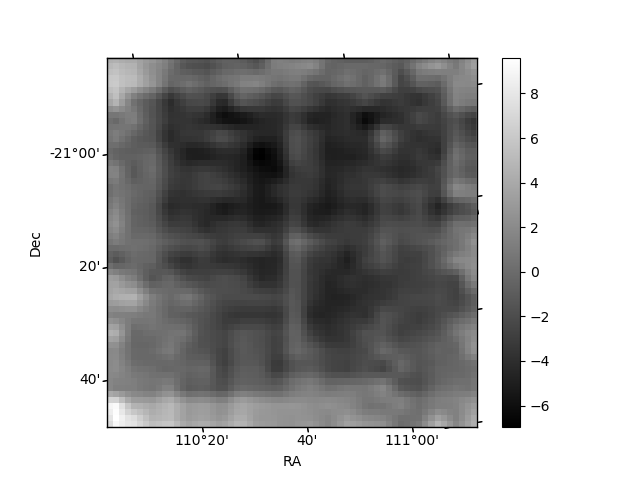
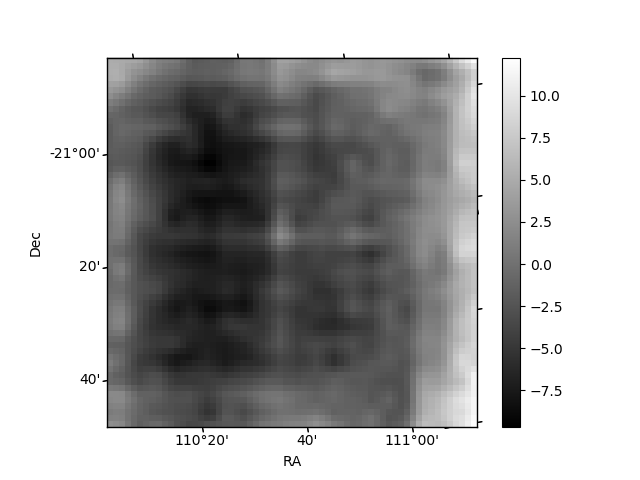
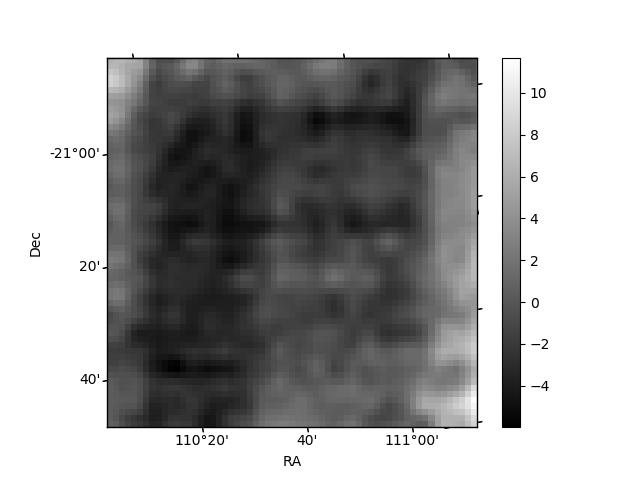
Histogram calculated using DETX and DETY for each event in the final _common_clean file
| Quadrant A | 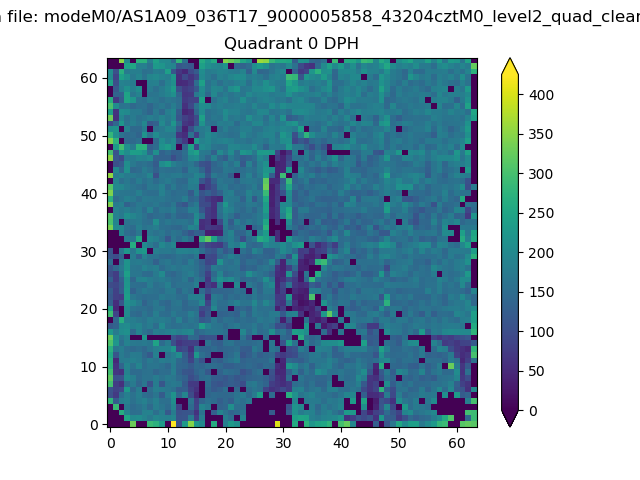 |
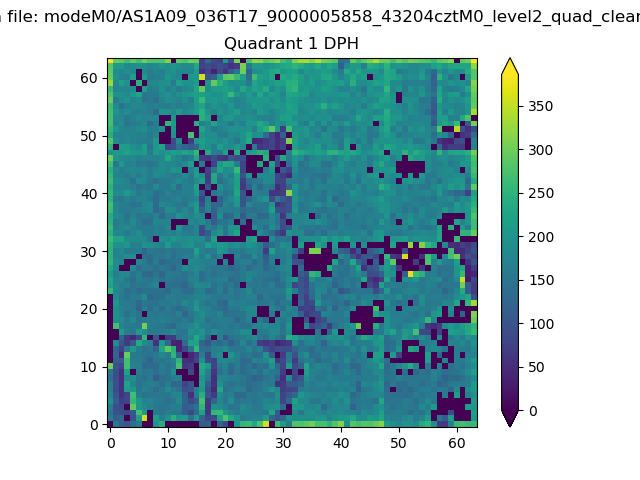 |
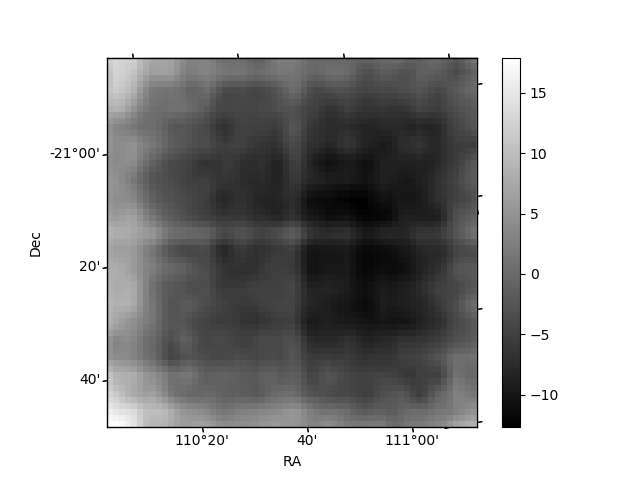
Quadrant B |
|---|---|---|---|
| Quadrant D | 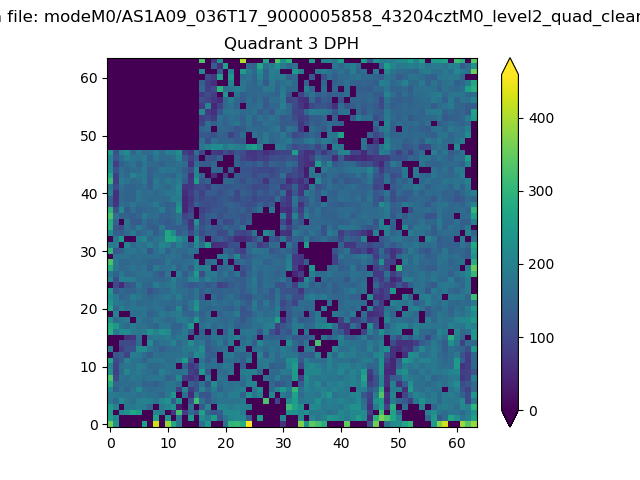 |
 |
Quadrant C |
| Plot type | Count rate plots | Images |
|---|---|---|
| Comparison with Poisson distribution Blue bars denote a histogram of data divided into 1 sec bins. Red curve is a Poisson curve with rate = median count rate of data. |
 |
 |
| Quadrant-wise count rates Data is divided into 100 sec bins |
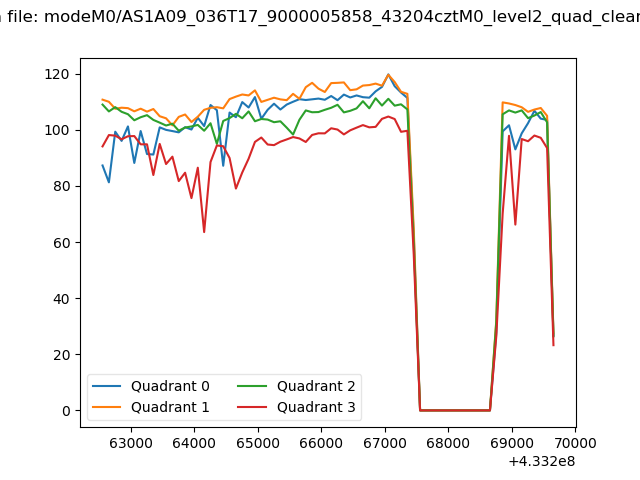 |
|
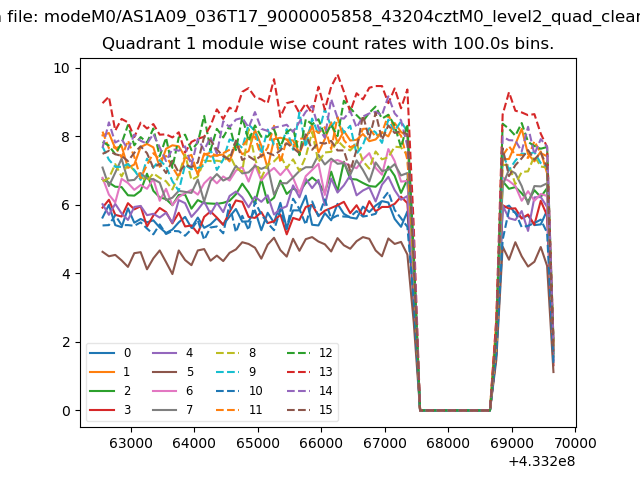
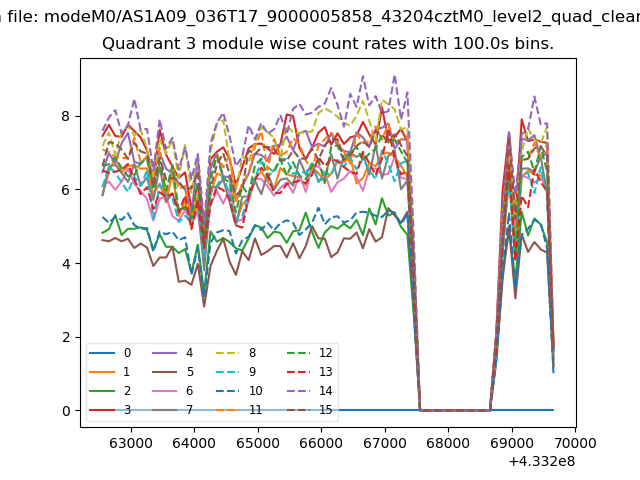
| Module-wise count rates for Quadrant A Data is divided into 100 sec bins |
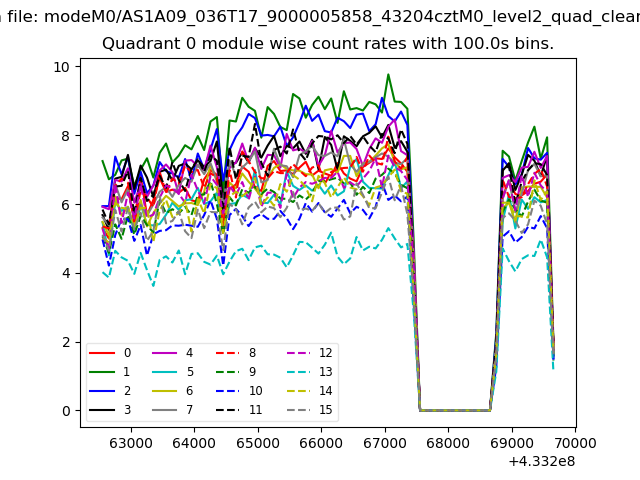 |
 |
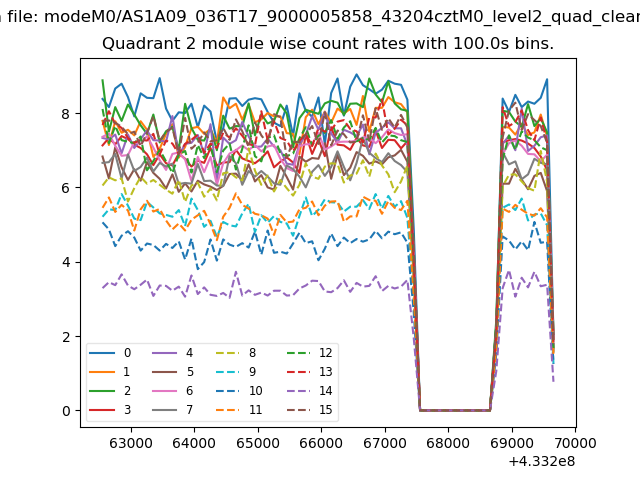
| Module-wise count rates for Quadrant B Data is divided into 100 sec bins |
 |
 |
| Module-wise count rates for Quadrant C Data is divided into 100 sec bins |
 |
 |
| Module-wise count rates for Quadrant D Data is divided into 100 sec bins |
 |
 |
| Parameter | Plot |
|---|---|
| CZT HV Monitor | 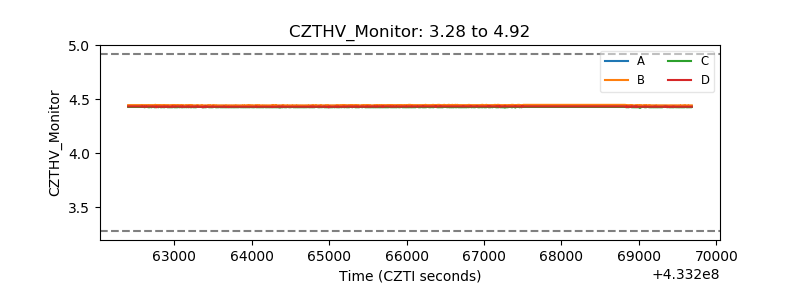 |
| D_VDD | 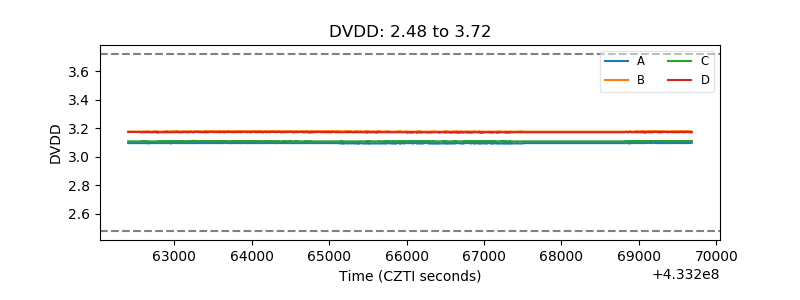 |
| Temperature 1 | 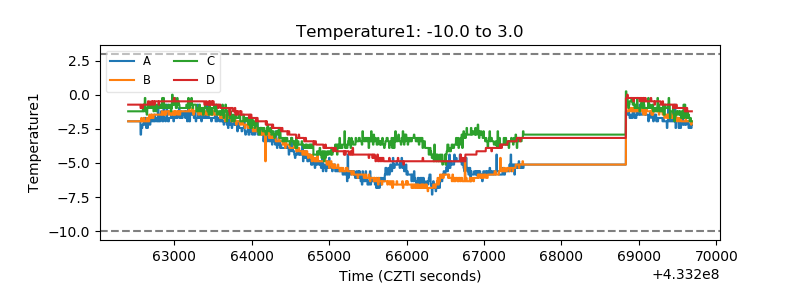 |
| Veto HV Monitor | 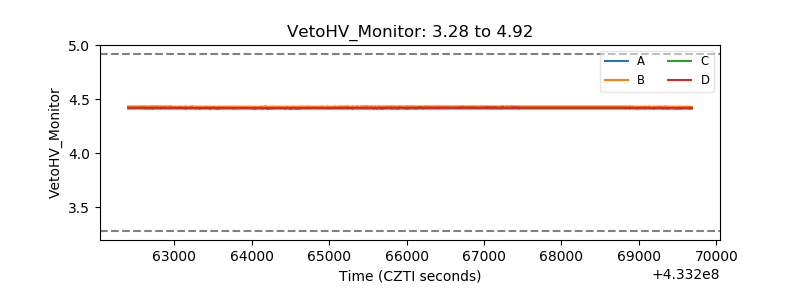 |
| Veto LLD | 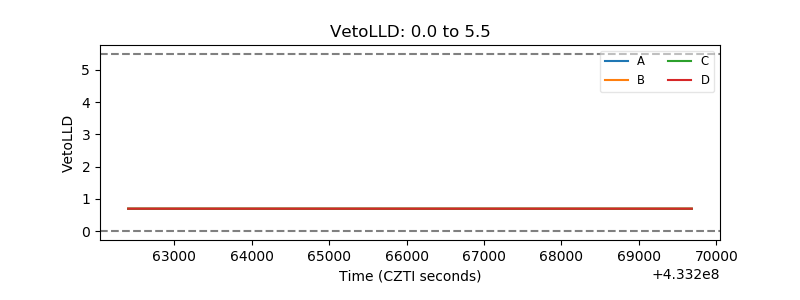 |
| Alpha Counter | 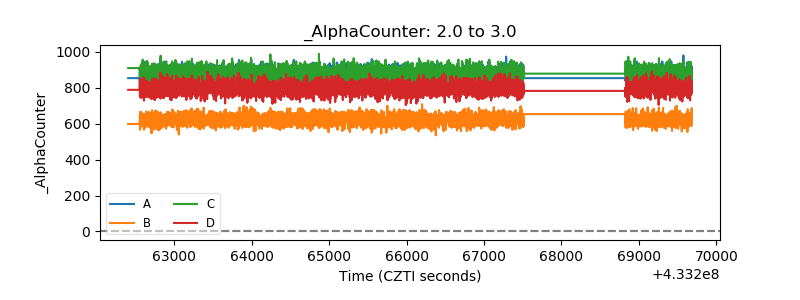 |
| _CPM_Rate | 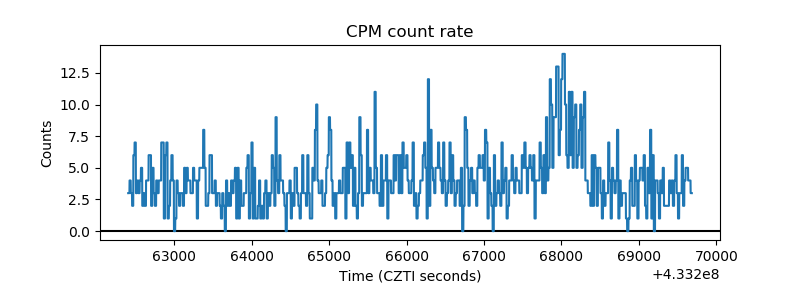 |
| CZT Counter | 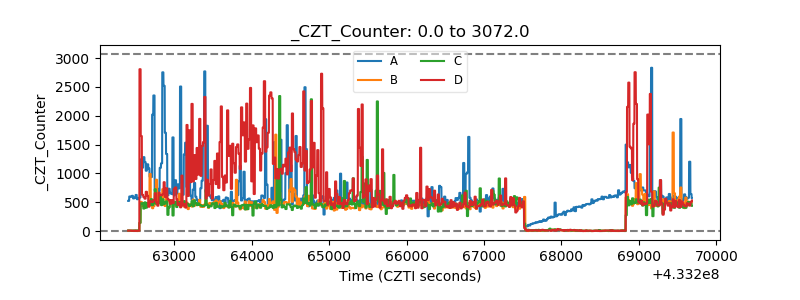 |
| +2.5 Volts monitor | 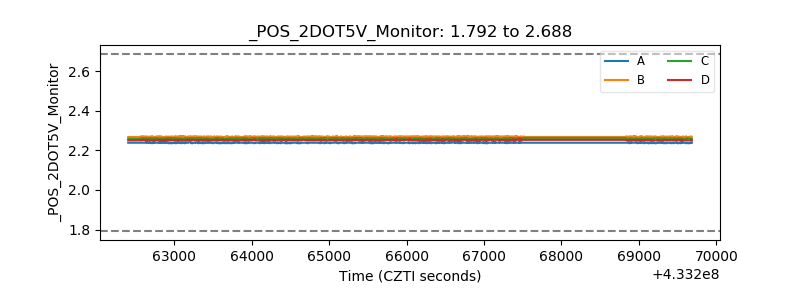 |
| +5 Volts monitor | 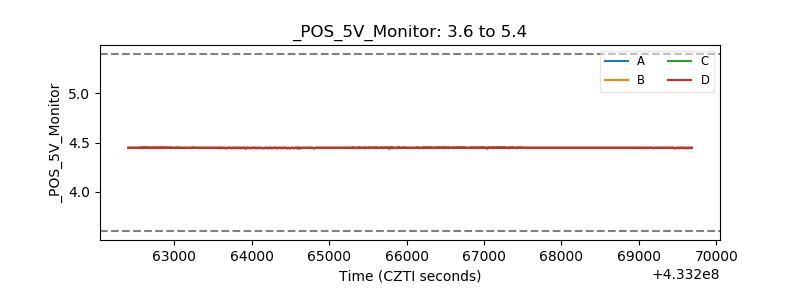 |
| _ROLL_ROT | 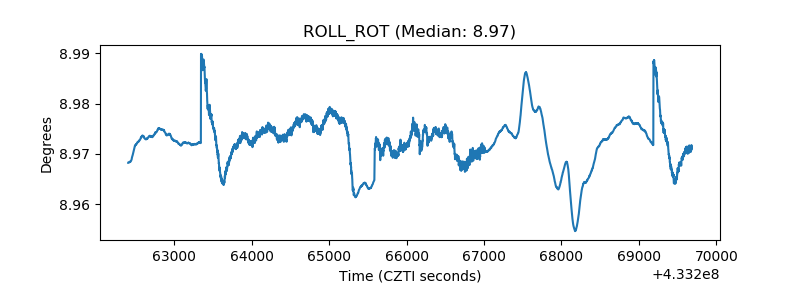 |
| _Roll_DEC | 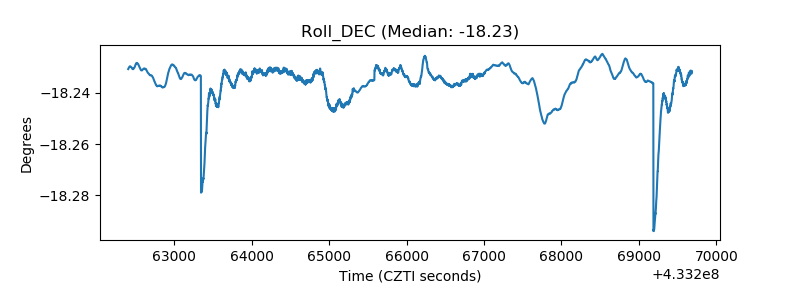 |
| _Roll_RA | 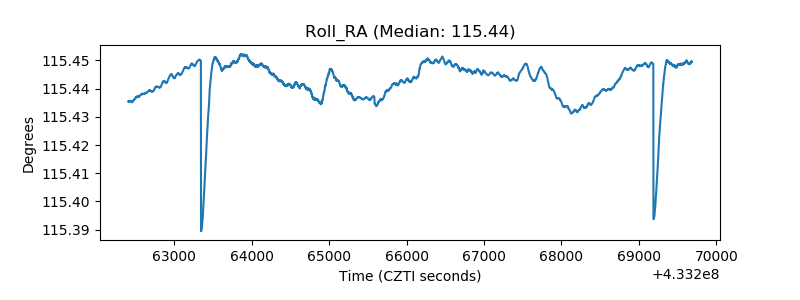 |
| Veto Counter | 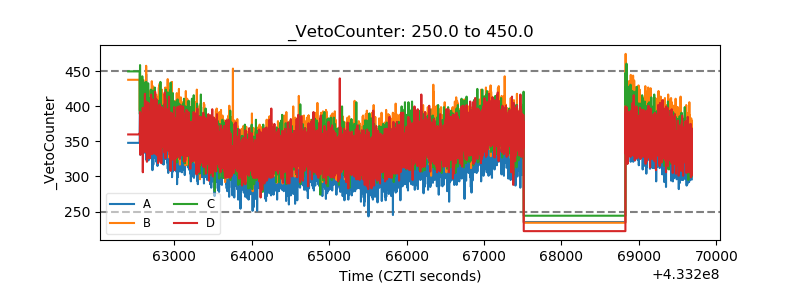 |