| Param | Original file | Final file |
|---|---|---|
| Filename | modeM0/AS1A09_036T17_9000005858_43207cztM0_level2.fits | modeM0/AS1A09_036T17_9000005858_43207cztM0_level2_quad_clean.evt |
| Size (bytes) | 953,844,480 | 250,634,880 |
| Size | 909.7 MB | 239.0 MB |
| Events in quadrant A | 10,051,829 | 1,659,809 |
| Events in quadrant B | 7,646,722 | 1,719,594 |
| Events in quadrant C | 7,598,508 | 1,635,251 |
| Events in quadrant D | 8,799,403 | 1,494,670 |
| Mode M0 | |||
|---|---|---|---|
| Quadrant | BADHDUFLAG | Total packets | Discarded packets |
| A | 0 | 39606 | 4 |
| B | 0 | 33335 | 4 |
| C | 0 | 32463 | 5 |
| D | 0 | 37173 | 4 |
| Mode SS | |||
|---|---|---|---|
| Quadrant | BADHDUFLAG | Total packets | Discarded packets |
| A | 0 | 318 | 0 |
| B | 0 | 318 | 0 |
| C | 0 | 318 | 0 |
| D | 0 | 318 | 0 |
| Mode M9 | |||
|---|---|---|---|
| Quadrant | BADHDUFLAG | Total packets | Discarded packets |
| A | 0 | 42 | 0 |
| B | 0 | 42 | 0 |
| C | 0 | 42 | 0 |
| D | 0 | 42 | 0 |
| Quadrant | Total seconds | Saturated seconds | Saturation percentage |
|---|---|---|---|
| A | 15640 | 410 | 2.621483% |
| B | 15641 | 149 | 0.952625% |
| C | 15640 | 68 | 0.434783% |
| D | 15640 | 298 | 1.905371% |
Noise dominated data is calculated using 1-second bins in cleaned event files. If a bin has >2000 counts, and if more than 50% of those come from <1% of pixels, then it is considered to be noise-dominated and hence unusable.
| Quadrant | # 1 sec bins | Bins with >0 counts | Bins with >2000 counts | High rate bins dominated by noise | Noise dominated (total time) | Noise dominated (detector-on time) | Marked lightcurve |
|---|---|---|---|---|---|---|---|
| A | 19817 | 15643 | 282 | 282 | 1.42% | 1.80% | 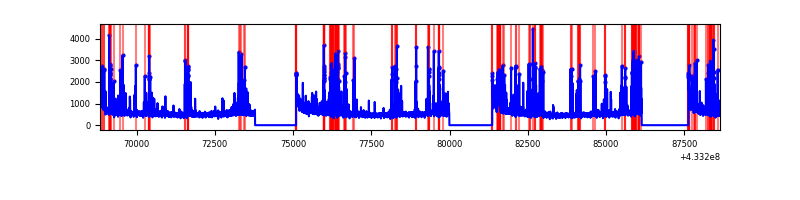 |
| B | 19818 | 15644 | 90 | 90 | 0.45% | 0.58% | 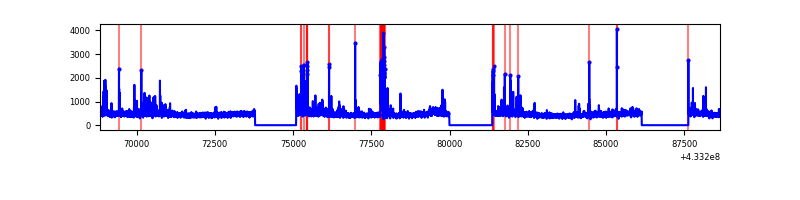 |
| C | 19817 | 15643 | 53 | 53 | 0.27% | 0.34% | 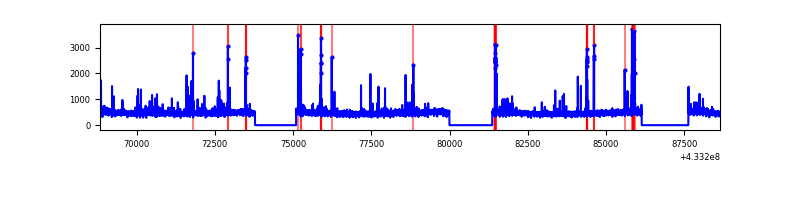 |
| D | 19817 | 15643 | 271 | 271 | 1.37% | 1.73% | 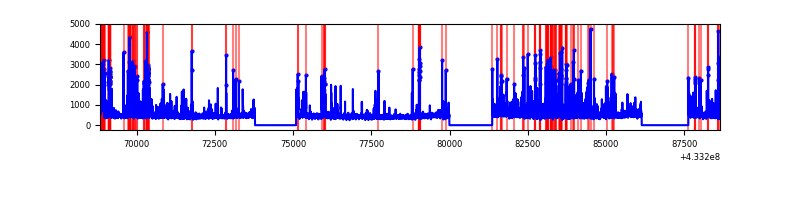 |
Top three noisy pixels from each quadrant. If the there are fewer than three noisy pixels in the level2.evt file, extra rows are filled as -1
| Pixel properties | Quadrant properties | ||||||
|---|---|---|---|---|---|---|---|
| Quadrant | DetID | PixID | Counts | Sigma | Mean | Median | Sigma |
| A | 10 | 83 | 1593478 | 4567.13 | 1700 | 1666 | 348.5 |
| A | 15 | 237 | 1418661 | 4065.56 | 1700 | 1666 | 348.5 |
| A | 2 | 79 | 168229 | 477.89 | 1700 | 1666 | 348.5 |
| B | 0 | 229 | 617813 | 1867.99 | 1708 | 1664 | 329.8 |
| B | 0 | 186 | 103528 | 308.82 | 1708 | 1664 | 329.8 |
| B | 0 | 190 | 66364 | 196.15 | 1708 | 1664 | 329.8 |
| C | 15 | 214 | 638187 | 1610.0 | 1674 | 1685 | 395.3 |
| C | 14 | 254 | 301402 | 758.12 | 1674 | 1685 | 395.3 |
| C | 4 | 254 | 127932 | 319.33 | 1674 | 1685 | 395.3 |
| D | 1 | 52 | 1888571 | 4618.99 | 1666 | 1619 | 408.5 |
| D | 12 | 6 | 157470 | 381.5 | 1666 | 1619 | 408.5 |
| D | 12 | 218 | 85440 | 205.18 | 1666 | 1619 | 408.5 |
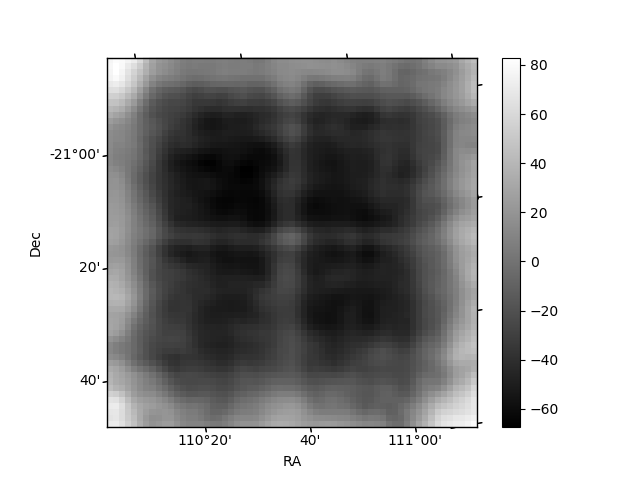
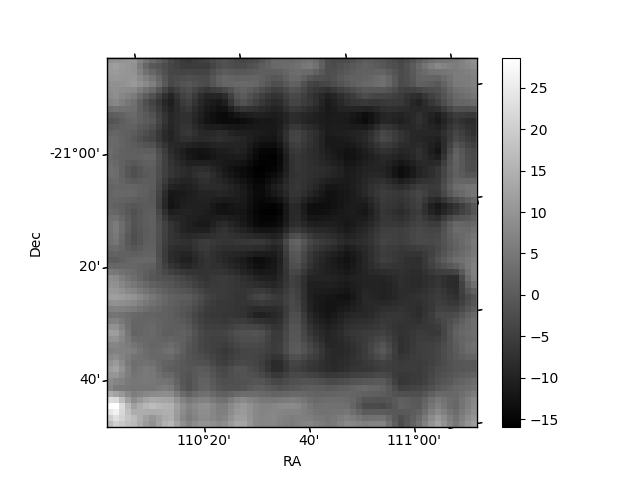
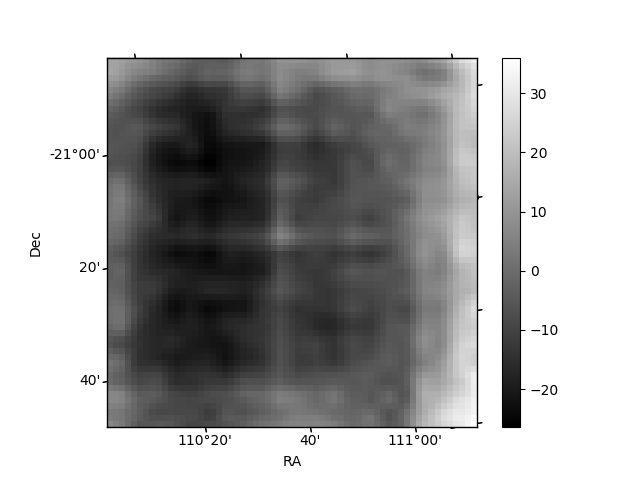
Histogram calculated using DETX and DETY for each event in the final _common_clean file
| Quadrant A | 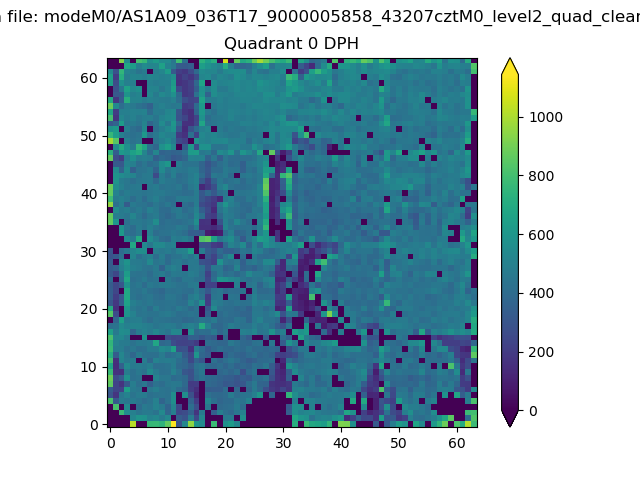 |
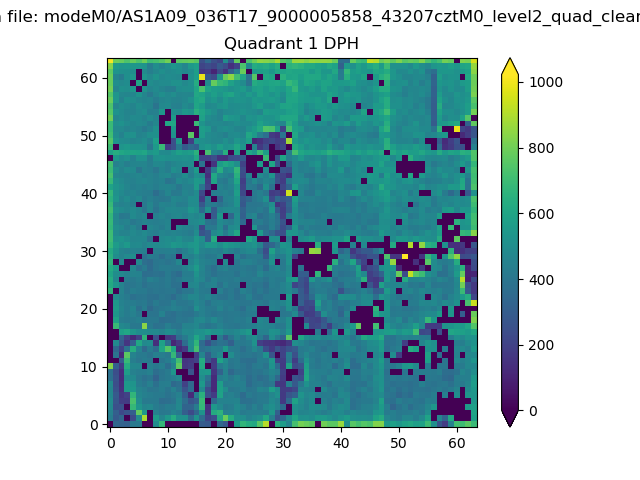 |
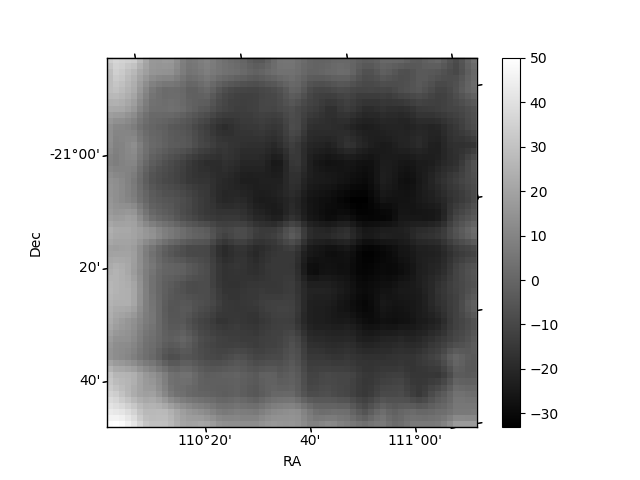
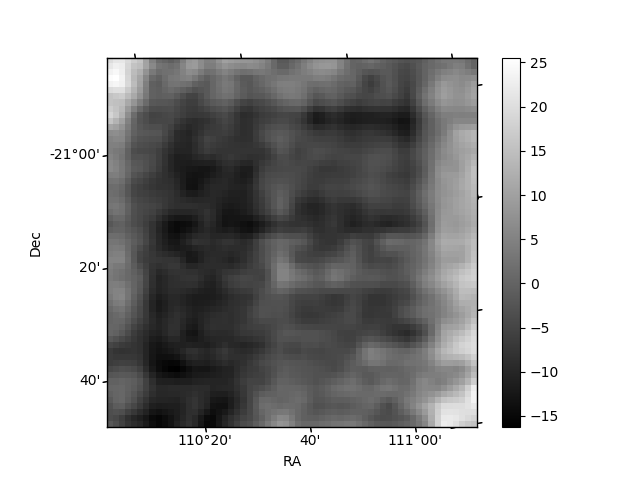
Quadrant B |
|---|---|---|---|
| Quadrant D | 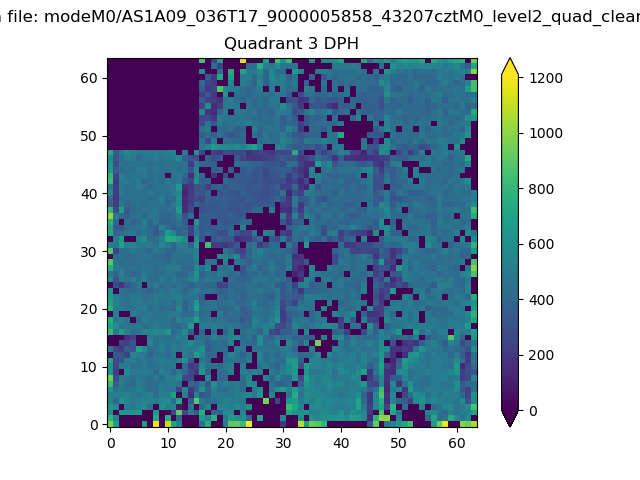 |
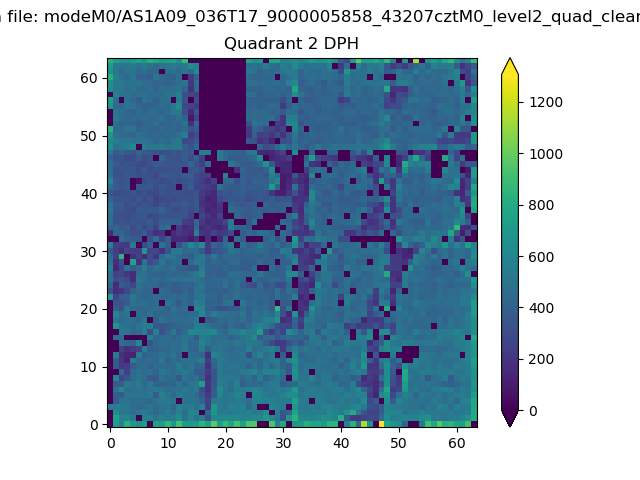 |
Quadrant C |
| Plot type | Count rate plots | Images |
|---|---|---|
| Comparison with Poisson distribution Blue bars denote a histogram of data divided into 1 sec bins. Red curve is a Poisson curve with rate = median count rate of data. |
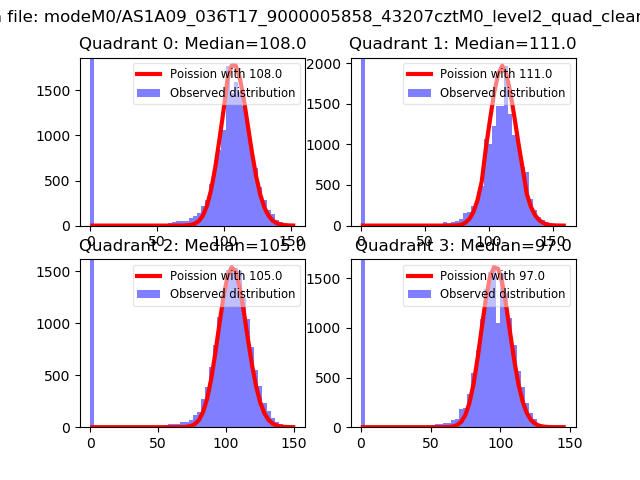 |
 |
| Quadrant-wise count rates Data is divided into 100 sec bins |
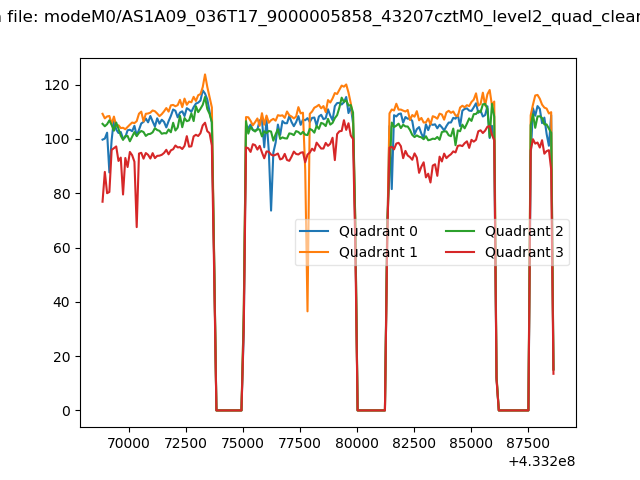 |
|
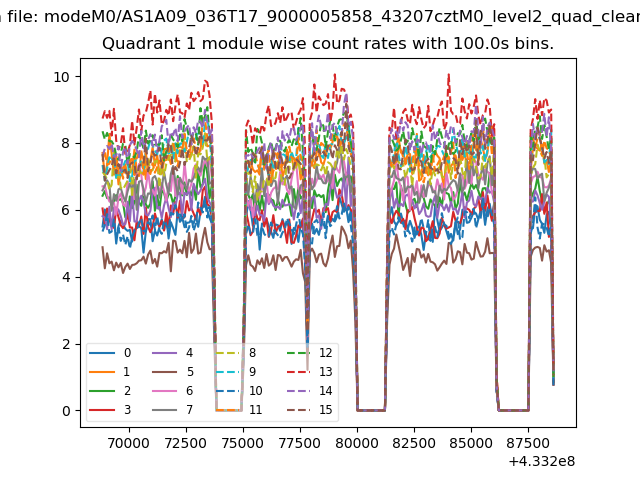
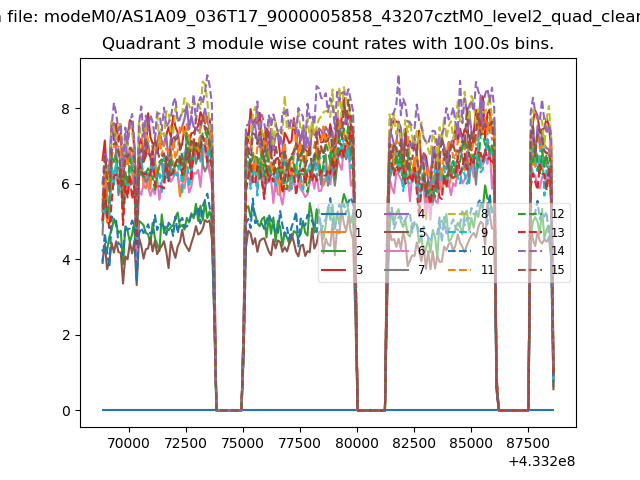
| Module-wise count rates for Quadrant A Data is divided into 100 sec bins |
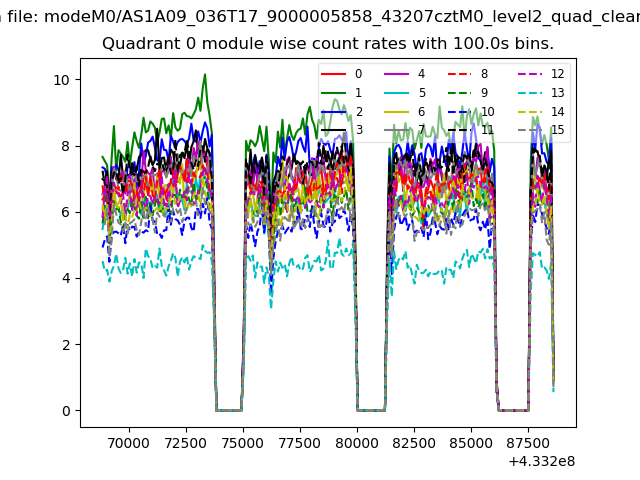 |
 |
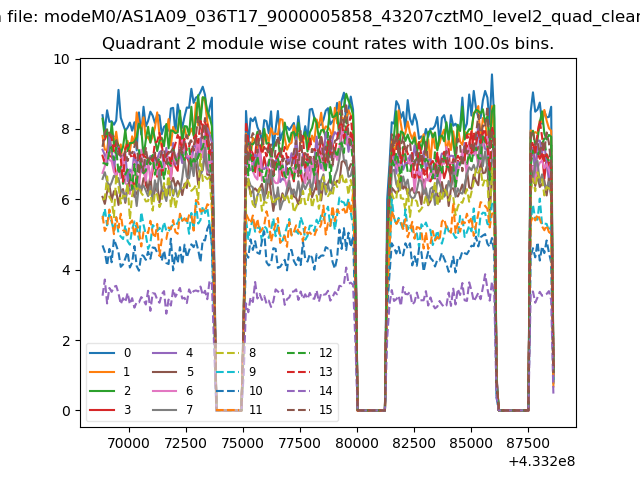
| Module-wise count rates for Quadrant B Data is divided into 100 sec bins |
 |
 |
| Module-wise count rates for Quadrant C Data is divided into 100 sec bins |
 |
 |
| Module-wise count rates for Quadrant D Data is divided into 100 sec bins |
 |
 |
| Parameter | Plot |
|---|---|
| CZT HV Monitor | 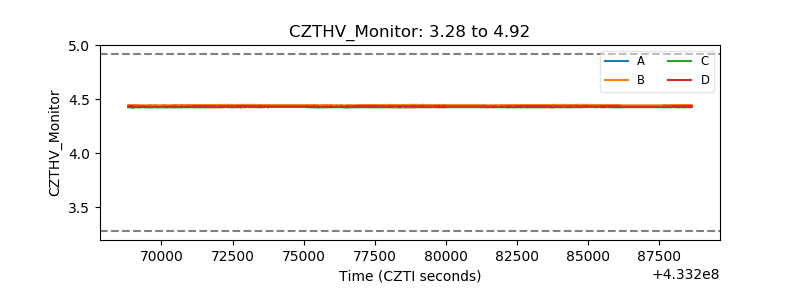 |
| D_VDD | 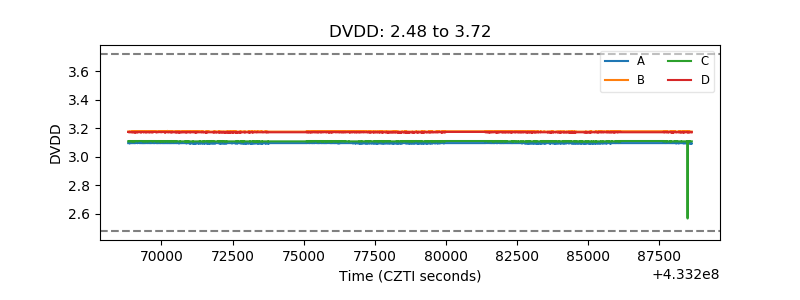 |
| Temperature 1 | 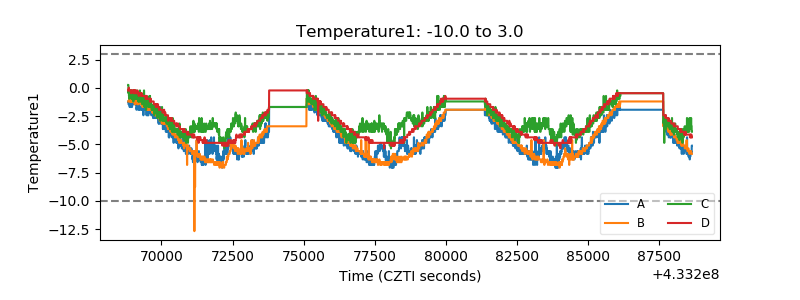 |
| Veto HV Monitor | 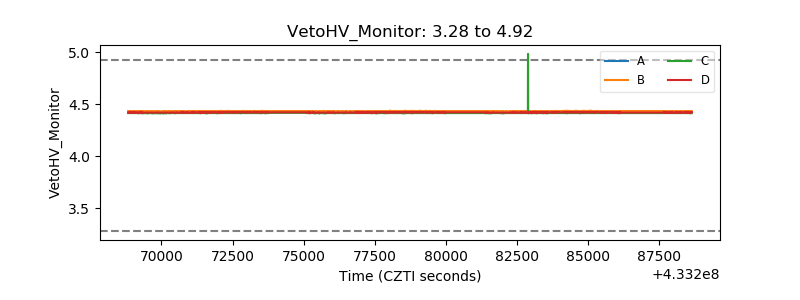 |
| Veto LLD | 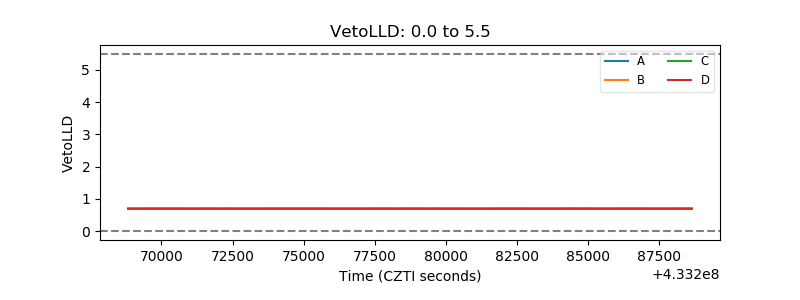 |
| Alpha Counter | 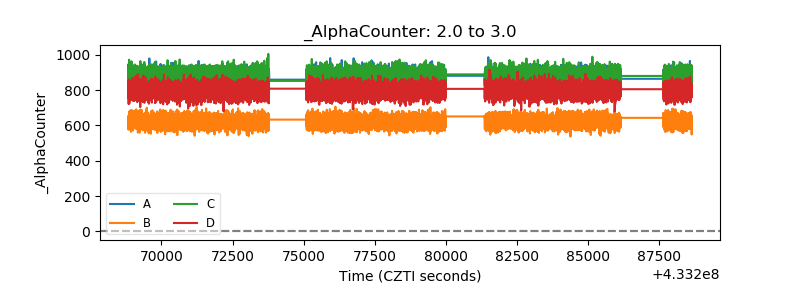 |
| _CPM_Rate | 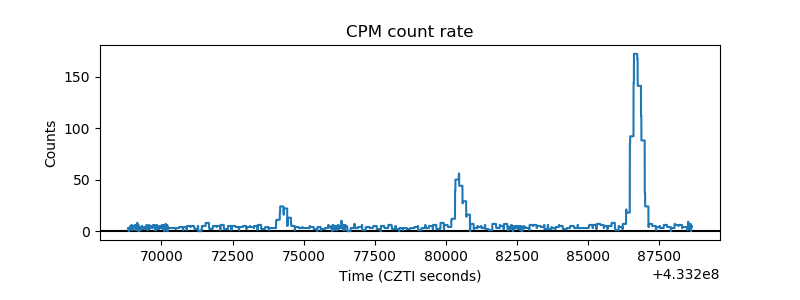 |
| CZT Counter | 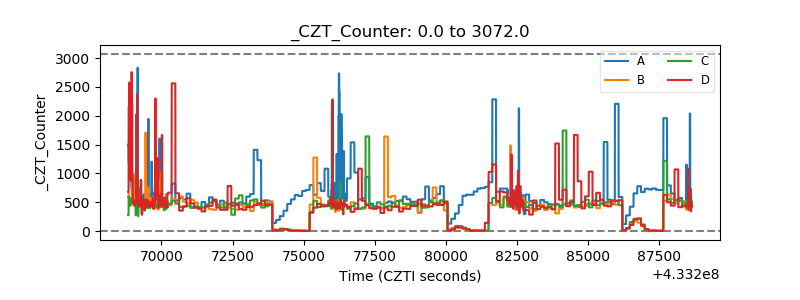 |
| +2.5 Volts monitor | 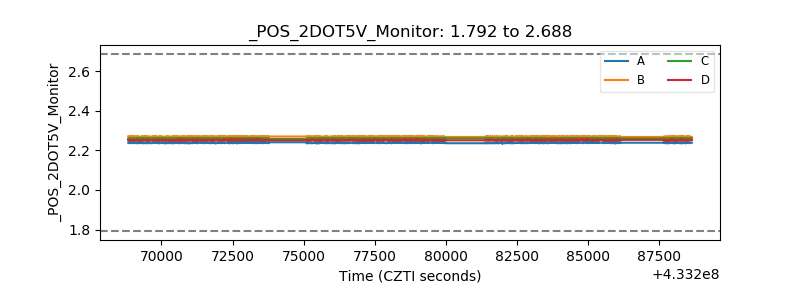 |
| +5 Volts monitor | 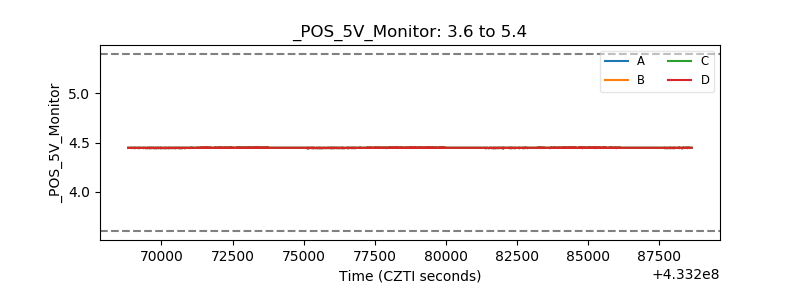 |
| _ROLL_ROT | 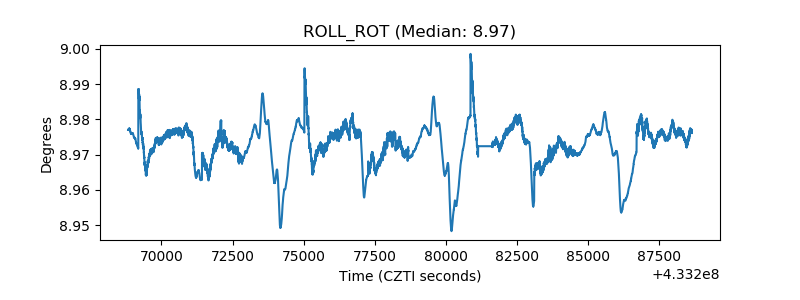 |
| _Roll_DEC | 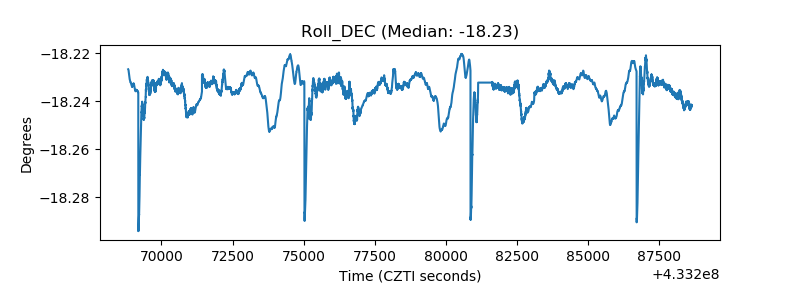 |
| _Roll_RA | 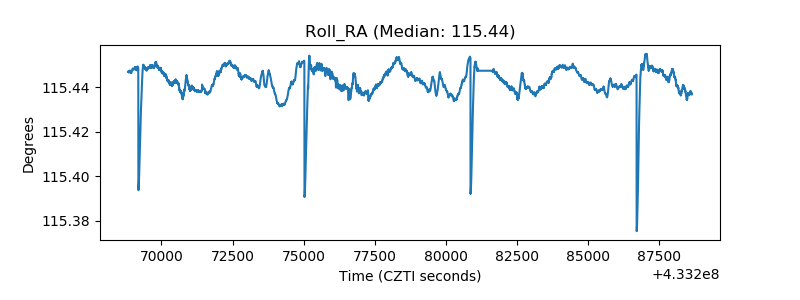 |
| Veto Counter | 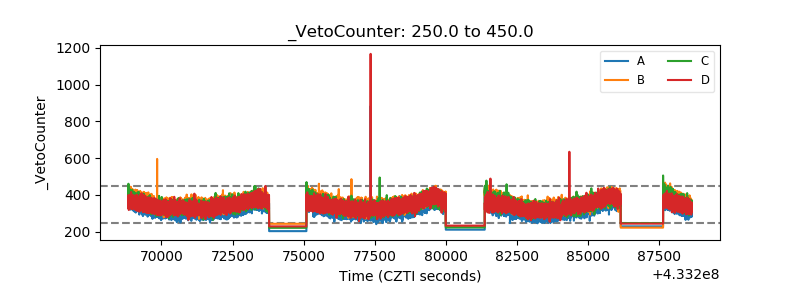 |