| Param | Original file | Final file |
|---|---|---|
| Filename | modeM0/AS1A12_018T01_9000005874_43413cztM0_level2.fits | modeM0/AS1A12_018T01_9000005874_43413cztM0_level2_quad_clean.evt |
| Size (bytes) | 350,435,520 | 86,616,000 |
| Size | 334.2 MB | 82.6 MB |
| Events in quadrant A | 3,254,321 | 574,401 |
| Events in quadrant B | 2,746,746 | 598,711 |
| Events in quadrant C | 2,746,191 | 568,797 |
| Events in quadrant D | 3,813,932 | 511,464 |
| Mode M0 | |||
|---|---|---|---|
| Quadrant | BADHDUFLAG | Total packets | Discarded packets |
| A | 0 | 13025 | 1 |
| B | 0 | 11760 | 1 |
| C | 0 | 11588 | 1 |
| D | 0 | 15095 | 1 |
| Mode M9 | |||
|---|---|---|---|
| Quadrant | BADHDUFLAG | Total packets | Discarded packets |
| A | 0 | 18 | 0 |
| B | 0 | 18 | 0 |
| C | 0 | 18 | 0 |
| D | 0 | 18 | 0 |
| Mode SS | |||
|---|---|---|---|
| Quadrant | BADHDUFLAG | Total packets | Discarded packets |
| A | 0 | 106 | 0 |
| B | 0 | 106 | 0 |
| C | 0 | 106 | 0 |
| D | 0 | 106 | 0 |
| Quadrant | Total seconds | Saturated seconds | Saturation percentage |
|---|---|---|---|
| A | 5276 | 144 | 2.729340% |
| B | 5277 | 37 | 0.701156% |
| C | 5277 | 13 | 0.246352% |
| D | 5277 | 199 | 3.771082% |
Noise dominated data is calculated using 1-second bins in cleaned event files. If a bin has >2000 counts, and if more than 50% of those come from <1% of pixels, then it is considered to be noise-dominated and hence unusable.
| Quadrant | # 1 sec bins | Bins with >0 counts | Bins with >2000 counts | High rate bins dominated by noise | Noise dominated (total time) | Noise dominated (detector-on time) | Marked lightcurve |
|---|---|---|---|---|---|---|---|
| A | 7040 | 5277 | 115 | 115 | 1.63% | 2.18% |  |
| B | 7041 | 5278 | 32 | 32 | 0.45% | 0.61% |  |
| C | 7041 | 5278 | 9 | 9 | 0.13% | 0.17% |  |
| D | 7041 | 5278 | 194 | 194 | 2.76% | 3.68% | 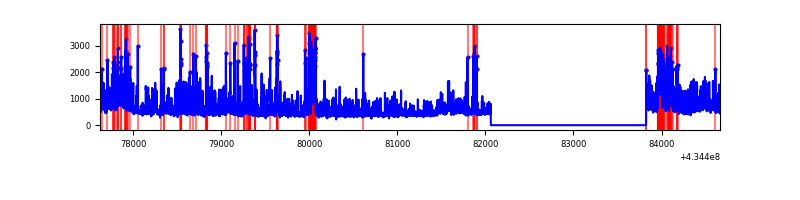 |
Top three noisy pixels from each quadrant. If the there are fewer than three noisy pixels in the level2.evt file, extra rows are filled as -1
| Pixel properties | Quadrant properties | ||||||
|---|---|---|---|---|---|---|---|
| Quadrant | DetID | PixID | Counts | Sigma | Mean | Median | Sigma |
| A | 10 | 83 | 581020 | 4978.28 | 557 | 545 | 116.6 |
| A | 15 | 237 | 469389 | 4020.91 | 557 | 545 | 116.6 |
| A | 13 | 248 | 28498 | 239.73 | 557 | 545 | 116.6 |
| B | 0 | 189 | 259169 | 2405.2 | 565 | 551 | 107.5 |
| B | 0 | 245 | 89511 | 827.35 | 565 | 551 | 107.5 |
| B | 0 | 190 | 70258 | 648.29 | 565 | 551 | 107.5 |
| C | 3 | 233 | 301956 | 2323.92 | 556 | 559 | 129.7 |
| C | 15 | 214 | 216993 | 1668.82 | 556 | 559 | 129.7 |
| C | 15 | 159 | 38653 | 293.72 | 556 | 559 | 129.7 |
| D | 1 | 52 | 485308 | 3670.15 | 546 | 533 | 132.1 |
| D | 2 | 16 | 438524 | 3315.95 | 546 | 533 | 132.1 |
| D | 13 | 249 | 212080 | 1601.59 | 546 | 533 | 132.1 |
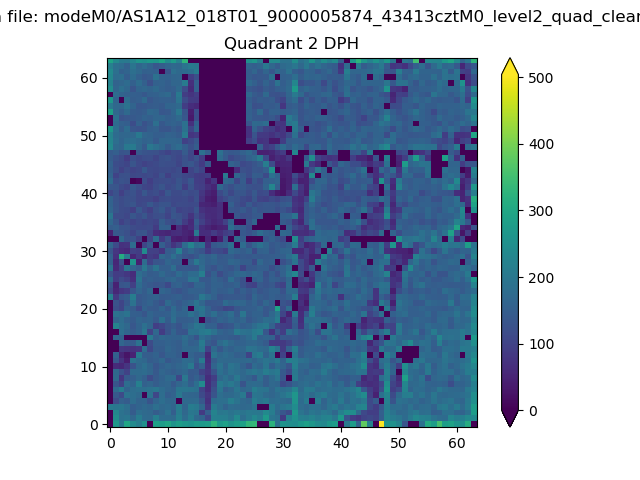
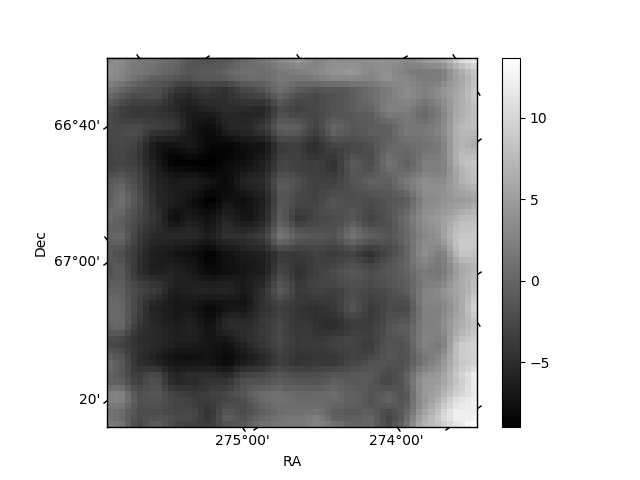
Histogram calculated using DETX and DETY for each event in the final _common_clean file
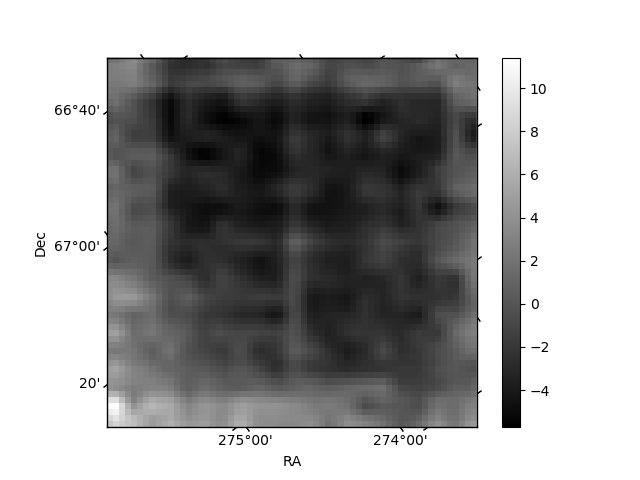
| Quadrant A | 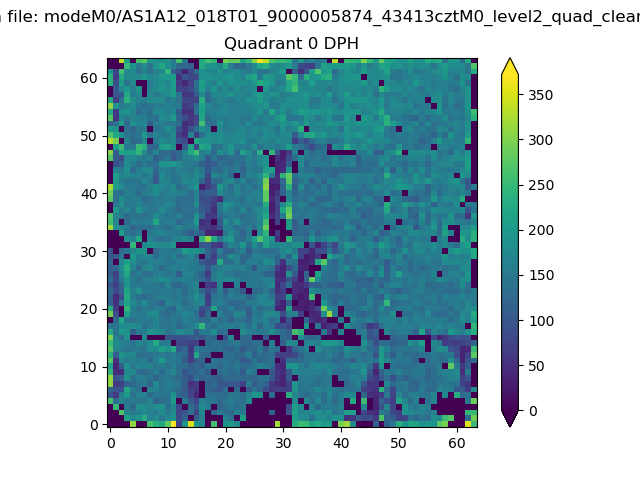 |
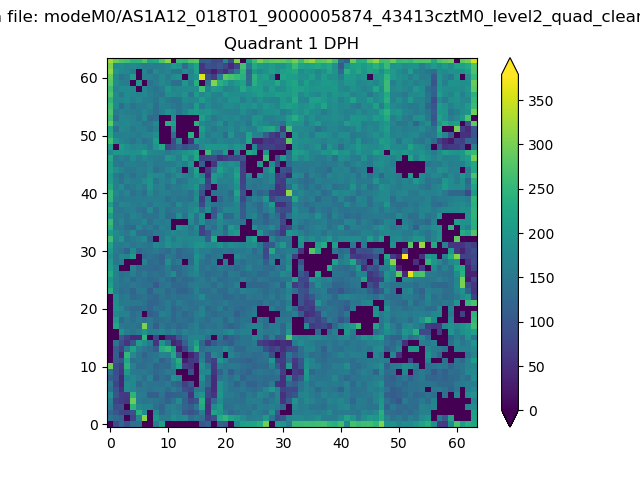 |
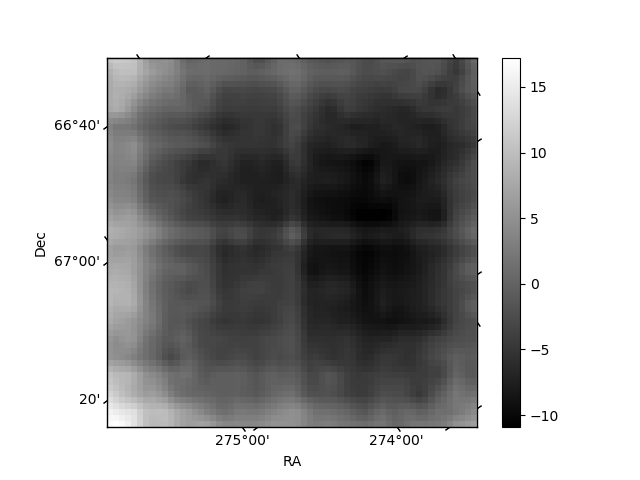
Quadrant B |
|---|---|---|---|
| Quadrant D | 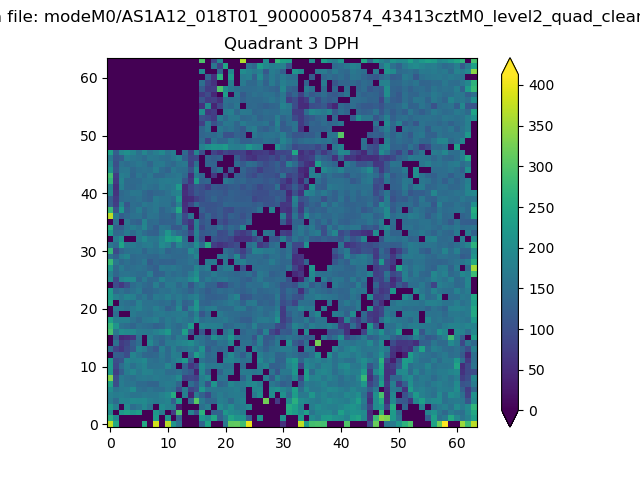 |
 |
Quadrant C |
| Plot type | Count rate plots | Images |
|---|---|---|
| Comparison with Poisson distribution Blue bars denote a histogram of data divided into 1 sec bins. Red curve is a Poisson curve with rate = median count rate of data. |
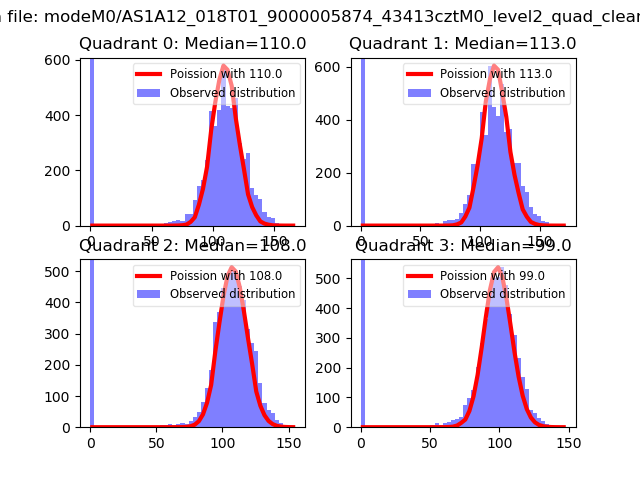 |
 |
| Quadrant-wise count rates Data is divided into 100 sec bins |
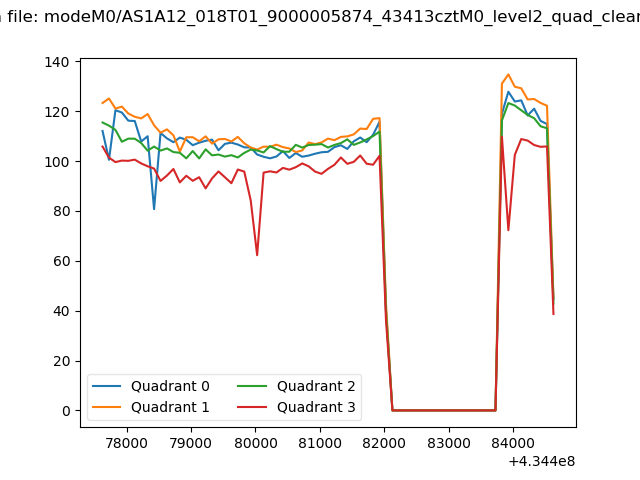 |
|
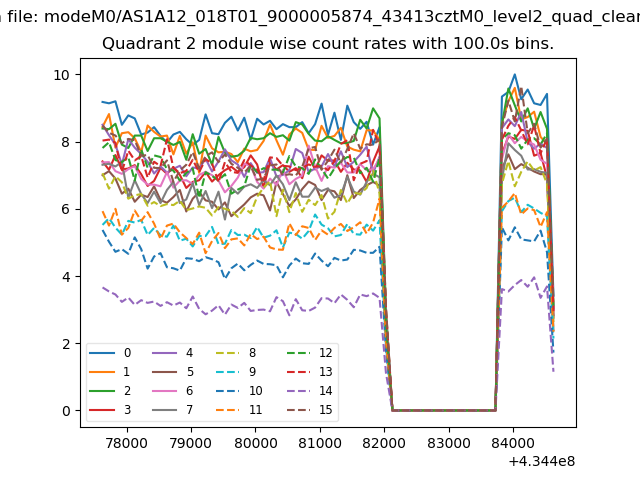
| Module-wise count rates for Quadrant A Data is divided into 100 sec bins |
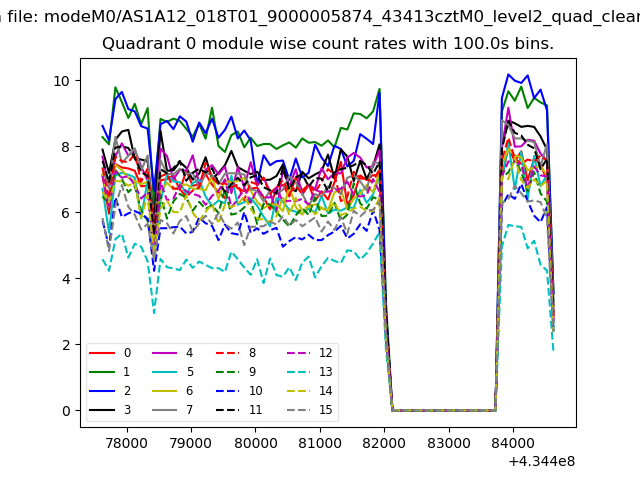 |
 |
| Module-wise count rates for Quadrant B Data is divided into 100 sec bins |
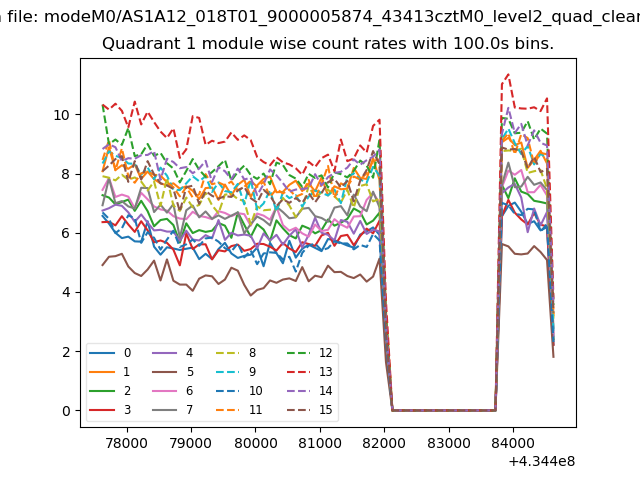 |
 |
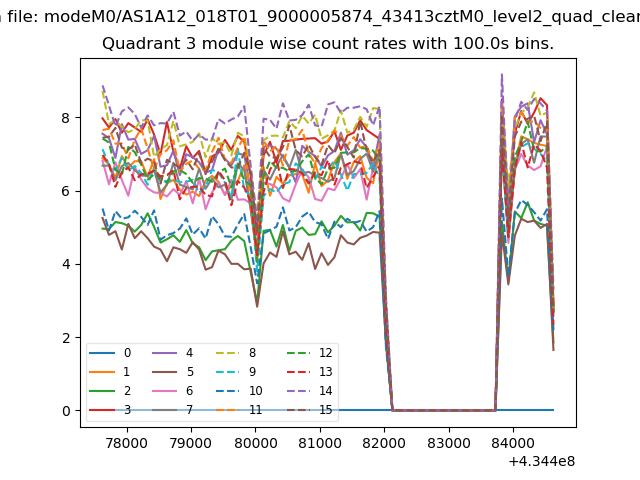
| Module-wise count rates for Quadrant C Data is divided into 100 sec bins |
 |
 |
| Module-wise count rates for Quadrant D Data is divided into 100 sec bins |
 |
 |
| Parameter | Plot |
|---|---|
| CZT HV Monitor | 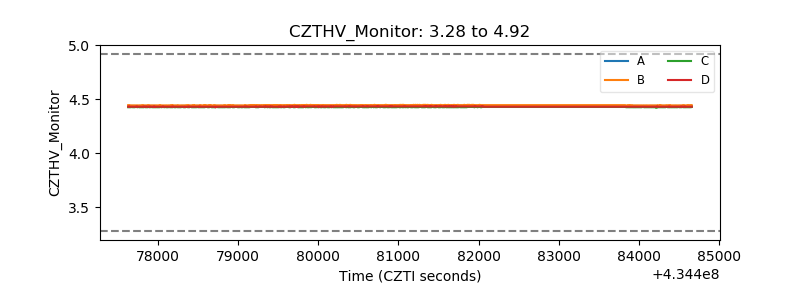 |
| D_VDD | 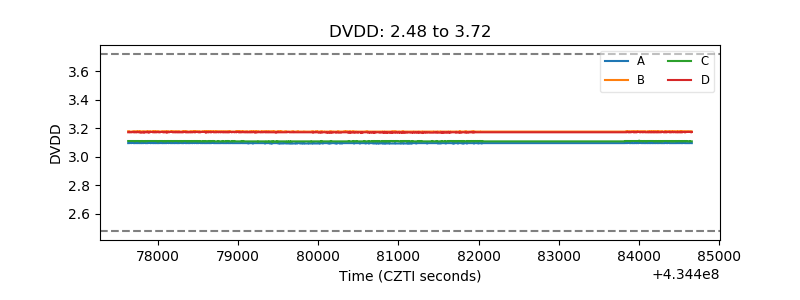 |
| Temperature 1 | 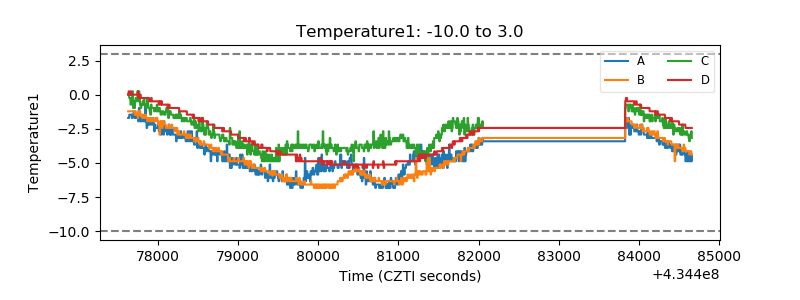 |
| Veto HV Monitor | 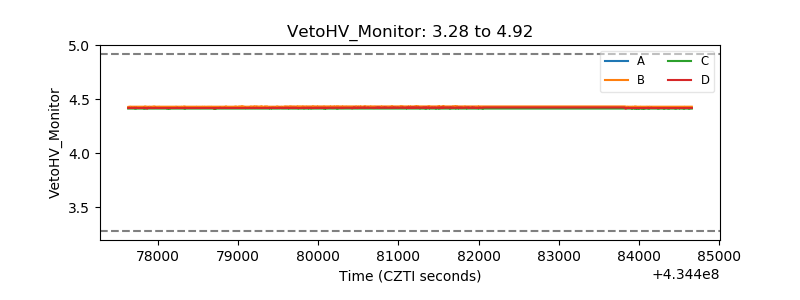 |
| Veto LLD |  |
| Alpha Counter | 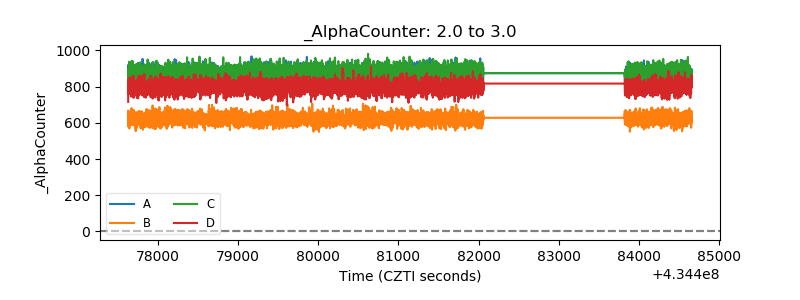 |
| _CPM_Rate | 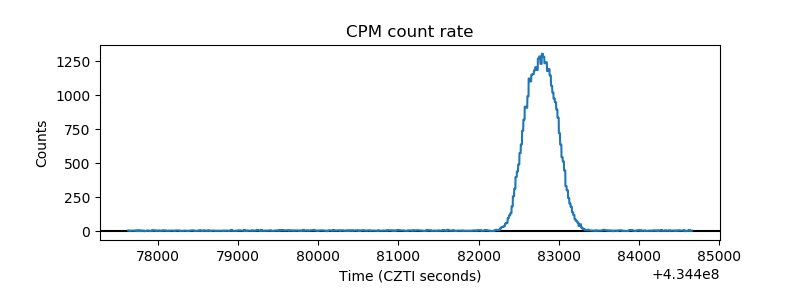 |
| CZT Counter | 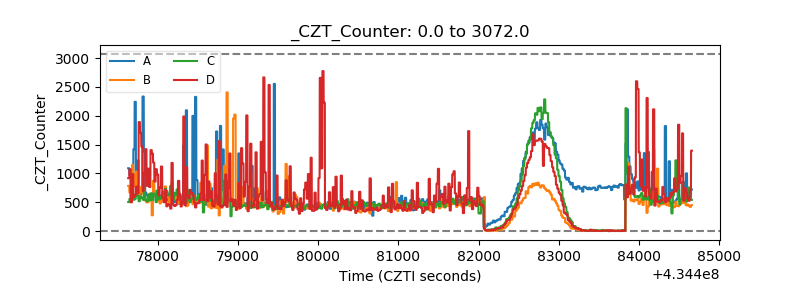 |
| +2.5 Volts monitor |  |
| +5 Volts monitor |  |
| _ROLL_ROT | 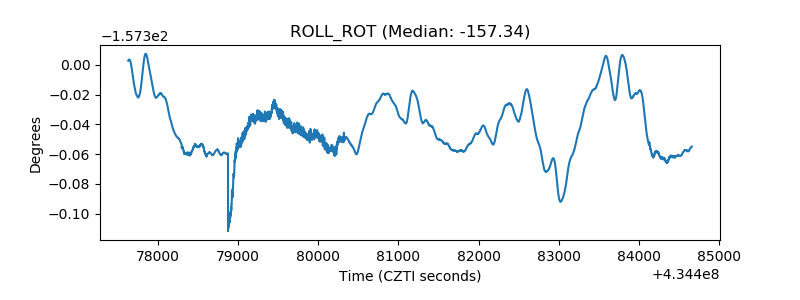 |
| _Roll_DEC | 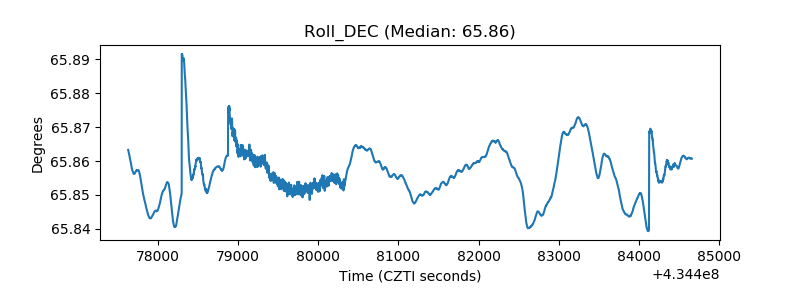 |
| _Roll_RA | 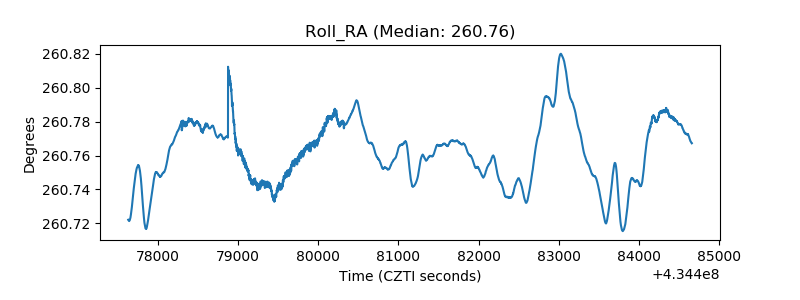 |
| Veto Counter | 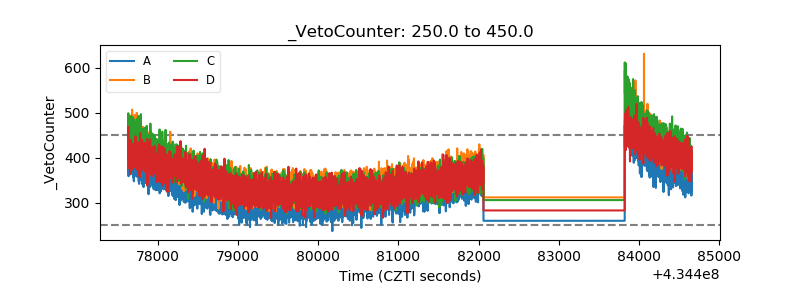 |