| Param | Original file | Final file |
|---|---|---|
| Filename | modeM0/AS1A05_174T01_9000005880_43569cztM0_level2.fits | modeM0/AS1A05_174T01_9000005880_43569cztM0_level2_quad_clean.evt |
| Size (bytes) | 3,274,470,720 | 198,025,920 |
| Size | 3.0 GB | 188.9 MB |
| Events in quadrant A | 21,126,363 | 1,729,442 |
| Events in quadrant B | 17,325,003 | 1,809,877 |
| Events in quadrant C | 41,655,547 | 919,498 |
| Events in quadrant D | 39,794,504 | 341,138 |
| Mode M9 | |||
|---|---|---|---|
| Quadrant | BADHDUFLAG | Total packets | Discarded packets |
| A | 0 | 12 | 0 |
| B | 0 | 12 | 0 |
| C | 0 | 12 | 0 |
| D | 0 | 12 | 0 |
| Mode M0 | |||
|---|---|---|---|
| Quadrant | BADHDUFLAG | Total packets | Discarded packets |
| A | 0 | 74948 | 20 |
| B | 0 | 63393 | 9 |
| C | 0 | 135357 | 36 |
| D | 0 | 129913 | 65 |
| Mode SS | |||
|---|---|---|---|
| Quadrant | BADHDUFLAG | Total packets | Discarded packets |
| A | 0 | 346 | 0 |
| B | 0 | 346 | 0 |
| C | 0 | 346 | 0 |
| D | 0 | 347 | 1 |
| Quadrant | Total seconds | Saturated seconds | Saturation percentage |
|---|---|---|---|
| A | 17094 | 2914 | 17.046917% |
| B | 17096 | 1819 | 10.639916% |
| C | 17095 | 15049 | 88.031588% |
| D | 17092 | 17046 | 99.730868% |
Noise dominated data is calculated using 1-second bins in cleaned event files. If a bin has >2000 counts, and if more than 50% of those come from <1% of pixels, then it is considered to be noise-dominated and hence unusable.
| Quadrant | # 1 sec bins | Bins with >0 counts | Bins with >2000 counts | High rate bins dominated by noise | Noise dominated (total time) | Noise dominated (detector-on time) | Marked lightcurve |
|---|---|---|---|---|---|---|---|
| A | 18149 | 17096 | 1433 | 1433 | 7.90% | 8.38% | 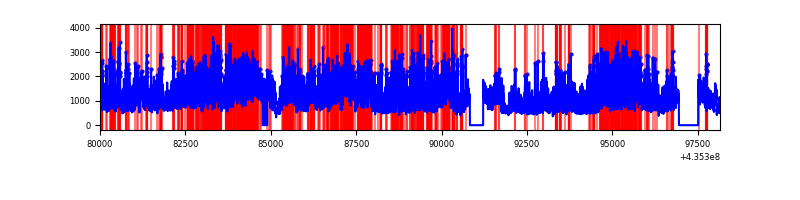 |
| B | 18151 | 17099 | 1024 | 1024 | 5.64% | 5.99% | 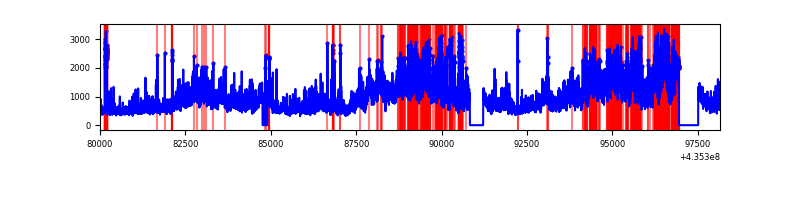 |
| C | 18150 | 17095 | 14247 | 14247 | 78.50% | 83.34% |  |
| D | 18148 | 17091 | 14625 | 14625 | 80.59% | 85.57% | 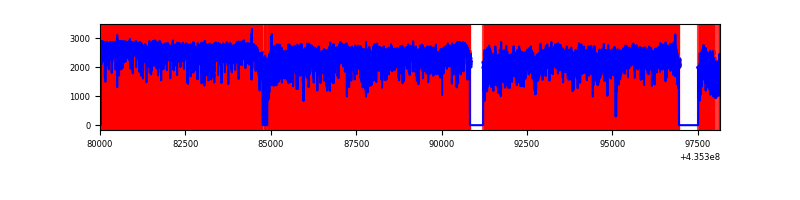 |
Top three noisy pixels from each quadrant. If the there are fewer than three noisy pixels in the level2.evt file, extra rows are filled as -1
| Pixel properties | Quadrant properties | ||||||
|---|---|---|---|---|---|---|---|
| Quadrant | DetID | PixID | Counts | Sigma | Mean | Median | Sigma |
| A | 0 | 228 | 5092725 | 13194.86 | 1862 | 1821 | 385.8 |
| A | 10 | 99 | 3318170 | 8595.48 | 1862 | 1821 | 385.8 |
| A | 15 | 222 | 2408634 | 6238.1 | 1862 | 1821 | 385.8 |
| B | 4 | 206 | 5991529 | 16070.9 | 1886 | 1825 | 372.7 |
| B | 12 | 3 | 2498203 | 6698.0 | 1886 | 1825 | 372.7 |
| B | 3 | 42 | 500392 | 1337.7 | 1886 | 1825 | 372.7 |
| C | 15 | 174 | 18066593 | 70915.0 | 1071 | 1077 | 254.7 |
| C | 15 | 142 | 14357762 | 56356.23 | 1071 | 1077 | 254.7 |
| C | 15 | 158 | 1544797 | 6059.77 | 1071 | 1077 | 254.7 |
| D | 4 | 216 | 26017842 | 168198.02 | 483 | 461 | 154.7 |
| D | 4 | 212 | 4432814 | 28654.42 | 483 | 461 | 154.7 |
| D | 8 | 48 | 1017765 | 6576.7 | 483 | 461 | 154.7 |
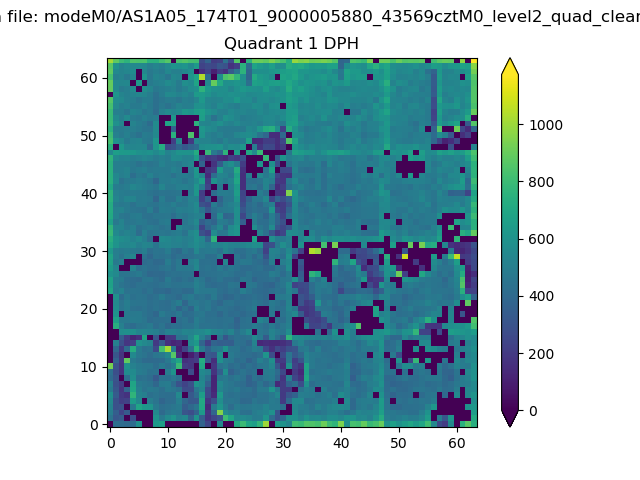
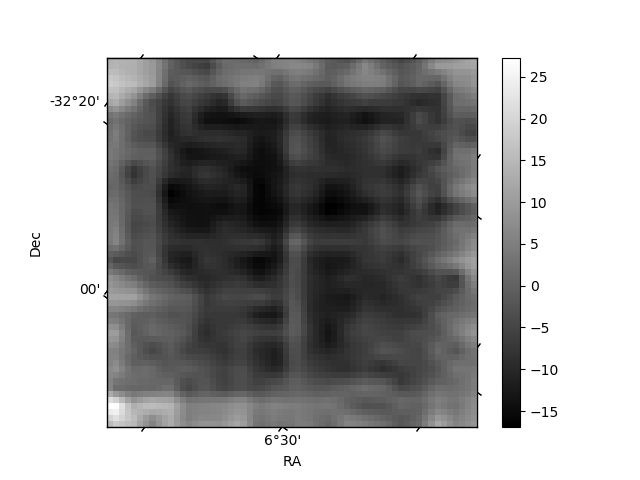
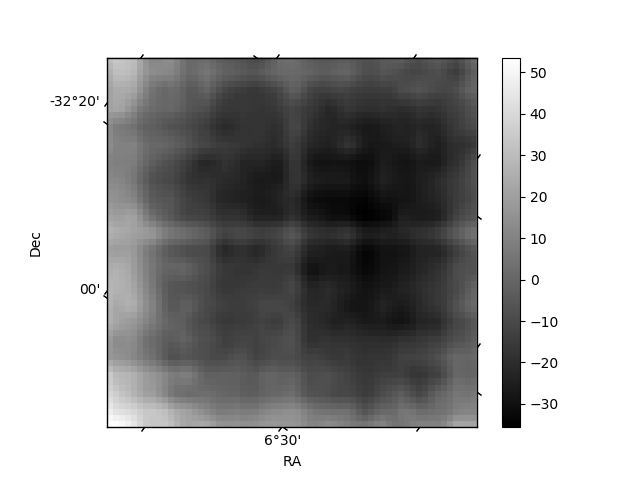
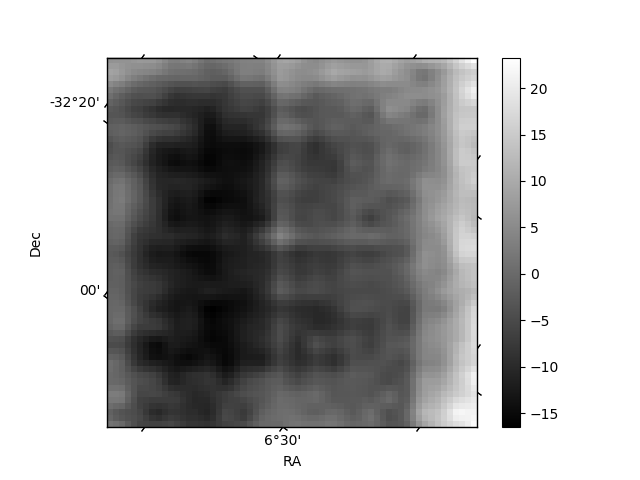
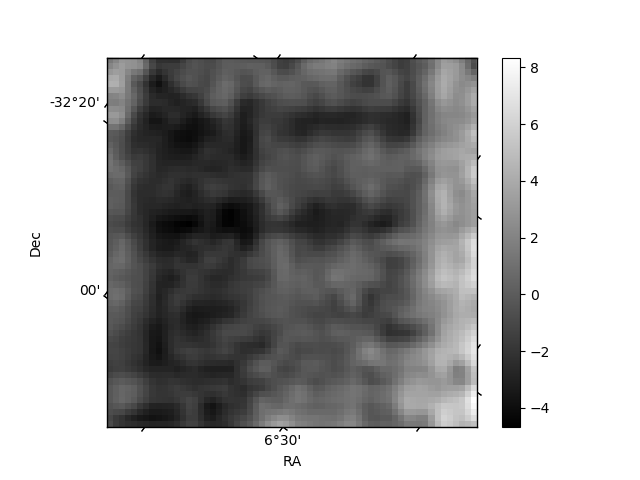
Histogram calculated using DETX and DETY for each event in the final _common_clean file
| Quadrant A | 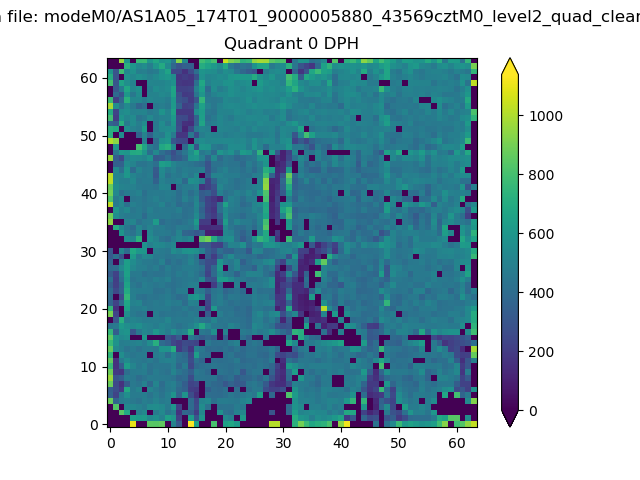 |
 |
Quadrant B |
|---|---|---|---|
| Quadrant D | 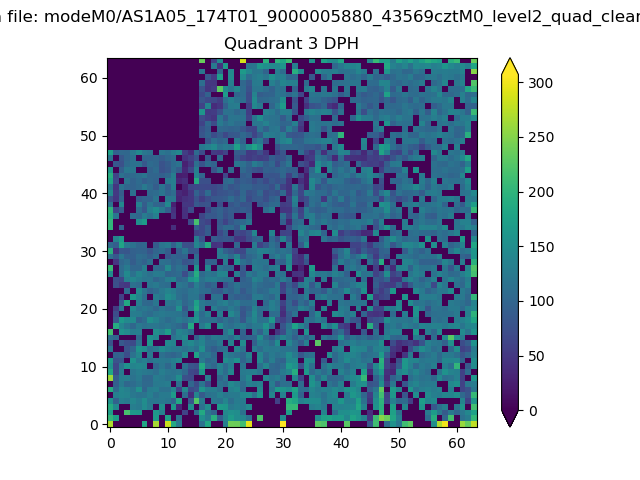 |
 |
Quadrant C |
| Plot type | Count rate plots | Images |
|---|---|---|
| Comparison with Poisson distribution Blue bars denote a histogram of data divided into 1 sec bins. Red curve is a Poisson curve with rate = median count rate of data. |
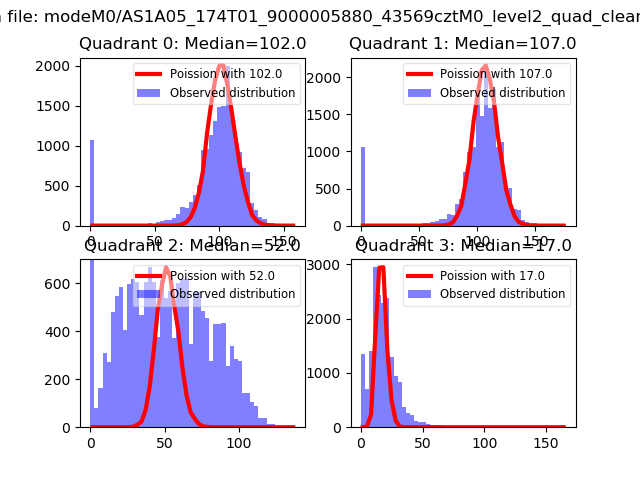 |
 |
| Quadrant-wise count rates Data is divided into 100 sec bins |
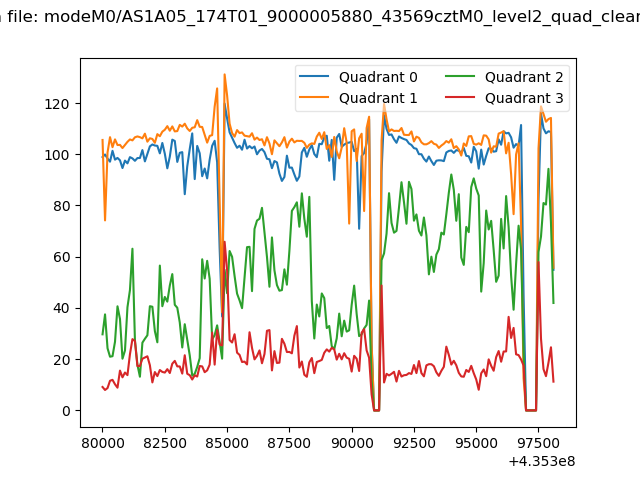 |
|
| Module-wise count rates for Quadrant A Data is divided into 100 sec bins |
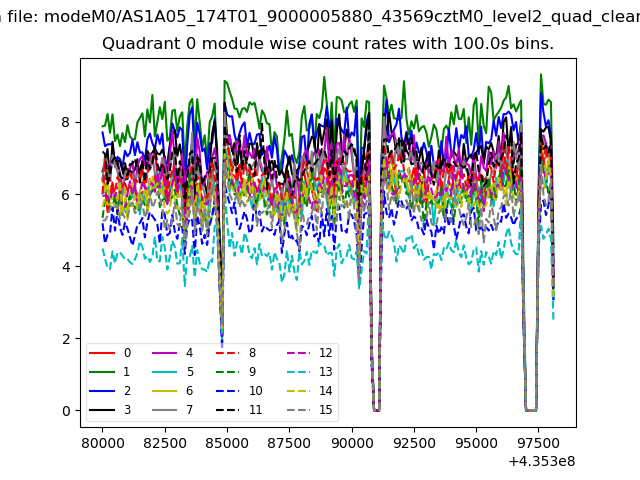 |
 |
| Module-wise count rates for Quadrant B Data is divided into 100 sec bins |
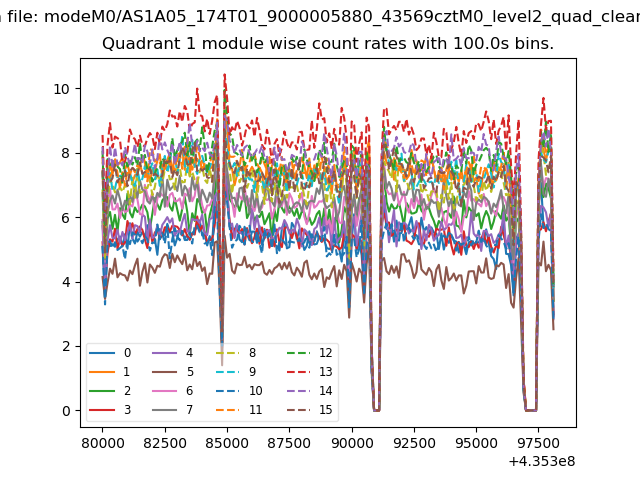 |
 |
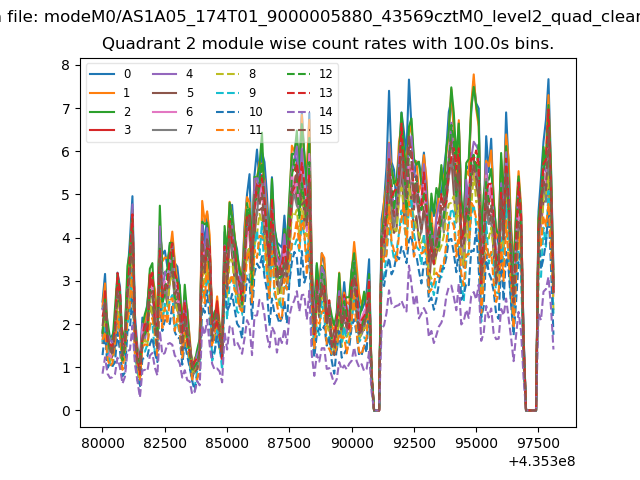
| Module-wise count rates for Quadrant C Data is divided into 100 sec bins |
 |
 |
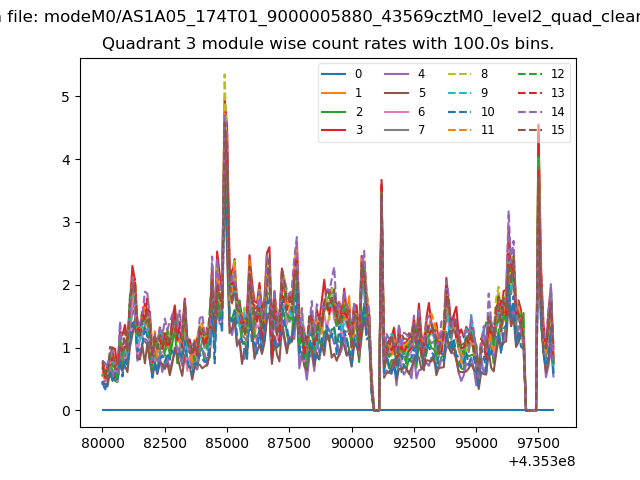
| Module-wise count rates for Quadrant D Data is divided into 100 sec bins |
 |
 |
| Parameter | Plot |
|---|---|
| CZT HV Monitor | 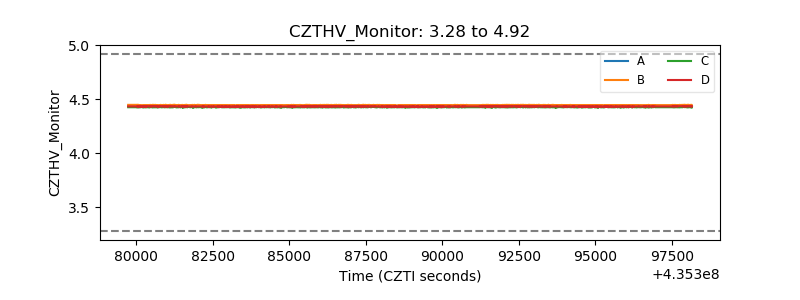 |
| D_VDD | 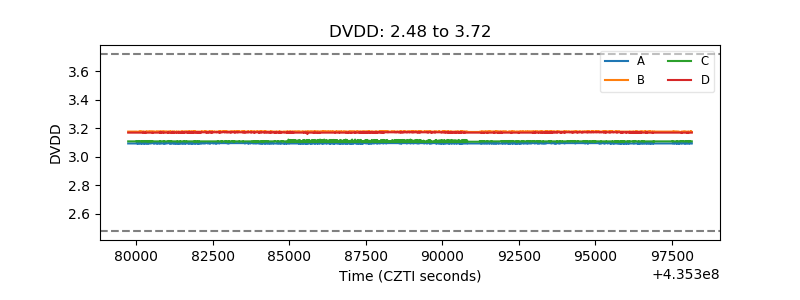 |
| Temperature 1 | 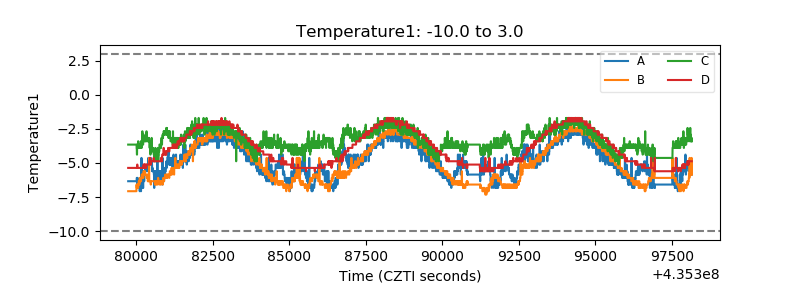 |
| Veto HV Monitor | 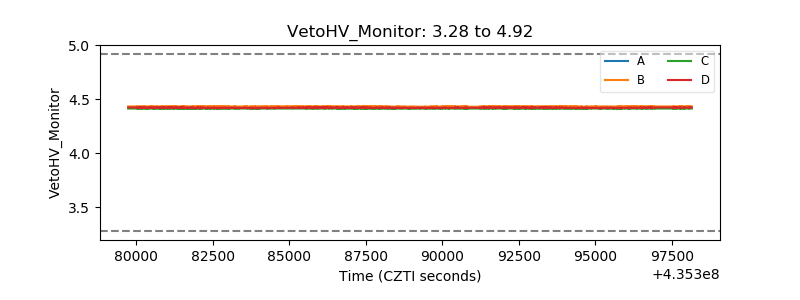 |
| Veto LLD | 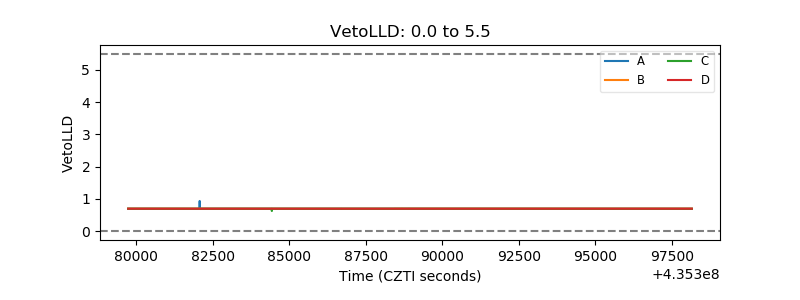 |
| Alpha Counter | 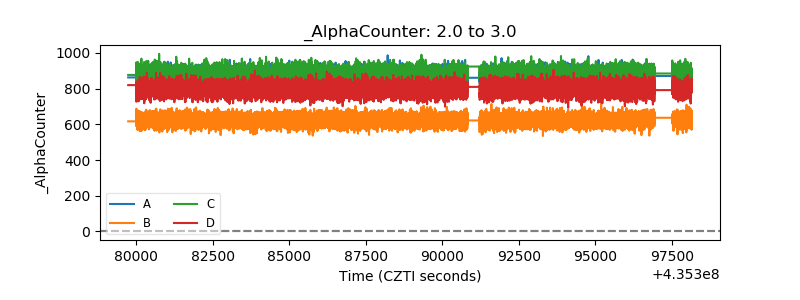 |
| _CPM_Rate | 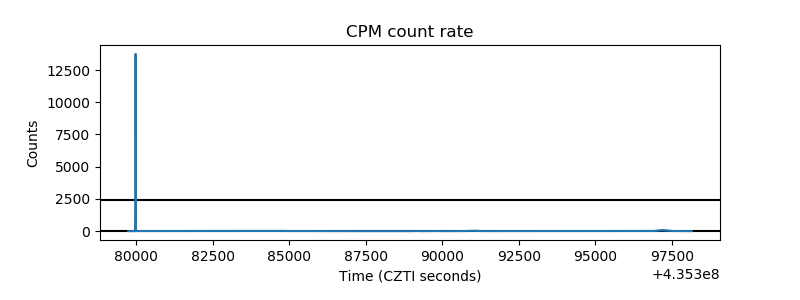 |
| CZT Counter | 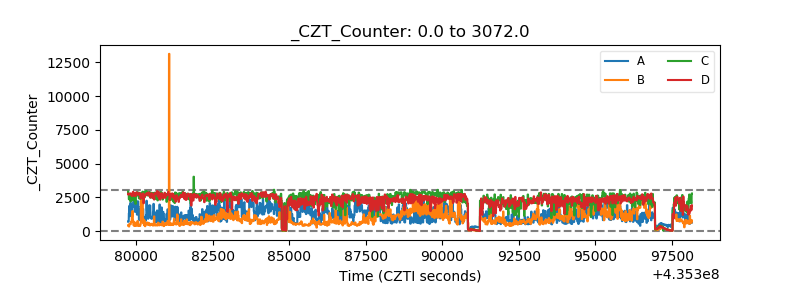 |
| +2.5 Volts monitor |  |
| +5 Volts monitor |  |
| _ROLL_ROT | 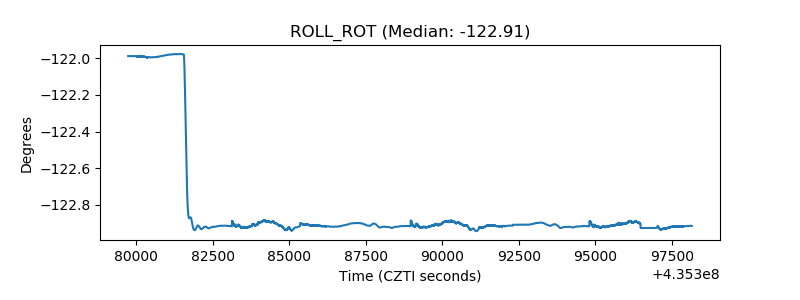 |
| _Roll_DEC | 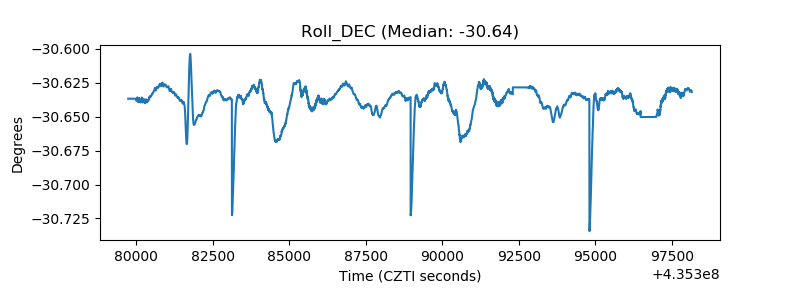 |
| _Roll_RA | 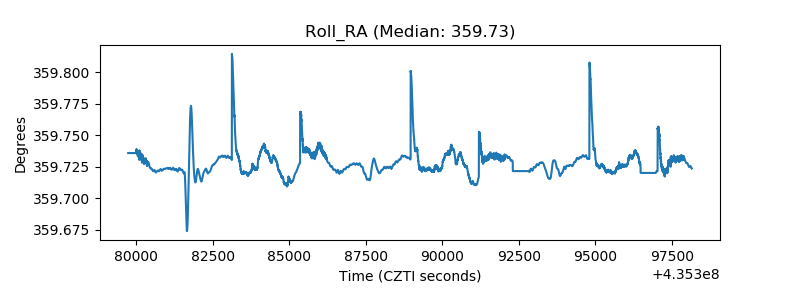 |
| Veto Counter | 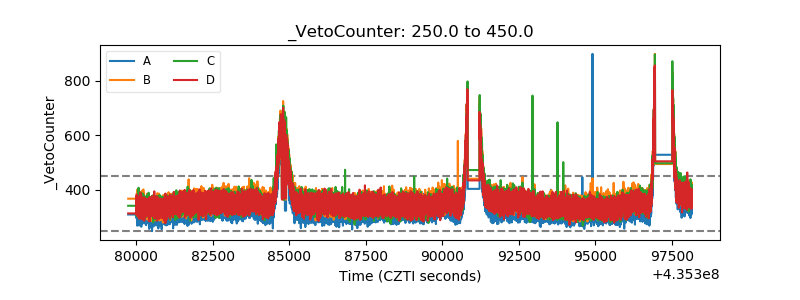 |