| Param | Original file | Final file |
|---|---|---|
| Filename | modeM0/AS1A13_003T01_9000005902_43726cztM0_level2.fits | modeM0/AS1A13_003T01_9000005902_43726cztM0_level2_quad_clean.evt |
| Size (bytes) | 718,044,480 | 126,207,360 |
| Size | 684.8 MB | 120.4 MB |
| Events in quadrant A | 5,959,891 | 856,088 |
| Events in quadrant B | 4,463,820 | 887,010 |
| Events in quadrant C | 7,269,799 | 833,354 |
| Events in quadrant D | 8,269,251 | 690,136 |
| Mode SS | |||
|---|---|---|---|
| Quadrant | BADHDUFLAG | Total packets | Discarded packets |
| A | 0 | 160 | 0 |
| B | 0 | 160 | 0 |
| C | 0 | 160 | 0 |
| D | 0 | 160 | 0 |
| Mode M0 | |||
|---|---|---|---|
| Quadrant | BADHDUFLAG | Total packets | Discarded packets |
| A | 0 | 22721 | 1 |
| B | 0 | 18798 | 0 |
| C | 0 | 27075 | 0 |
| D | 0 | 30144 | 0 |
| Quadrant | Total seconds | Saturated seconds | Saturation percentage |
|---|---|---|---|
| A | 7975 | 220 | 2.758621% |
| B | 7976 | 168 | 2.106319% |
| C | 7976 | 512 | 6.419258% |
| D | 7976 | 1228 | 15.396189% |
Noise dominated data is calculated using 1-second bins in cleaned event files. If a bin has >2000 counts, and if more than 50% of those come from <1% of pixels, then it is considered to be noise-dominated and hence unusable.
| Quadrant | # 1 sec bins | Bins with >0 counts | Bins with >2000 counts | High rate bins dominated by noise | Noise dominated (total time) | Noise dominated (detector-on time) | Marked lightcurve |
|---|---|---|---|---|---|---|---|
| A | 7975 | 7975 | 121 | 121 | 1.52% | 1.52% | 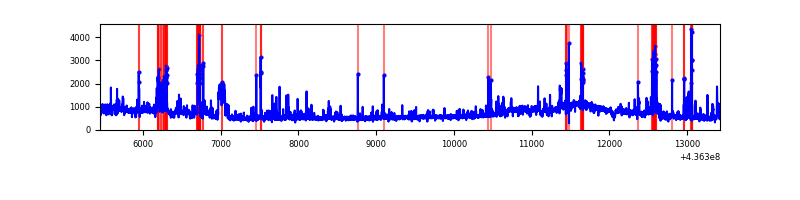 |
| B | 7976 | 7976 | 100 | 100 | 1.25% | 1.25% | 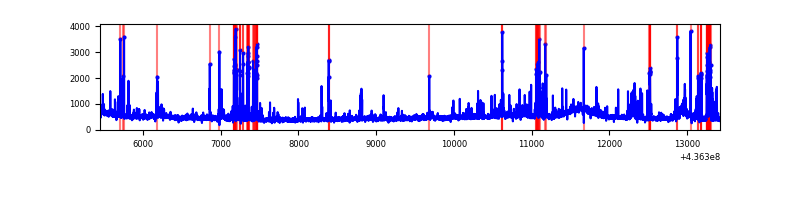 |
| C | 7976 | 7976 | 615 | 615 | 7.71% | 7.71% | 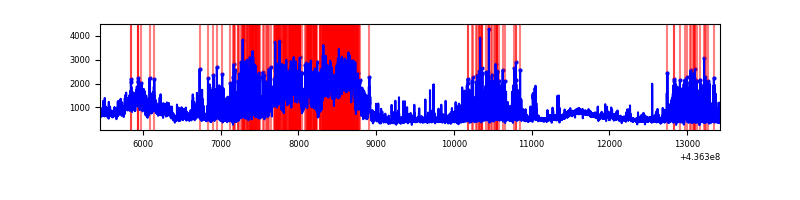 |
| D | 7976 | 7976 | 806 | 806 | 10.11% | 10.11% | 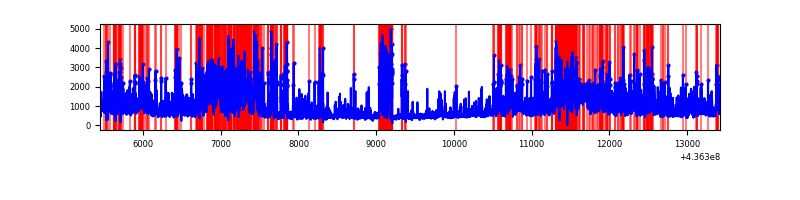 |
Top three noisy pixels from each quadrant. If the there are fewer than three noisy pixels in the level2.evt file, extra rows are filled as -1
| Pixel properties | Quadrant properties | ||||||
|---|---|---|---|---|---|---|---|
| Quadrant | DetID | PixID | Counts | Sigma | Mean | Median | Sigma |
| A | 14 | 63 | 928811 | 4883.47 | 906 | 884 | 190.0 |
| A | 10 | 83 | 920383 | 4839.11 | 906 | 884 | 190.0 |
| A | 15 | 223 | 330887 | 1736.73 | 906 | 884 | 190.0 |
| B | 5 | 235 | 599847 | 3375.73 | 905 | 878 | 177.4 |
| B | 12 | 3 | 103454 | 578.11 | 905 | 878 | 177.4 |
| B | 4 | 171 | 64253 | 357.18 | 905 | 878 | 177.4 |
| C | 15 | 158 | 3393596 | 16036.46 | 892 | 894 | 211.6 |
| C | 15 | 157 | 129679 | 608.73 | 892 | 894 | 211.6 |
| C | 15 | 126 | 110410 | 517.65 | 892 | 894 | 211.6 |
| D | 1 | 52 | 914009 | 4233.23 | 849 | 824 | 215.7 |
| D | 7 | 80 | 635368 | 2941.54 | 849 | 824 | 215.7 |
| D | 5 | 235 | 508403 | 2352.97 | 849 | 824 | 215.7 |
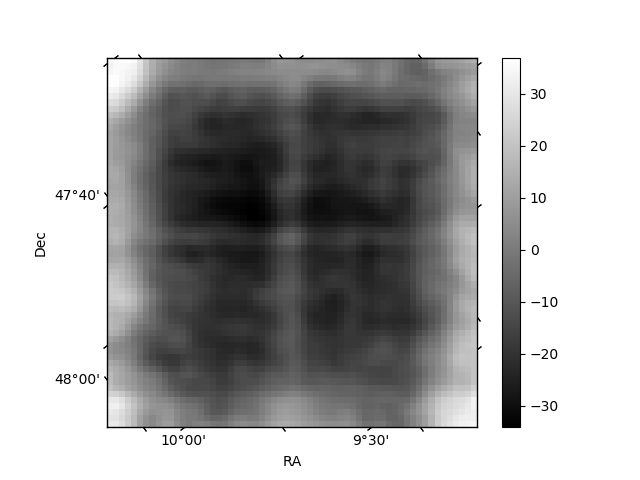
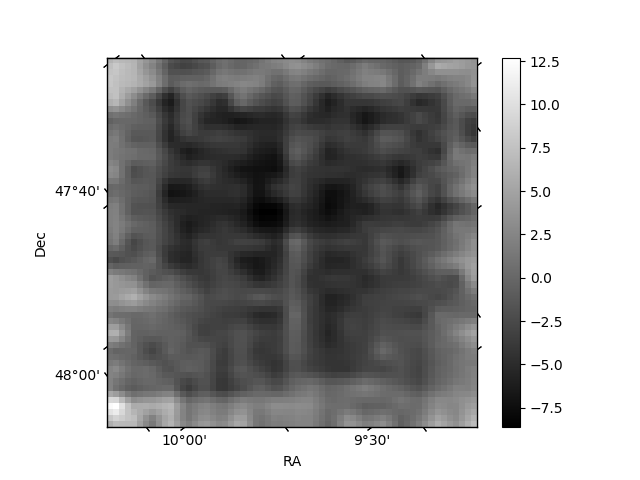
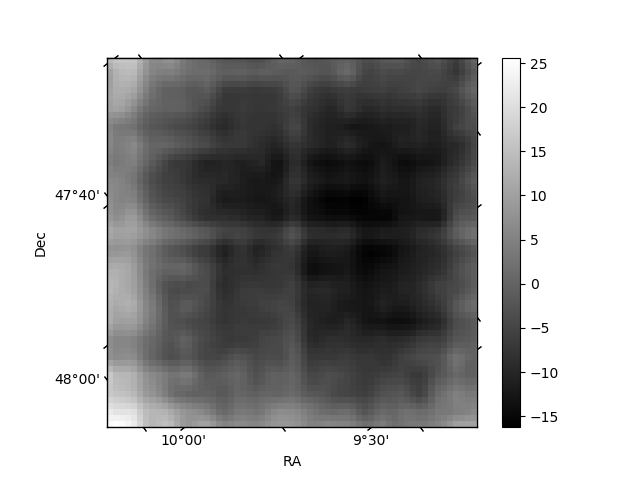
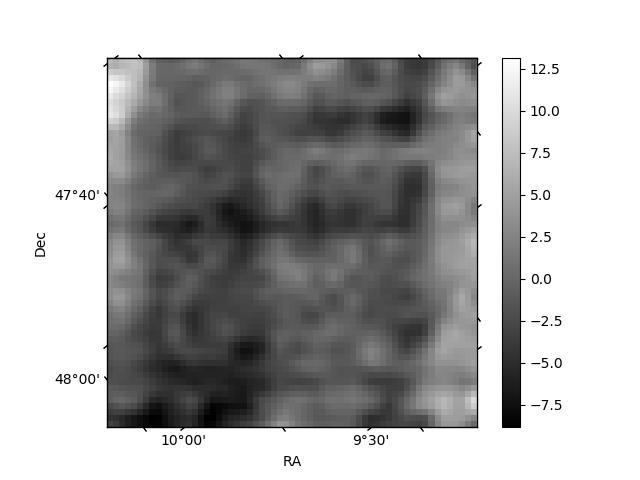
Histogram calculated using DETX and DETY for each event in the final _common_clean file
| Quadrant A | 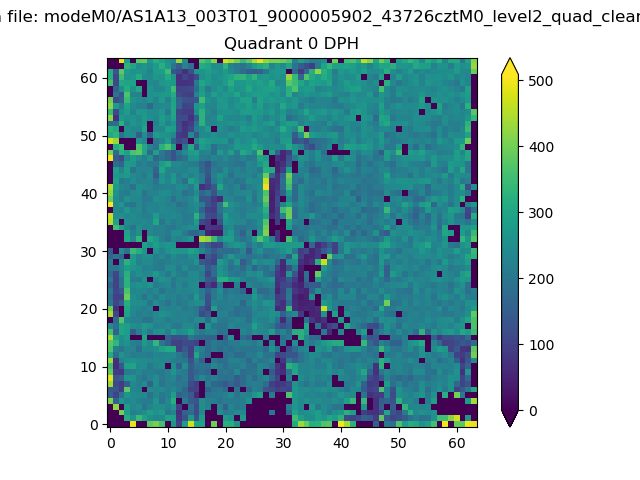 |
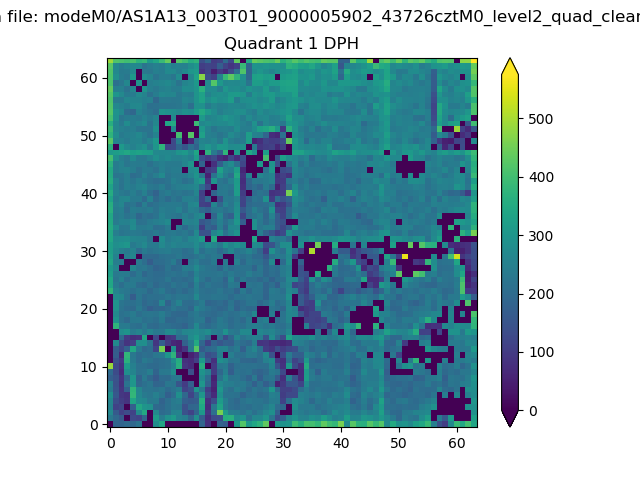 |
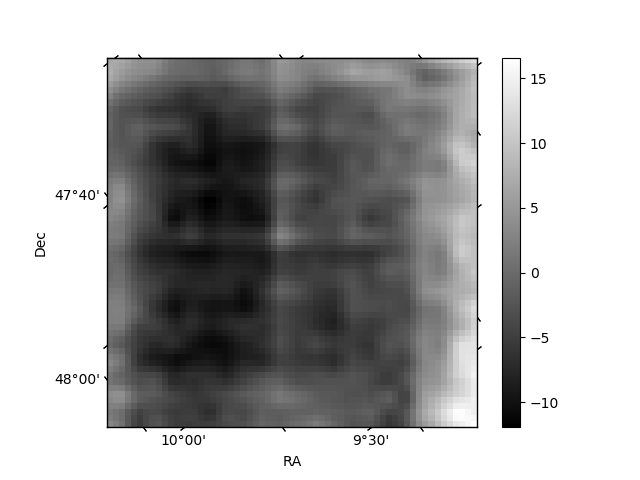
Quadrant B |
|---|---|---|---|
| Quadrant D | 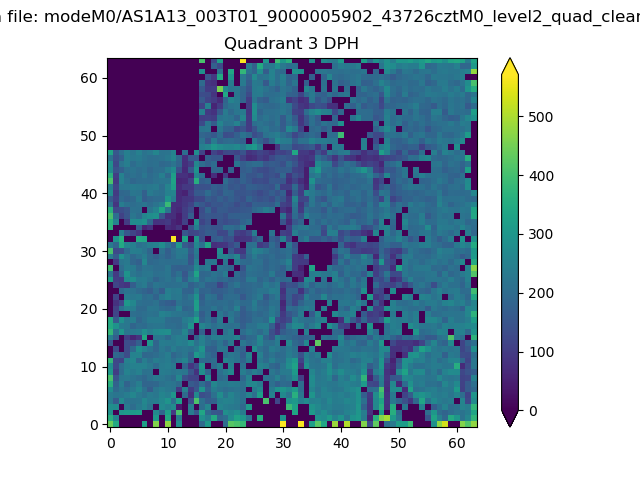 |
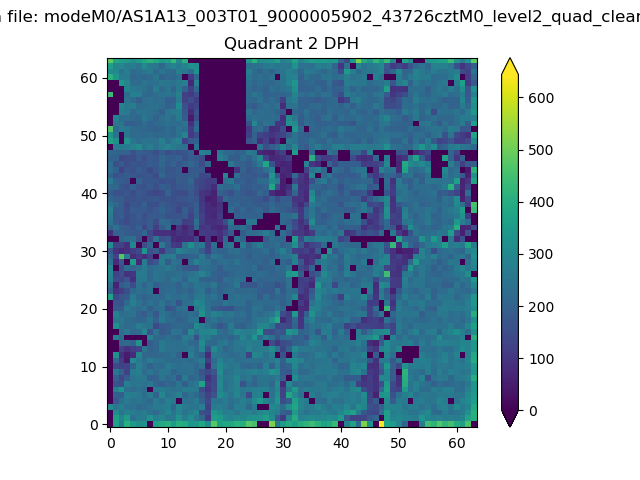 |
Quadrant C |
| Plot type | Count rate plots | Images |
|---|---|---|
| Comparison with Poisson distribution Blue bars denote a histogram of data divided into 1 sec bins. Red curve is a Poisson curve with rate = median count rate of data. |
 |
 |
| Quadrant-wise count rates Data is divided into 100 sec bins |
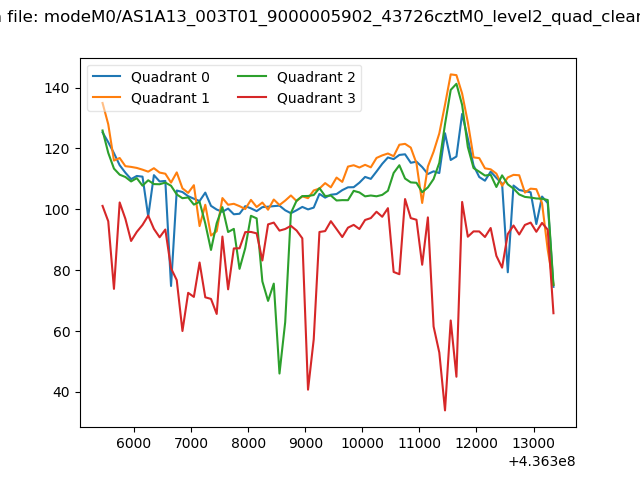 |
|
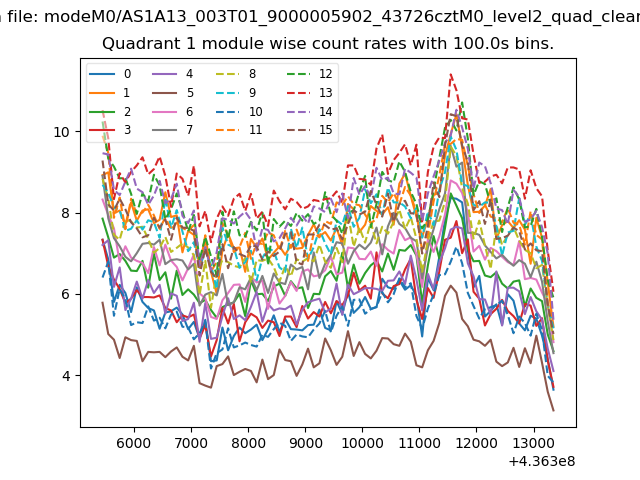
| Module-wise count rates for Quadrant A Data is divided into 100 sec bins |
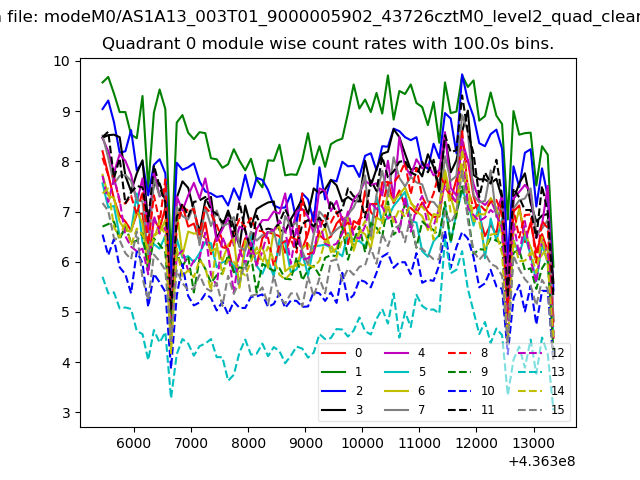 |
 |
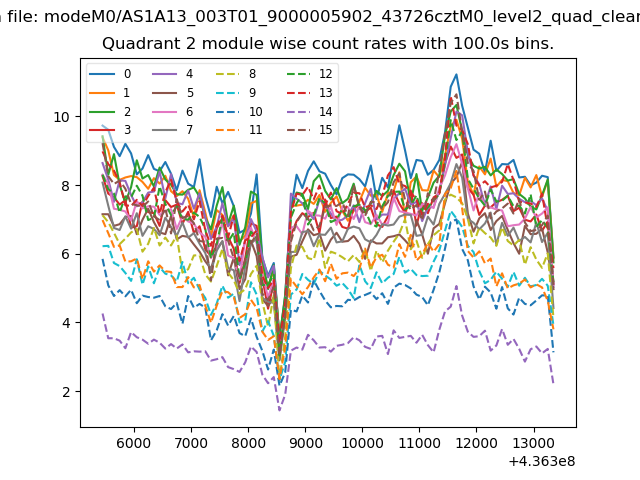
| Module-wise count rates for Quadrant B Data is divided into 100 sec bins |
 |
 |
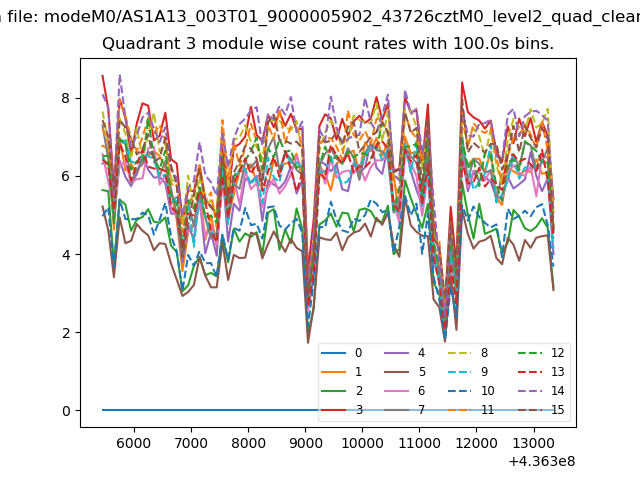
| Module-wise count rates for Quadrant C Data is divided into 100 sec bins |
 |
 |
| Module-wise count rates for Quadrant D Data is divided into 100 sec bins |
 |
 |
| Parameter | Plot |
|---|---|
| CZT HV Monitor | 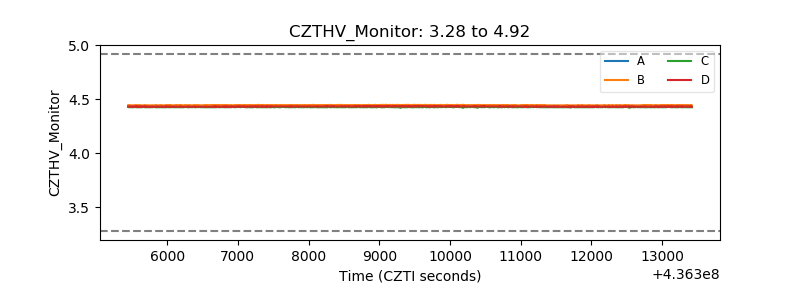 |
| D_VDD | 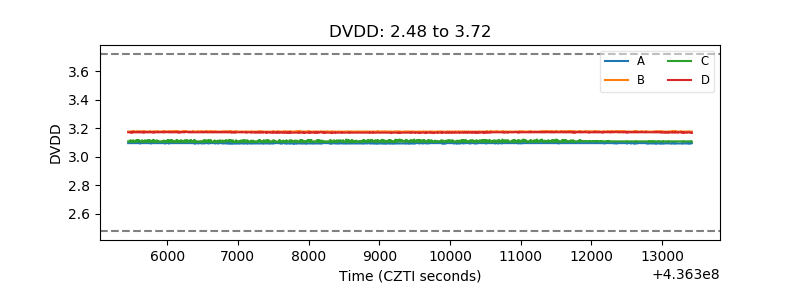 |
| Temperature 1 |  |
| Veto HV Monitor | 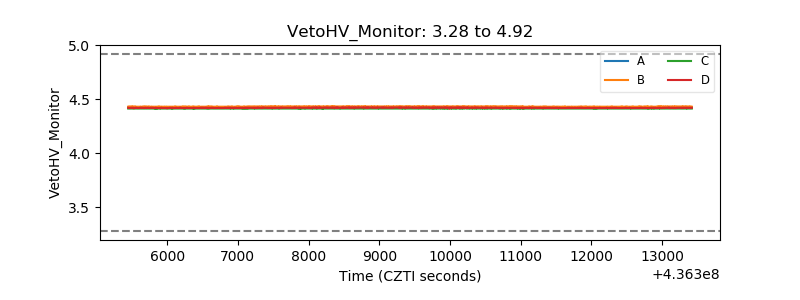 |
| Veto LLD | 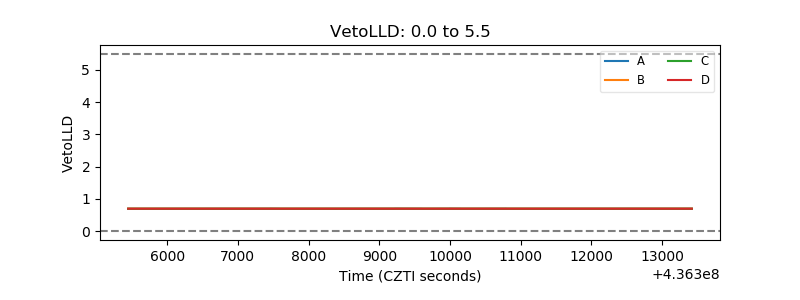 |
| Alpha Counter | 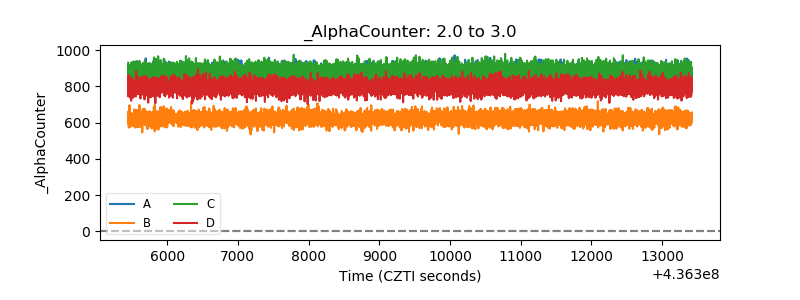 |
| _CPM_Rate | 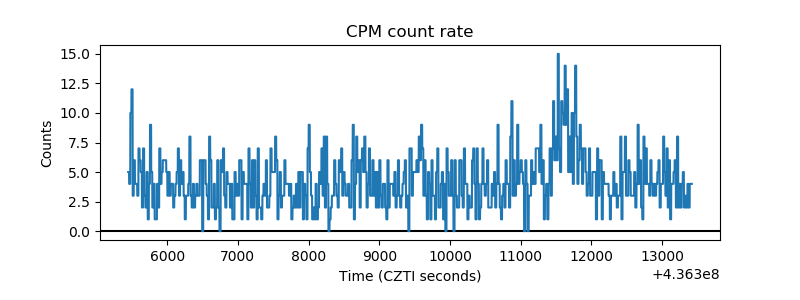 |
| CZT Counter | 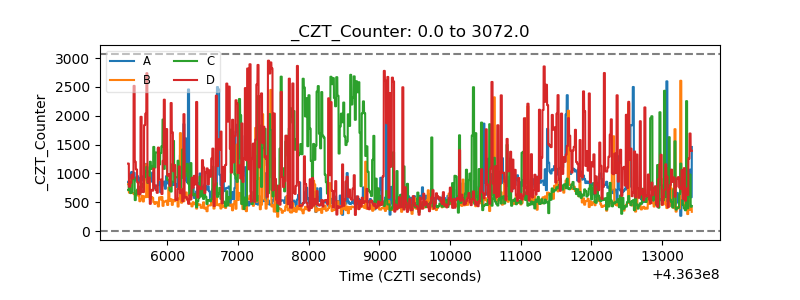 |
| +2.5 Volts monitor | 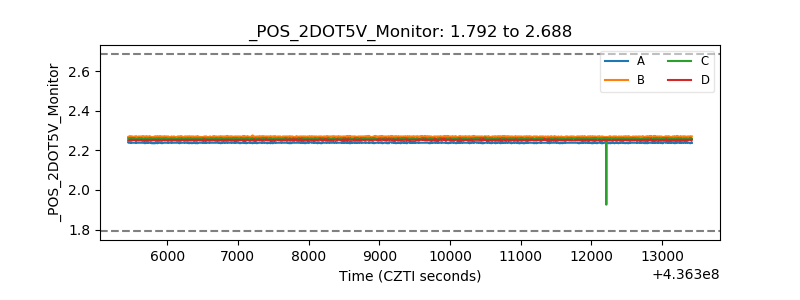 |
| +5 Volts monitor | 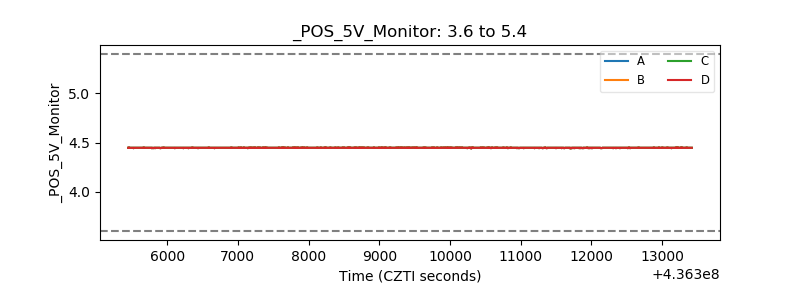 |
| _ROLL_ROT | 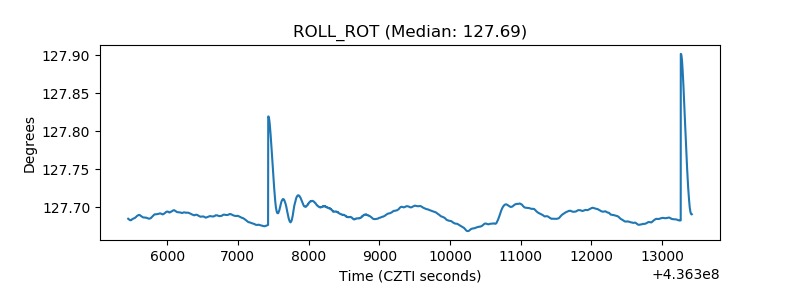 |
| _Roll_DEC | 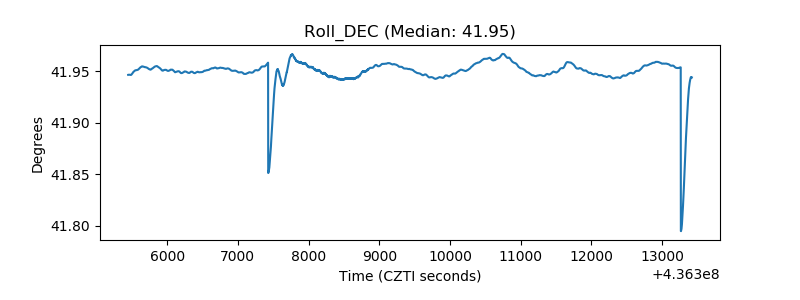 |
| _Roll_RA | 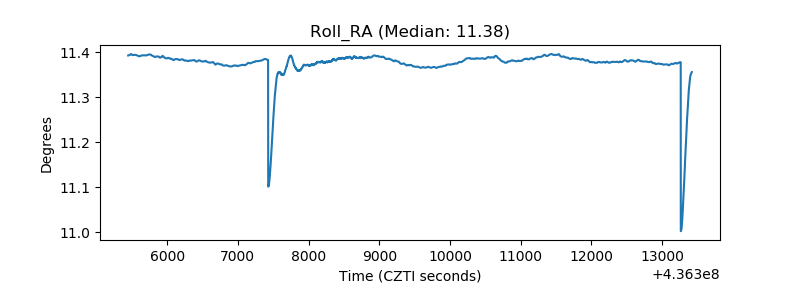 |
| Veto Counter | 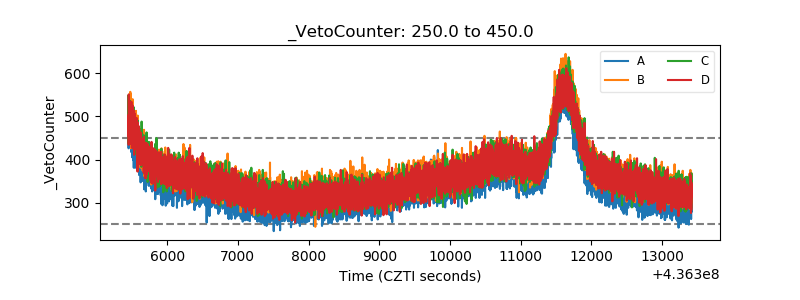 |