| Param | Original file | Final file |
|---|---|---|
| Filename | modeM0/AS1A13_024T02_9000005918_43943cztM0_level2.fits | modeM0/AS1A13_024T02_9000005918_43943cztM0_level2_quad_clean.evt |
| Size (bytes) | 312,410,880 | 53,622,720 |
| Size | 297.9 MB | 51.1 MB |
| Events in quadrant A | 3,729,163 | 347,936 |
| Events in quadrant B | 2,299,471 | 377,451 |
| Events in quadrant C | 1,839,916 | 358,882 |
| Events in quadrant D | 3,415,547 | 284,903 |
| Mode M0 | |||
|---|---|---|---|
| Quadrant | BADHDUFLAG | Total packets | Discarded packets |
| A | 0 | 13633 | 0 |
| B | 0 | 9272 | 0 |
| C | 0 | 8062 | 0 |
| D | 0 | 12600 | 0 |
| Mode SS | |||
|---|---|---|---|
| Quadrant | BADHDUFLAG | Total packets | Discarded packets |
| A | 0 | 72 | 0 |
| B | 0 | 72 | 0 |
| C | 0 | 72 | 0 |
| D | 0 | 72 | 0 |
| Quadrant | Total seconds | Saturated seconds | Saturation percentage |
|---|---|---|---|
| A | 3592 | 490 | 13.641425% |
| B | 3593 | 65 | 1.809073% |
| C | 3593 | 53 | 1.475090% |
| D | 3593 | 595 | 16.559978% |
Noise dominated data is calculated using 1-second bins in cleaned event files. If a bin has >2000 counts, and if more than 50% of those come from <1% of pixels, then it is considered to be noise-dominated and hence unusable.
| Quadrant | # 1 sec bins | Bins with >0 counts | Bins with >2000 counts | High rate bins dominated by noise | Noise dominated (total time) | Noise dominated (detector-on time) | Marked lightcurve |
|---|---|---|---|---|---|---|---|
| A | 3592 | 3592 | 487 | 487 | 13.56% | 13.56% | 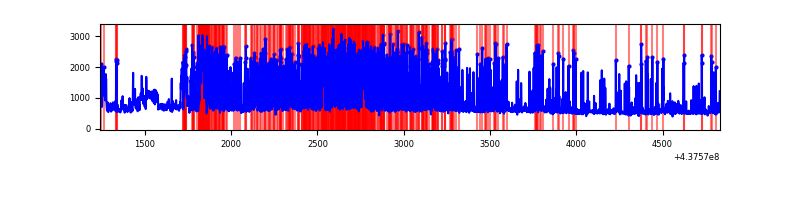 |
| B | 3593 | 3593 | 42 | 42 | 1.17% | 1.17% | 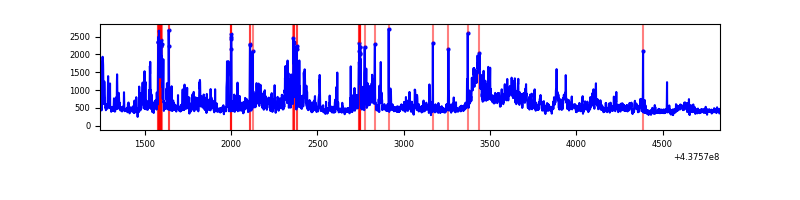 |
| C | 3593 | 3593 | 54 | 54 | 1.50% | 1.50% | 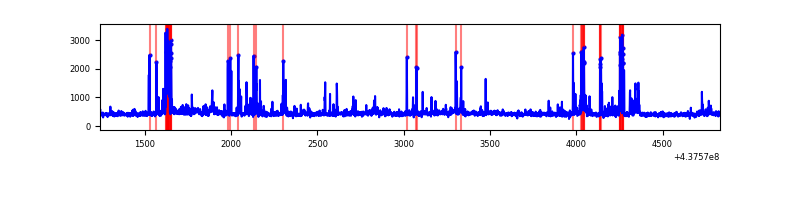 |
| D | 3593 | 3593 | 496 | 496 | 13.80% | 13.80% | 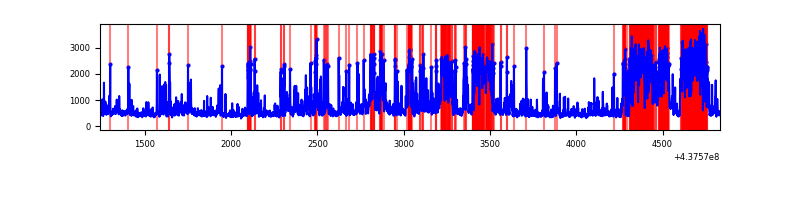 |
Top three noisy pixels from each quadrant. If the there are fewer than three noisy pixels in the level2.evt file, extra rows are filled as -1
| Pixel properties | Quadrant properties | ||||||
|---|---|---|---|---|---|---|---|
| Quadrant | DetID | PixID | Counts | Sigma | Mean | Median | Sigma |
| A | 15 | 222 | 1582236 | 21321.69 | 354 | 347 | 74.2 |
| A | 10 | 83 | 568420 | 7656.84 | 354 | 347 | 74.2 |
| A | 15 | 223 | 130755 | 1757.72 | 354 | 347 | 74.2 |
| B | 0 | 200 | 453627 | 6304.37 | 367 | 357 | 71.9 |
| B | 5 | 235 | 103395 | 1433.12 | 367 | 357 | 71.9 |
| B | 0 | 183 | 90917 | 1259.57 | 367 | 357 | 71.9 |
| C | 14 | 254 | 112615 | 1292.5 | 362 | 363 | 86.8 |
| C | 1 | 241 | 85844 | 984.25 | 362 | 363 | 86.8 |
| C | 3 | 233 | 78524 | 899.97 | 362 | 363 | 86.8 |
| D | 12 | 17 | 1012688 | 11858.34 | 333 | 322 | 85.4 |
| D | 5 | 235 | 212959 | 2490.72 | 333 | 322 | 85.4 |
| D | 7 | 204 | 182968 | 2139.42 | 333 | 322 | 85.4 |
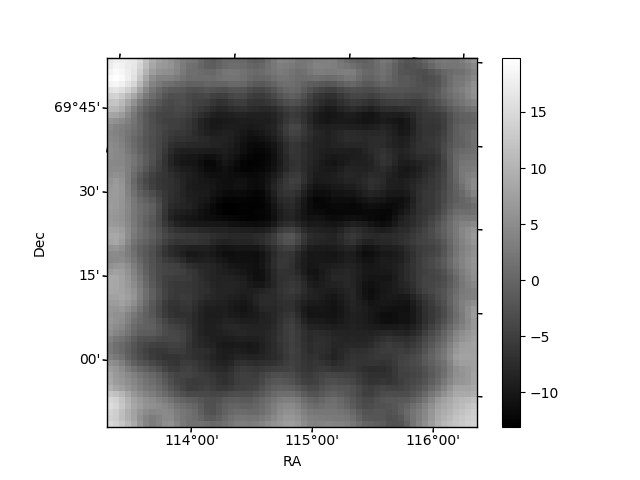
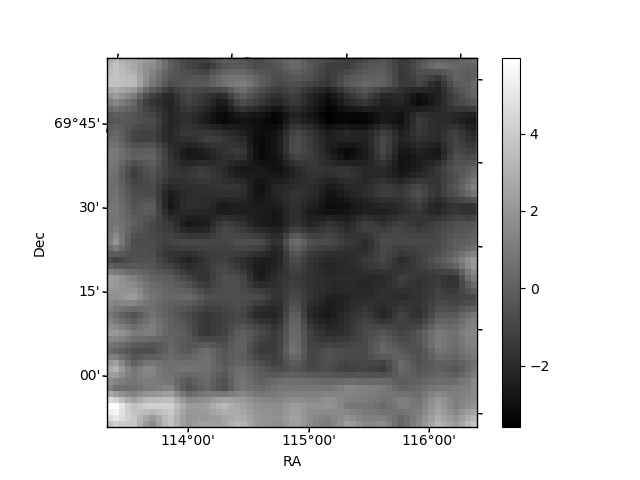
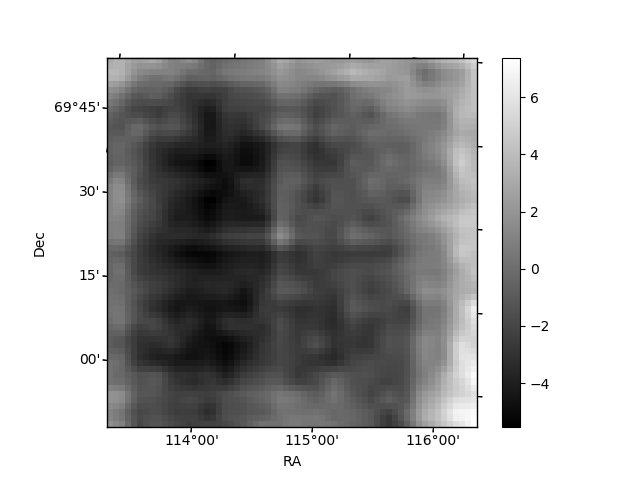
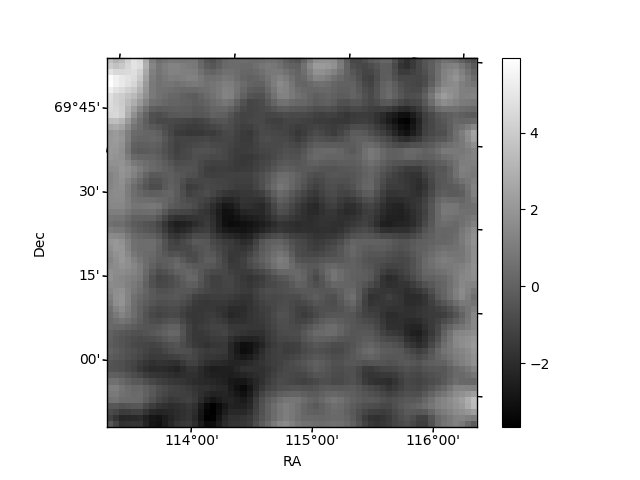
Histogram calculated using DETX and DETY for each event in the final _common_clean file
| Quadrant A | 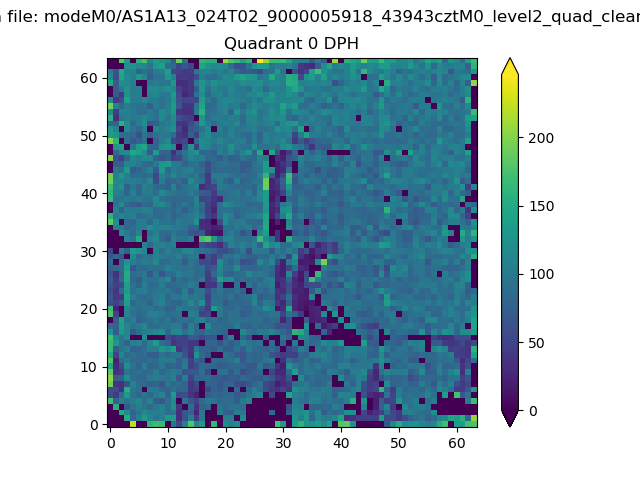 |
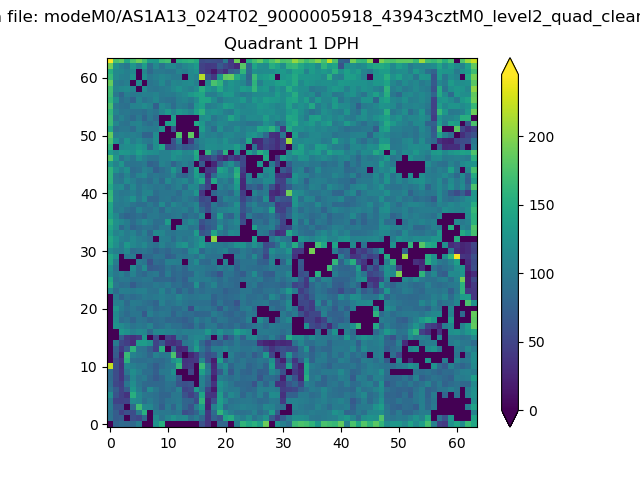 |
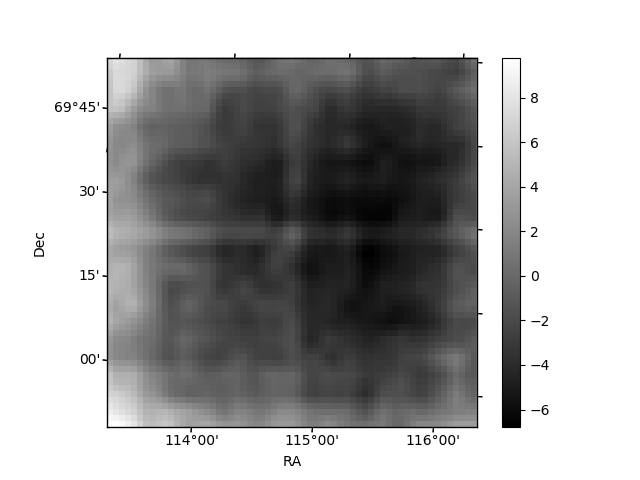
Quadrant B |
|---|---|---|---|
| Quadrant D | 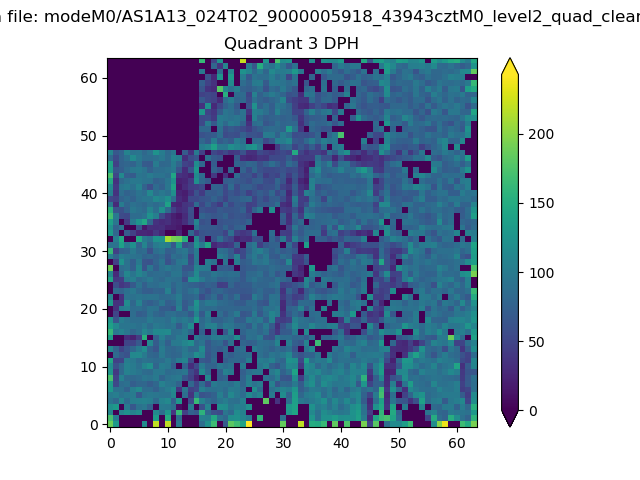 |
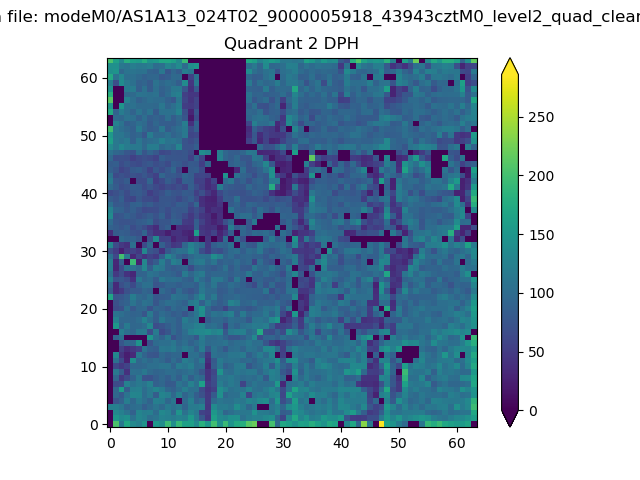 |
Quadrant C |
| Plot type | Count rate plots | Images |
|---|---|---|
| Comparison with Poisson distribution Blue bars denote a histogram of data divided into 1 sec bins. Red curve is a Poisson curve with rate = median count rate of data. |
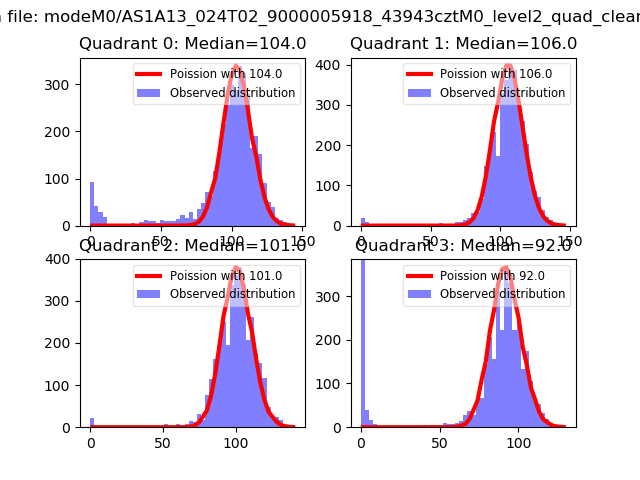 |
 |
| Quadrant-wise count rates Data is divided into 100 sec bins |
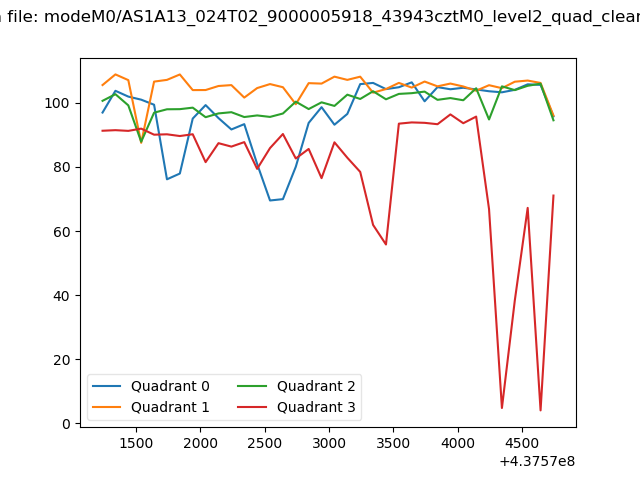 |
|
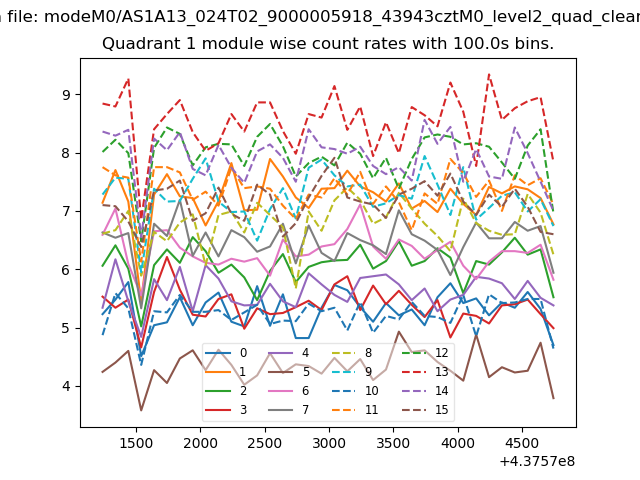
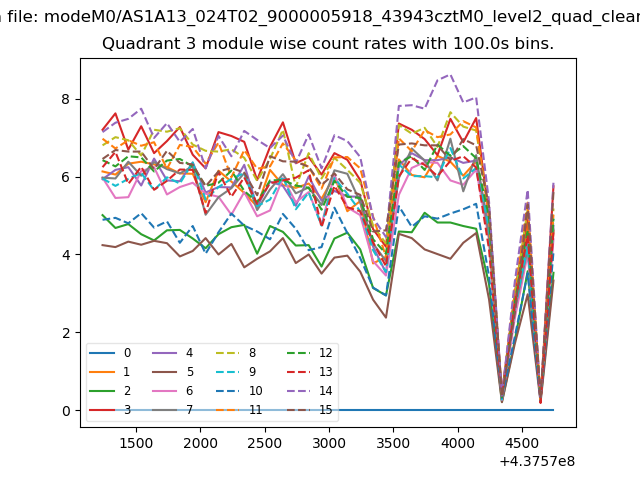
| Module-wise count rates for Quadrant A Data is divided into 100 sec bins |
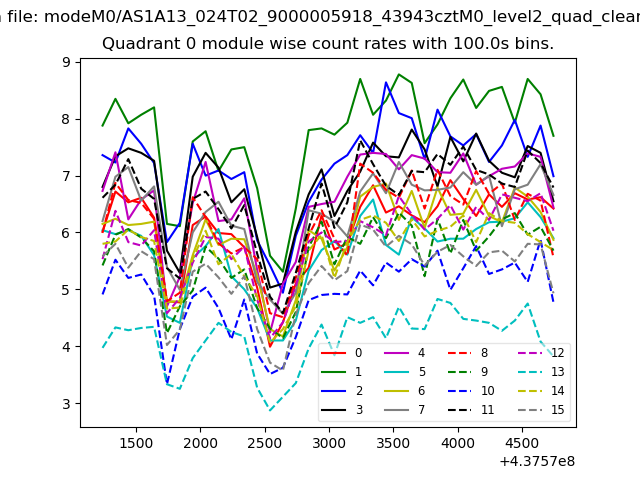 |
 |
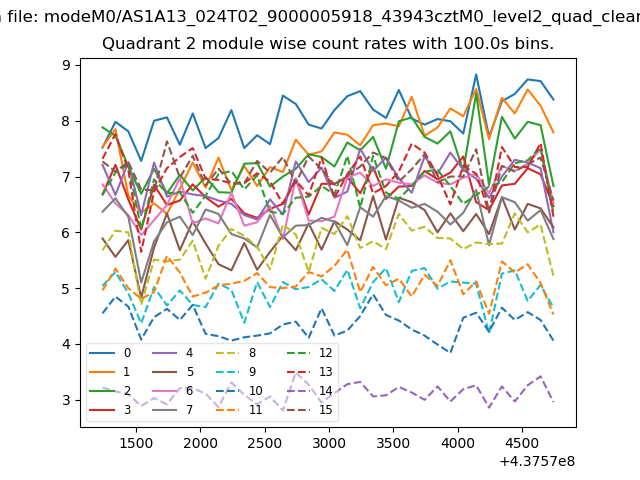
| Module-wise count rates for Quadrant B Data is divided into 100 sec bins |
 |
 |
| Module-wise count rates for Quadrant C Data is divided into 100 sec bins |
 |
 |
| Module-wise count rates for Quadrant D Data is divided into 100 sec bins |
 |
 |
| Parameter | Plot |
|---|---|
| CZT HV Monitor | 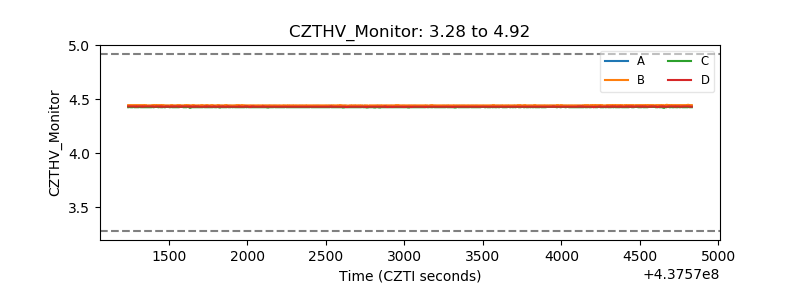 |
| D_VDD | 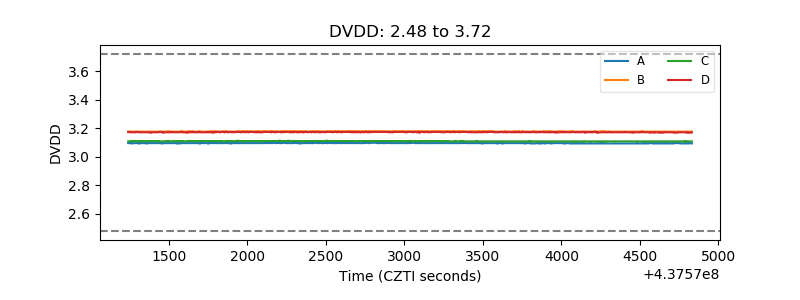 |
| Temperature 1 | 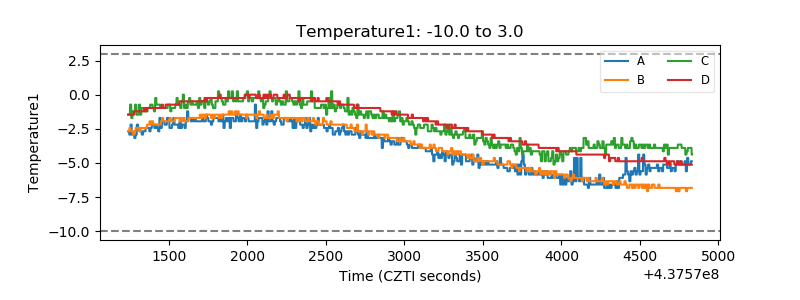 |
| Veto HV Monitor | 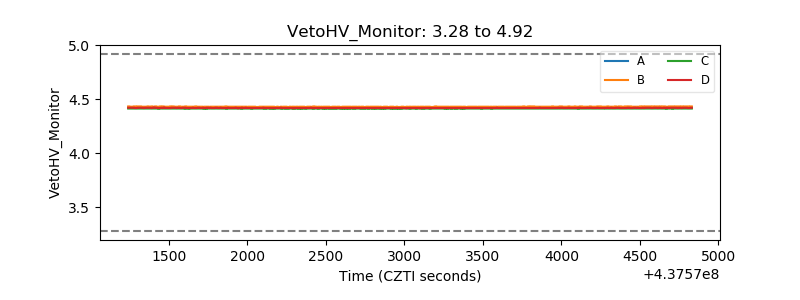 |
| Veto LLD | 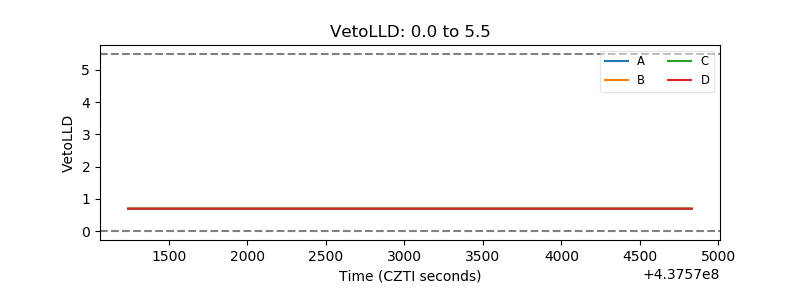 |
| Alpha Counter | 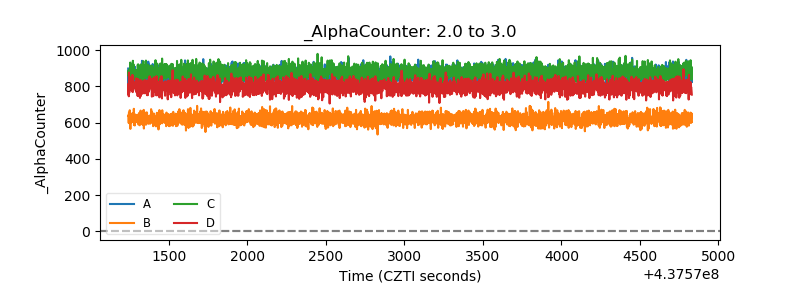 |
| _CPM_Rate | 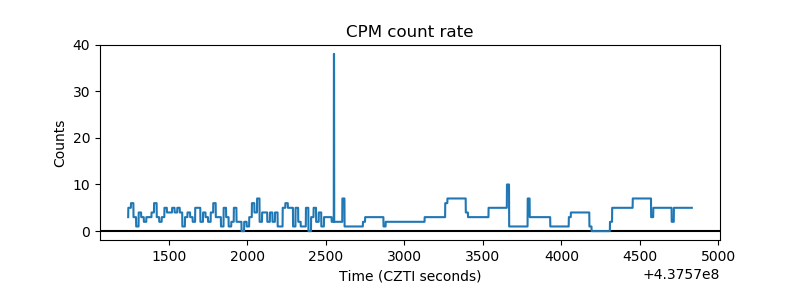 |
| CZT Counter | 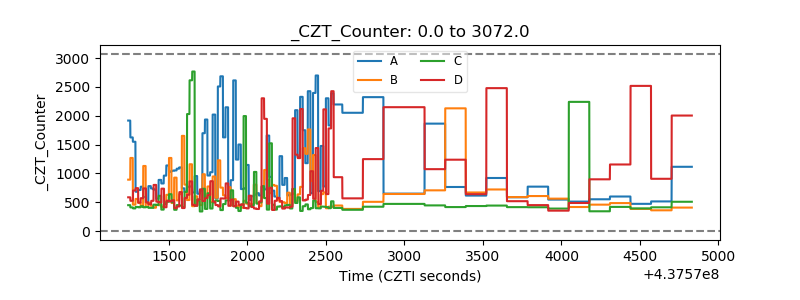 |
| +2.5 Volts monitor | 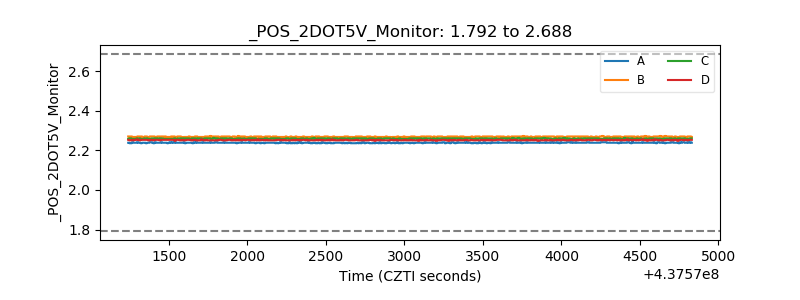 |
| +5 Volts monitor | 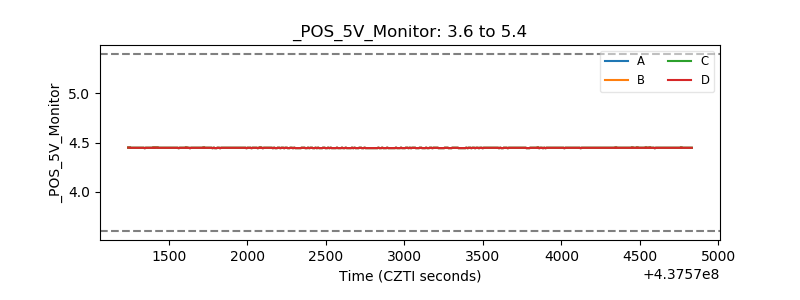 |
| _ROLL_ROT | 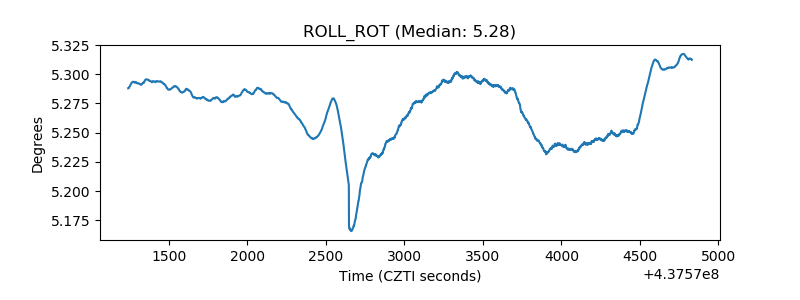 |
| _Roll_DEC | 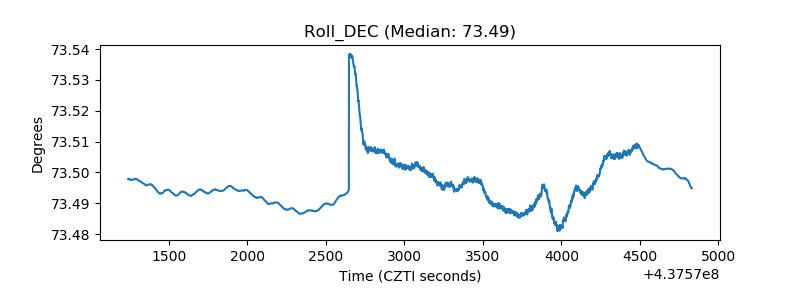 |
| _Roll_RA | 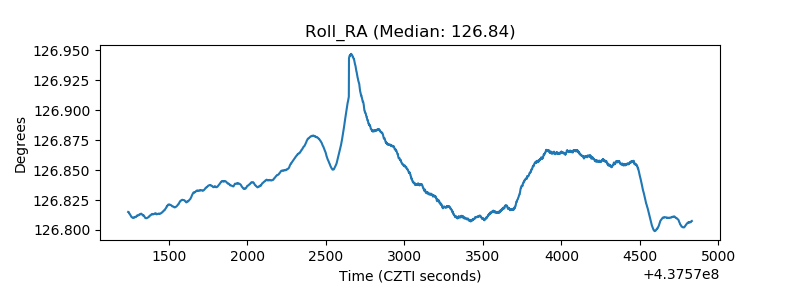 |
| Veto Counter | 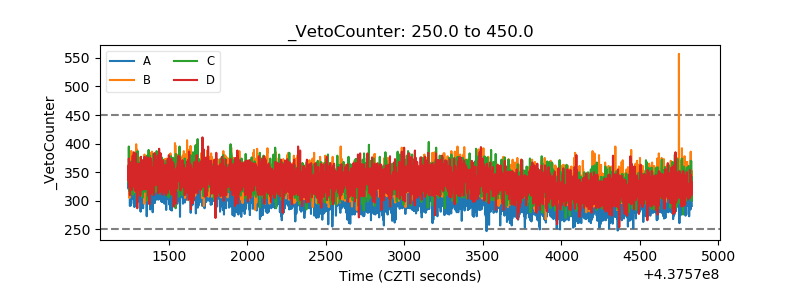 |