| Param | Original file | Final file |
|---|---|---|
| Filename | modeM0/AS1A13_025T01_9000005920_43958cztM0_level2.fits | modeM0/AS1A13_025T01_9000005920_43958cztM0_level2_quad_clean.evt |
| Size (bytes) | 249,845,760 | 47,456,640 |
| Size | 238.3 MB | 45.3 MB |
| Events in quadrant A | 2,937,320 | 313,665 |
| Events in quadrant B | 1,533,126 | 327,354 |
| Events in quadrant C | 1,694,041 | 311,032 |
| Events in quadrant D | 2,842,703 | 265,278 |
| Mode SS | |||
|---|---|---|---|
| Quadrant | BADHDUFLAG | Total packets | Discarded packets |
| A | 0 | 62 | 0 |
| B | 0 | 62 | 0 |
| C | 0 | 62 | 0 |
| D | 0 | 62 | 0 |
| Mode M0 | |||
|---|---|---|---|
| Quadrant | BADHDUFLAG | Total packets | Discarded packets |
| A | 0 | 10975 | 0 |
| B | 0 | 6642 | 0 |
| C | 0 | 7262 | 0 |
| D | 0 | 10566 | 0 |
| Quadrant | Total seconds | Saturated seconds | Saturation percentage |
|---|---|---|---|
| A | 3085 | 131 | 4.246353% |
| B | 3085 | 16 | 0.518639% |
| C | 3086 | 64 | 2.073882% |
| D | 3086 | 342 | 11.082307% |
Noise dominated data is calculated using 1-second bins in cleaned event files. If a bin has >2000 counts, and if more than 50% of those come from <1% of pixels, then it is considered to be noise-dominated and hence unusable.
| Quadrant | # 1 sec bins | Bins with >0 counts | Bins with >2000 counts | High rate bins dominated by noise | Noise dominated (total time) | Noise dominated (detector-on time) | Marked lightcurve |
|---|---|---|---|---|---|---|---|
| A | 3086 | 3086 | 118 | 118 | 3.82% | 3.82% | 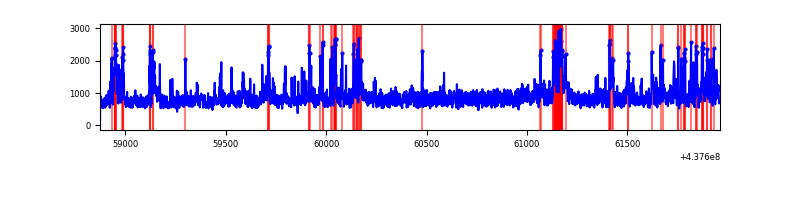 |
| B | 3086 | 3086 | 9 | 9 | 0.29% | 0.29% | 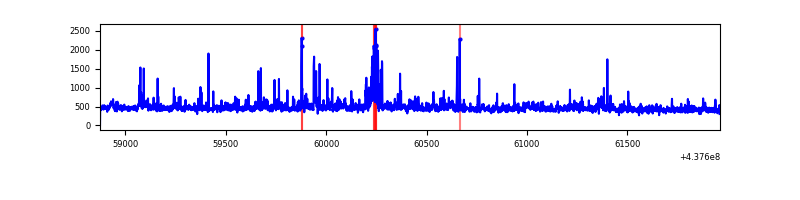 |
| C | 3087 | 3087 | 69 | 69 | 2.24% | 2.24% | 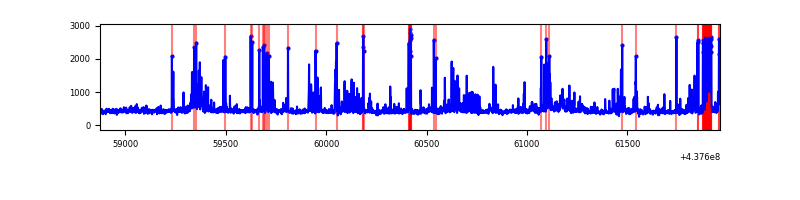 |
| D | 3087 | 3087 | 353 | 353 | 11.44% | 11.44% | 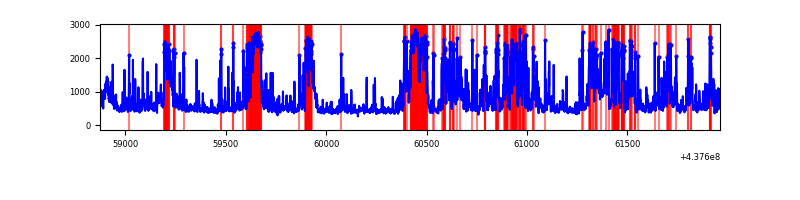 |
Top three noisy pixels from each quadrant. If the there are fewer than three noisy pixels in the level2.evt file, extra rows are filled as -1
| Pixel properties | Quadrant properties | ||||||
|---|---|---|---|---|---|---|---|
| Quadrant | DetID | PixID | Counts | Sigma | Mean | Median | Sigma |
| A | 14 | 238 | 548280 | 8023.28 | 319 | 312 | 68.3 |
| A | 15 | 222 | 530033 | 7756.11 | 319 | 312 | 68.3 |
| A | 10 | 83 | 525779 | 7693.82 | 319 | 312 | 68.3 |
| B | 5 | 172 | 93225 | 1452.5 | 318 | 309 | 64.0 |
| B | 4 | 173 | 44274 | 687.28 | 318 | 309 | 64.0 |
| B | 0 | 200 | 28171 | 435.55 | 318 | 309 | 64.0 |
| C | 15 | 158 | 209745 | 2825.63 | 311 | 312 | 74.1 |
| C | 1 | 241 | 88681 | 1192.26 | 311 | 312 | 74.1 |
| C | 15 | 157 | 62502 | 839.06 | 311 | 312 | 74.1 |
| D | 7 | 204 | 664703 | 8546.55 | 305 | 296 | 77.7 |
| D | 12 | 233 | 197713 | 2539.46 | 305 | 296 | 77.7 |
| D | 5 | 235 | 135645 | 1741.05 | 305 | 296 | 77.7 |
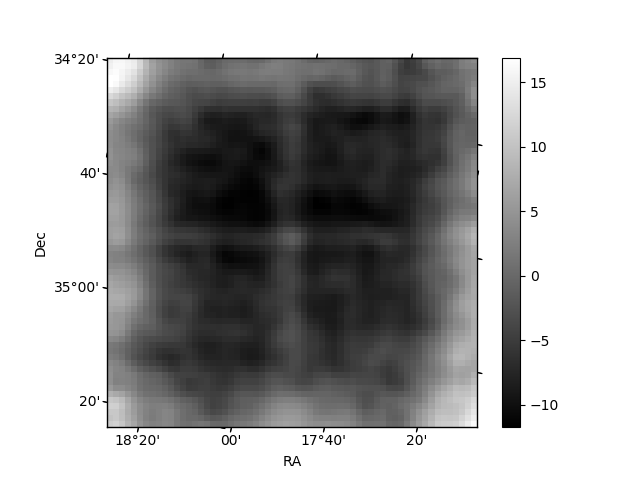
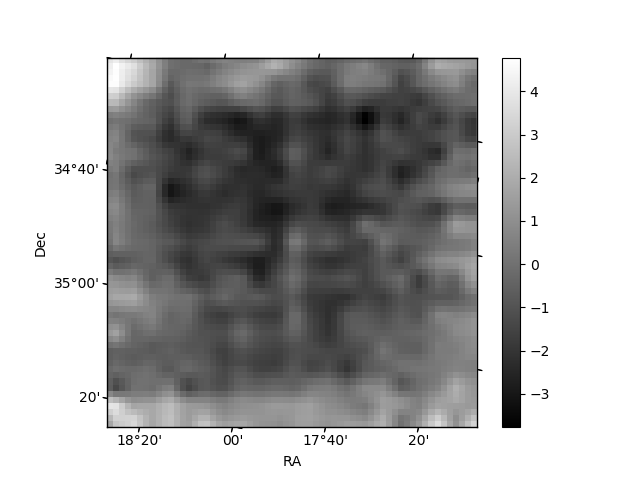
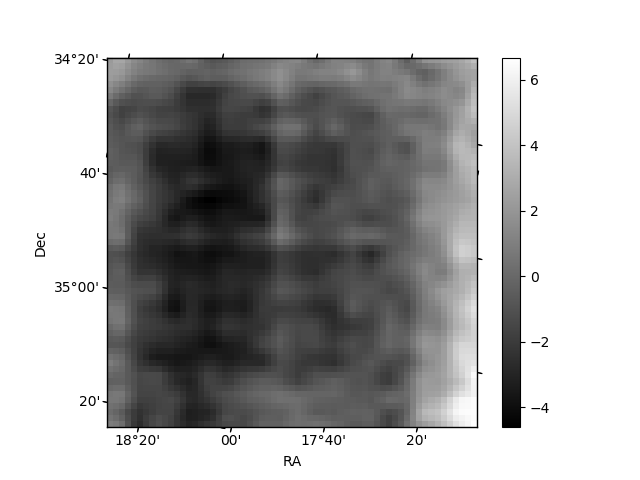
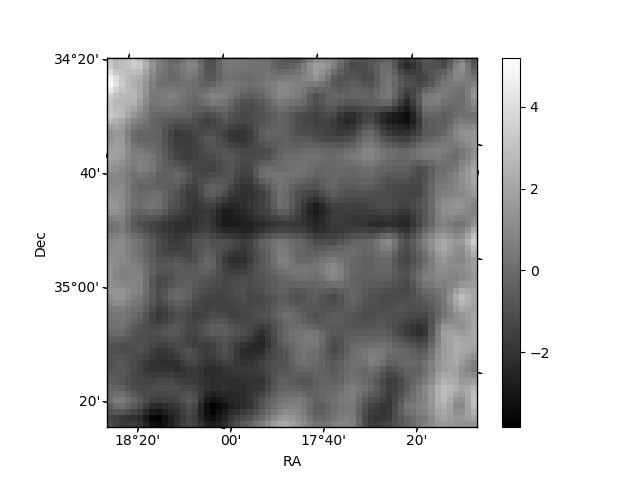
Histogram calculated using DETX and DETY for each event in the final _common_clean file
| Quadrant A | 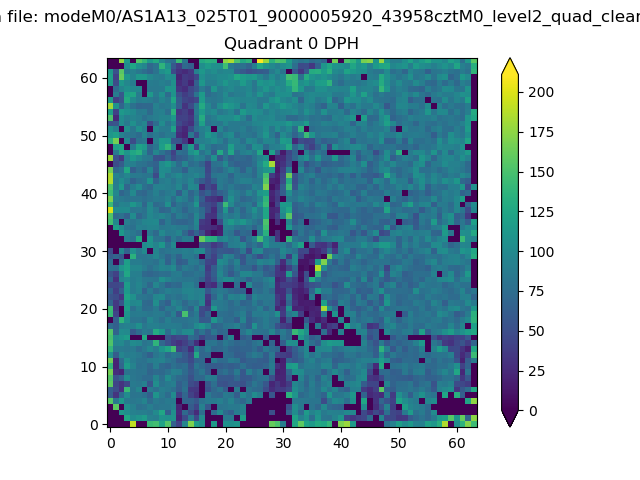 |
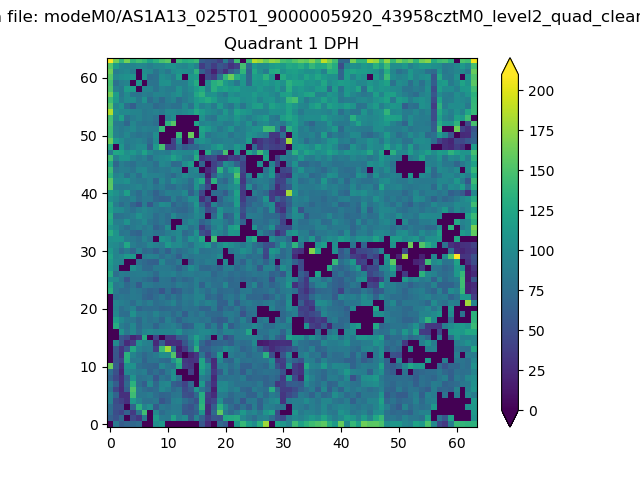 |
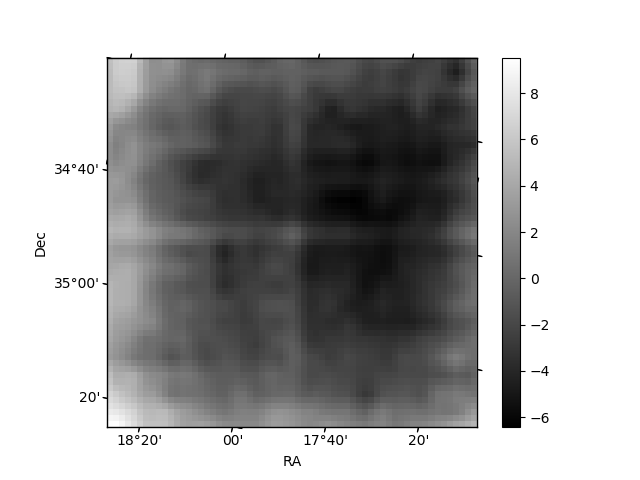
Quadrant B |
|---|---|---|---|
| Quadrant D | 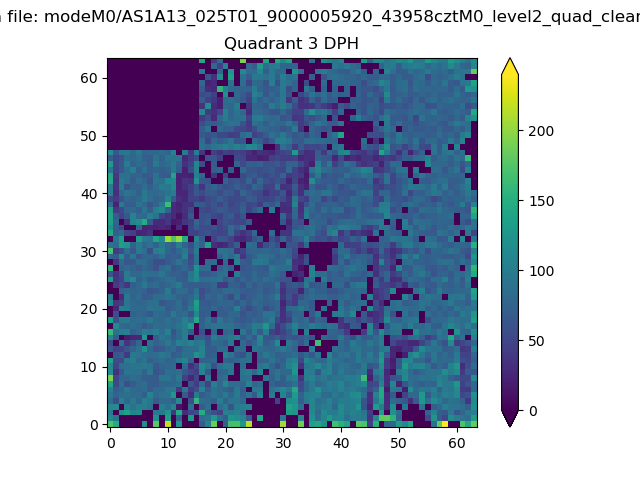 |
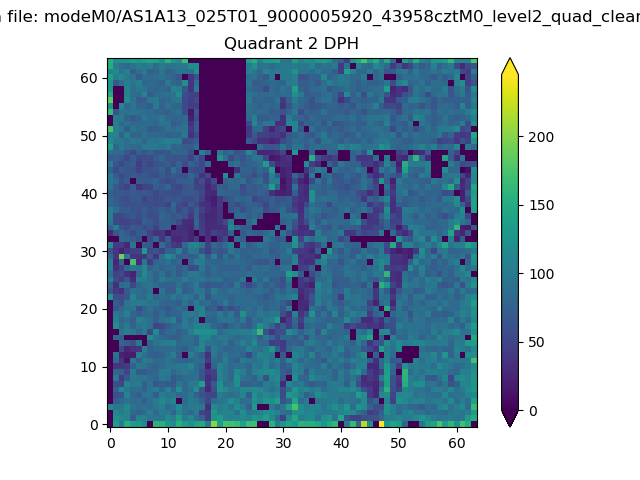 |
Quadrant C |
| Plot type | Count rate plots | Images |
|---|---|---|
| Comparison with Poisson distribution Blue bars denote a histogram of data divided into 1 sec bins. Red curve is a Poisson curve with rate = median count rate of data. |
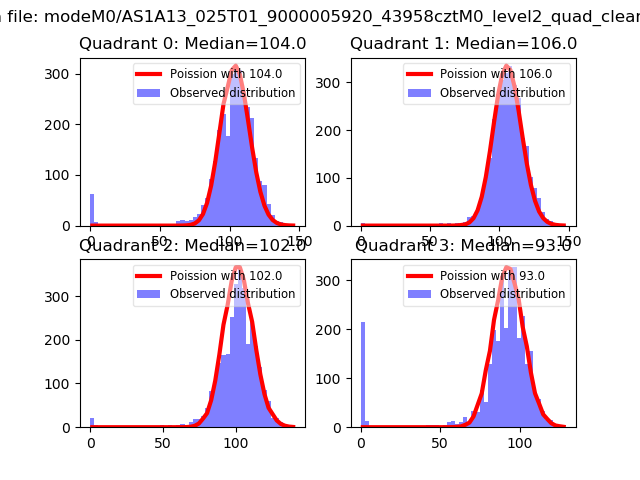 |
 |
| Quadrant-wise count rates Data is divided into 100 sec bins |
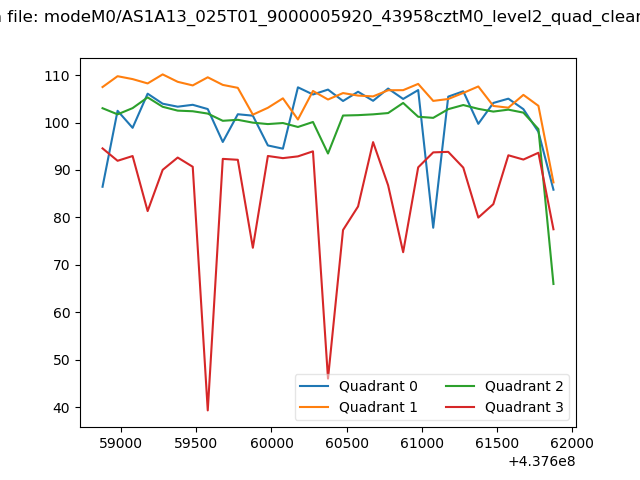 |
|
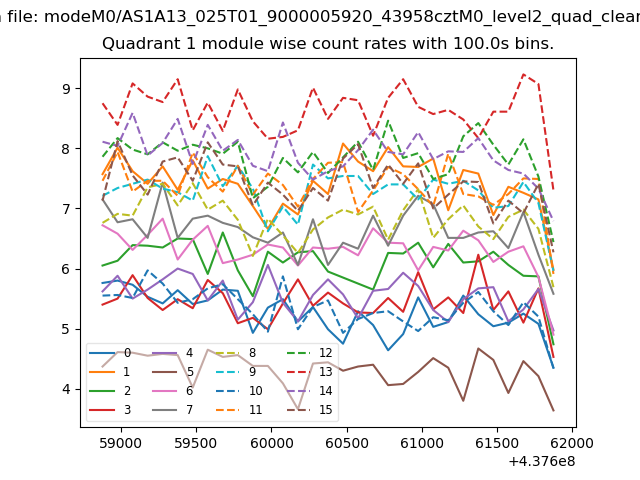
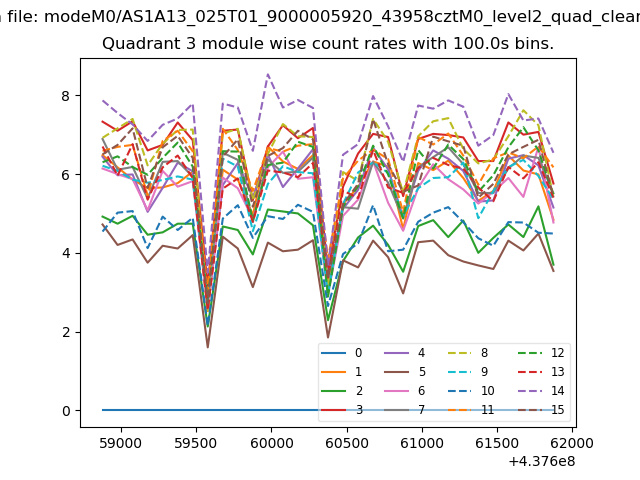
| Module-wise count rates for Quadrant A Data is divided into 100 sec bins |
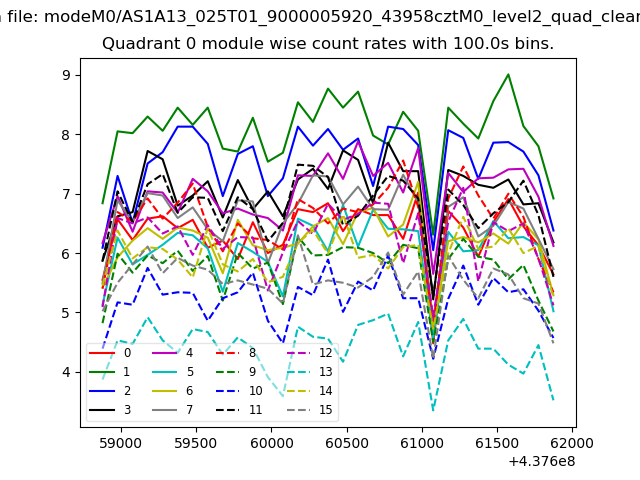 |
 |
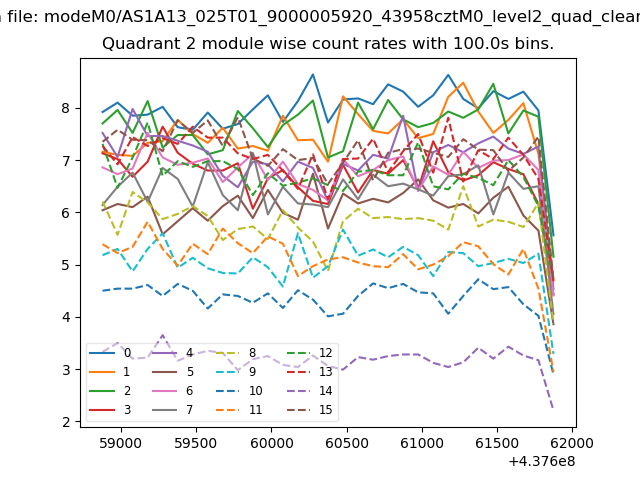
| Module-wise count rates for Quadrant B Data is divided into 100 sec bins |
 |
 |
| Module-wise count rates for Quadrant C Data is divided into 100 sec bins |
 |
 |
| Module-wise count rates for Quadrant D Data is divided into 100 sec bins |
 |
 |
| Parameter | Plot |
|---|---|
| CZT HV Monitor | 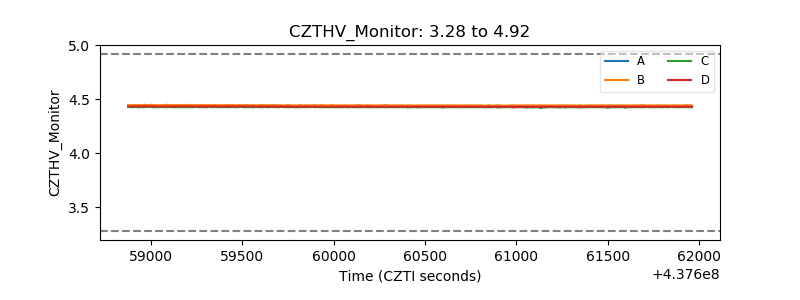 |
| D_VDD | 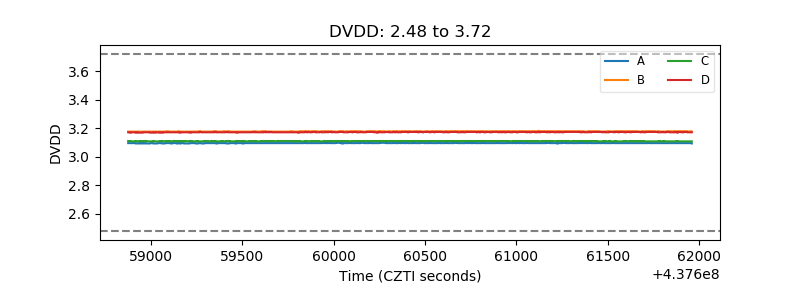 |
| Temperature 1 | 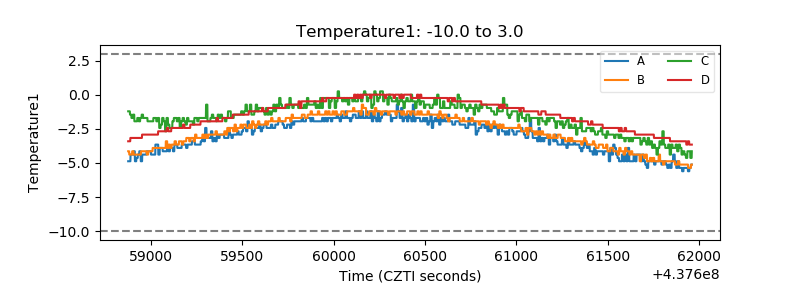 |
| Veto HV Monitor | 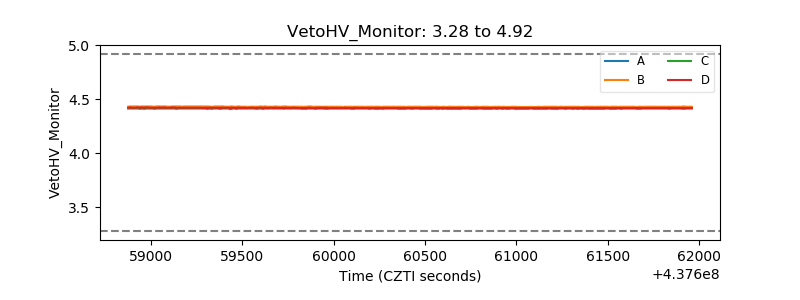 |
| Veto LLD | 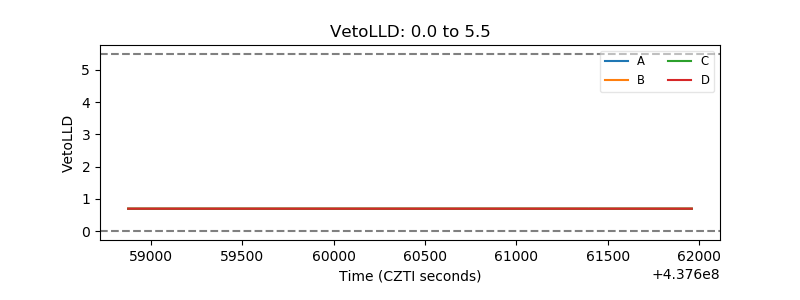 |
| Alpha Counter | 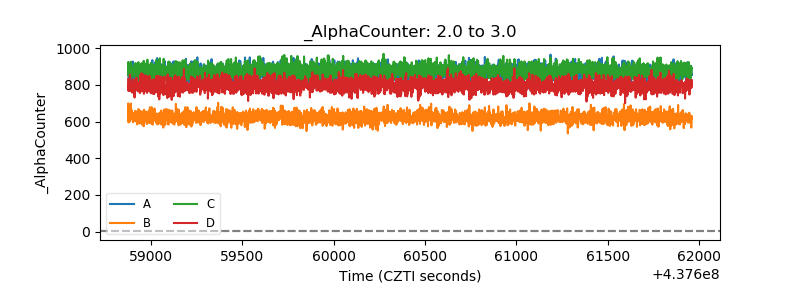 |
| _CPM_Rate | 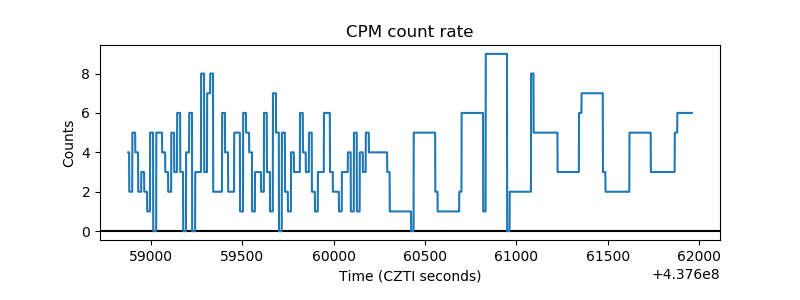 |
| CZT Counter | 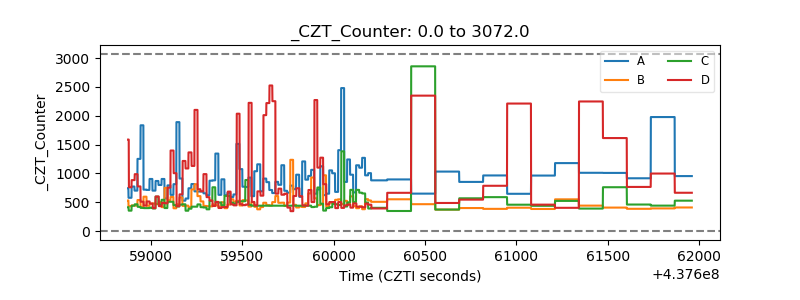 |
| +2.5 Volts monitor | 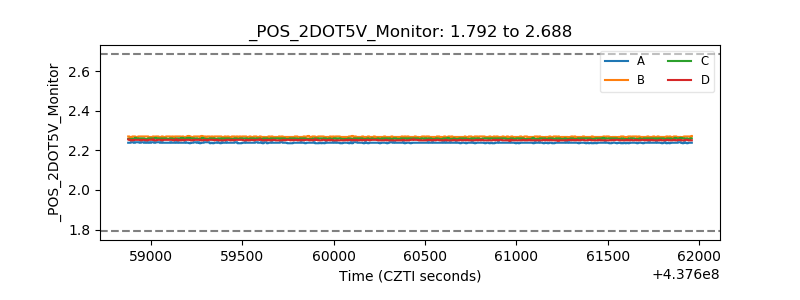 |
| +5 Volts monitor | 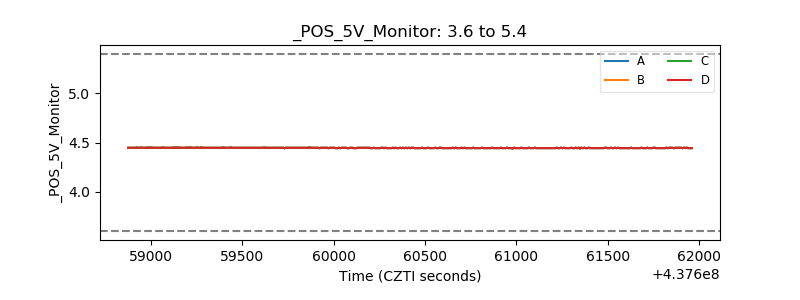 |
| _ROLL_ROT | 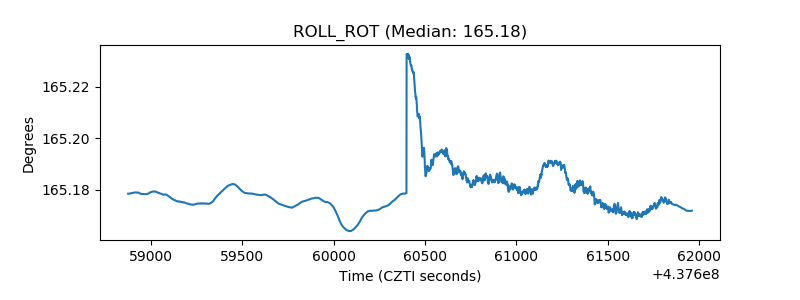 |
| _Roll_DEC | 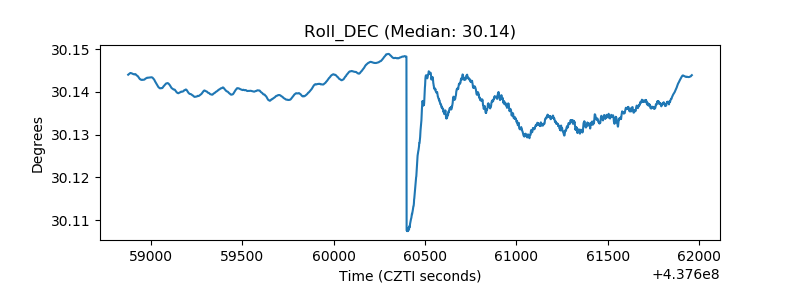 |
| _Roll_RA | 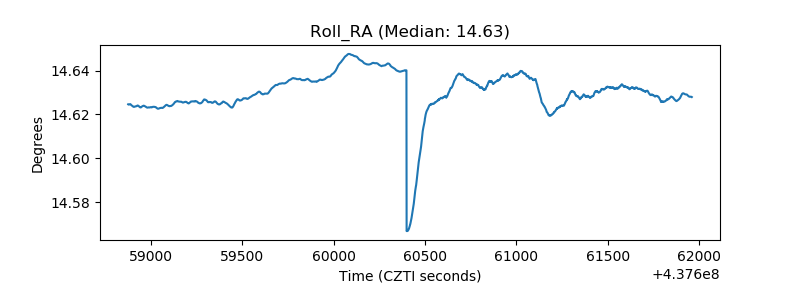 |
| Veto Counter | 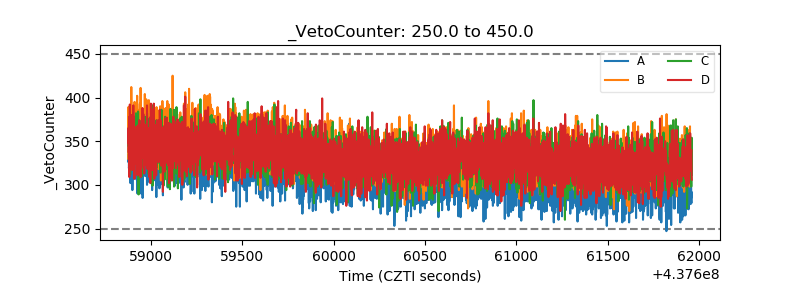 |