| Param | Original file | Final file |
|---|---|---|
| Filename | modeM0/AS1A13_065T02_9000005922_43958cztM0_level2.fits | modeM0/AS1A13_065T02_9000005922_43958cztM0_level2_quad_clean.evt |
| Size (bytes) | 409,999,680 | 51,307,200 |
| Size | 391.0 MB | 48.9 MB |
| Events in quadrant A | 6,734,504 | 165,679 |
| Events in quadrant B | 1,988,161 | 410,415 |
| Events in quadrant C | 2,391,407 | 390,721 |
| Events in quadrant D | 3,772,857 | 323,980 |
| Mode SS | |||
|---|---|---|---|
| Quadrant | BADHDUFLAG | Total packets | Discarded packets |
| A | 0 | 74 | 0 |
| B | 0 | 74 | 0 |
| C | 0 | 74 | 0 |
| D | 0 | 74 | 0 |
| Mode M0 | |||
|---|---|---|---|
| Quadrant | BADHDUFLAG | Total packets | Discarded packets |
| A | 0 | 22557 | 0 |
| B | 0 | 8347 | 0 |
| C | 0 | 9666 | 0 |
| D | 0 | 13687 | 0 |
| Quadrant | Total seconds | Saturated seconds | Saturation percentage |
|---|---|---|---|
| A | 3711 | 2436 | 65.642684% |
| B | 3711 | 144 | 3.880356% |
| C | 3711 | 174 | 4.688763% |
| D | 3711 | 569 | 15.332794% |
Noise dominated data is calculated using 1-second bins in cleaned event files. If a bin has >2000 counts, and if more than 50% of those come from <1% of pixels, then it is considered to be noise-dominated and hence unusable.
| Quadrant | # 1 sec bins | Bins with >0 counts | Bins with >2000 counts | High rate bins dominated by noise | Noise dominated (total time) | Noise dominated (detector-on time) | Marked lightcurve |
|---|---|---|---|---|---|---|---|
| A | 3710 | 3710 | 1435 | 1435 | 38.68% | 38.68% | 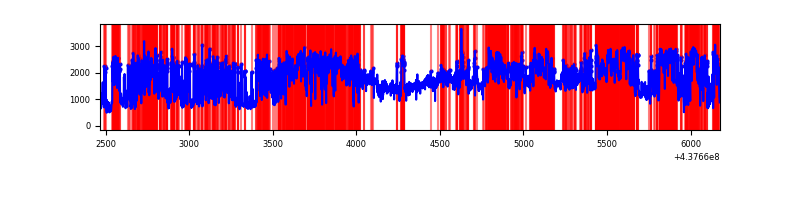 |
| B | 3710 | 3710 | 6 | 6 | 0.16% | 0.16% | 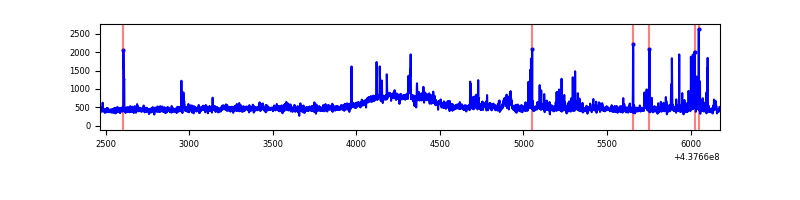 |
| C | 3710 | 3710 | 117 | 117 | 3.15% | 3.15% | 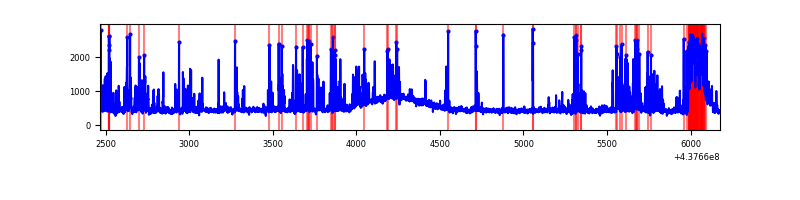 |
| D | 3710 | 3710 | 512 | 512 | 13.80% | 13.80% | 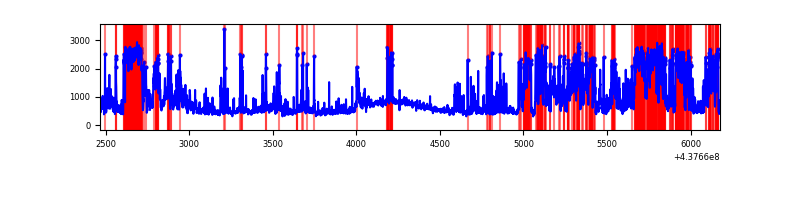 |
Top three noisy pixels from each quadrant. If the there are fewer than three noisy pixels in the level2.evt file, extra rows are filled as -1
| Pixel properties | Quadrant properties | ||||||
|---|---|---|---|---|---|---|---|
| Quadrant | DetID | PixID | Counts | Sigma | Mean | Median | Sigma |
| A | 15 | 223 | 4484730 | 66855.11 | 317 | 309 | 67.1 |
| A | 14 | 238 | 486451 | 7247.55 | 317 | 309 | 67.1 |
| A | 10 | 83 | 380975 | 5675.08 | 317 | 309 | 67.1 |
| B | 0 | 200 | 46487 | 508.16 | 447 | 431 | 90.6 |
| B | 5 | 172 | 41525 | 453.41 | 447 | 431 | 90.6 |
| B | 4 | 158 | 38637 | 421.54 | 447 | 431 | 90.6 |
| C | 15 | 158 | 460690 | 4415.24 | 435 | 436 | 104.2 |
| C | 14 | 254 | 140018 | 1339.02 | 435 | 436 | 104.2 |
| C | 15 | 157 | 53172 | 505.9 | 435 | 436 | 104.2 |
| D | 1 | 52 | 631994 | 5771.41 | 423 | 408 | 109.4 |
| D | 12 | 17 | 502056 | 4584.04 | 423 | 408 | 109.4 |
| D | 12 | 233 | 364171 | 3324.05 | 423 | 408 | 109.4 |
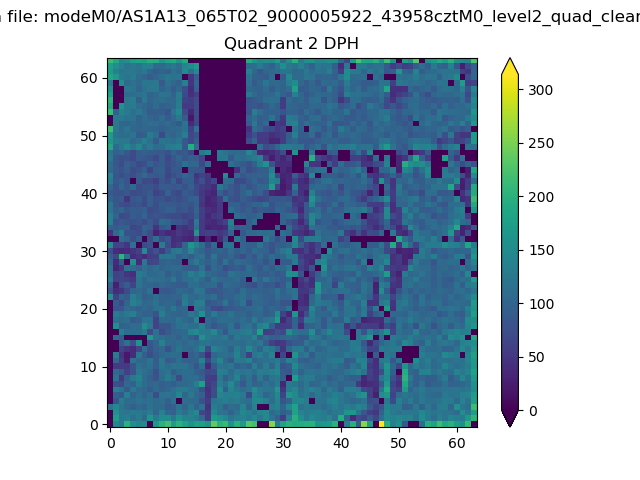
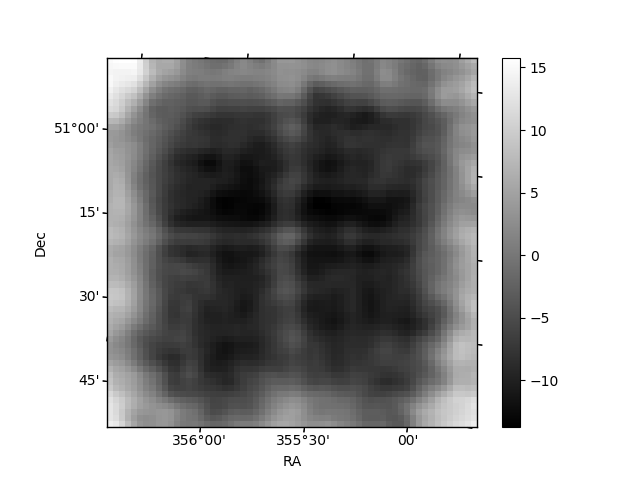
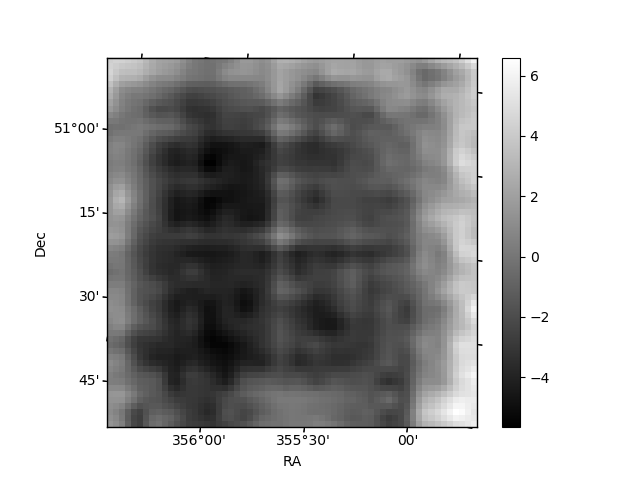
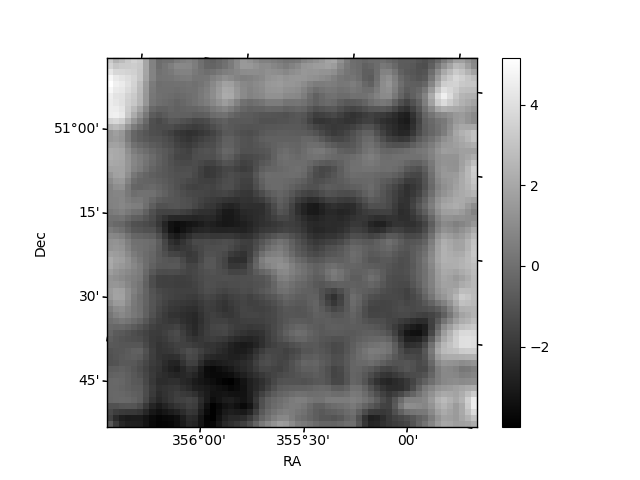
Histogram calculated using DETX and DETY for each event in the final _common_clean file
| Quadrant A | 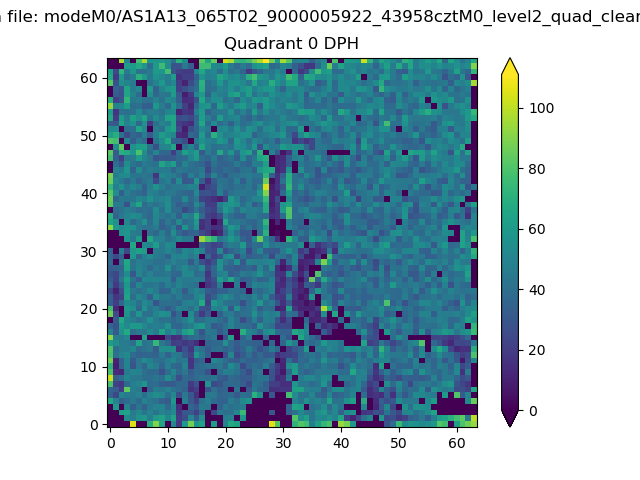 |
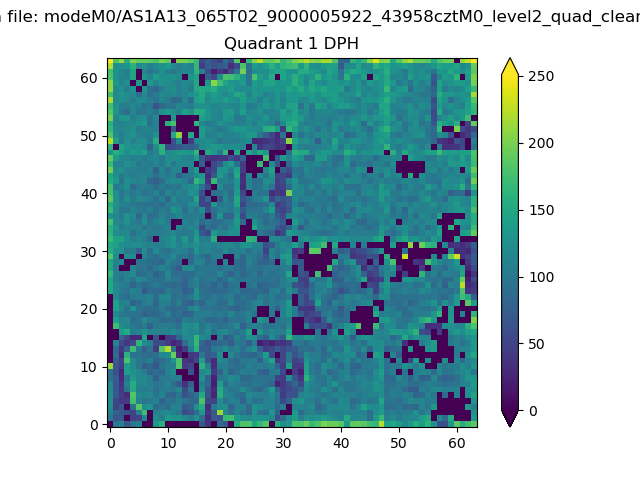 |
Quadrant B |
|---|---|---|---|
| Quadrant D | 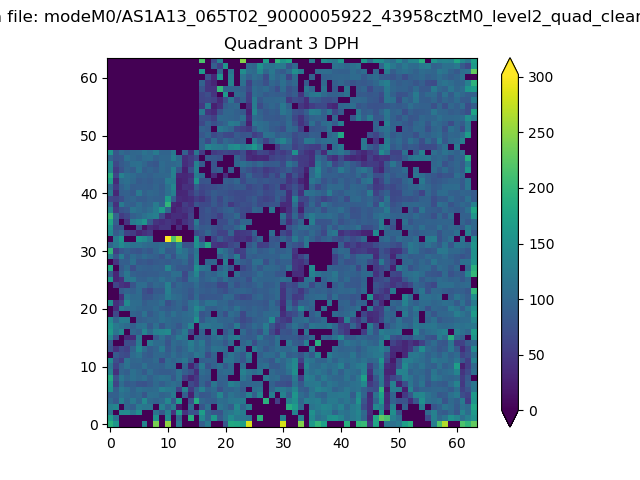 |
 |
Quadrant C |
| Plot type | Count rate plots | Images |
|---|---|---|
| Comparison with Poisson distribution Blue bars denote a histogram of data divided into 1 sec bins. Red curve is a Poisson curve with rate = median count rate of data. |
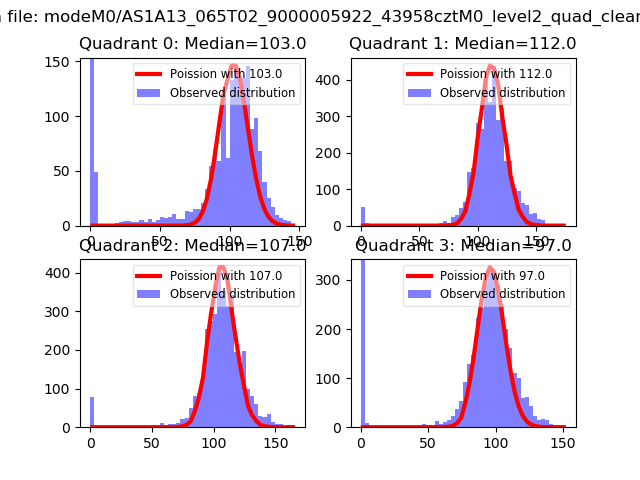 |
 |
| Quadrant-wise count rates Data is divided into 100 sec bins |
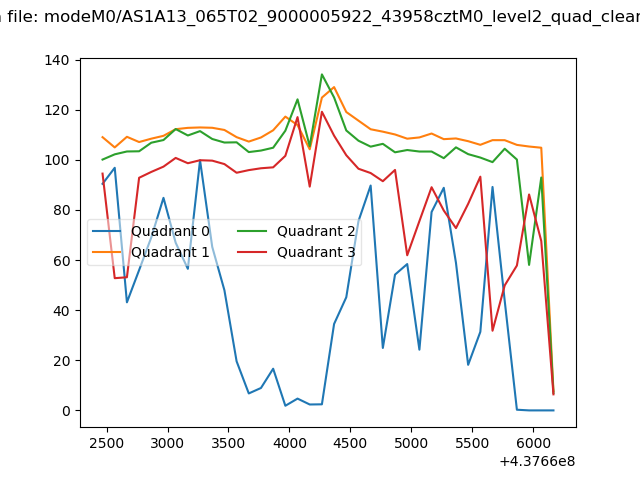 |
|
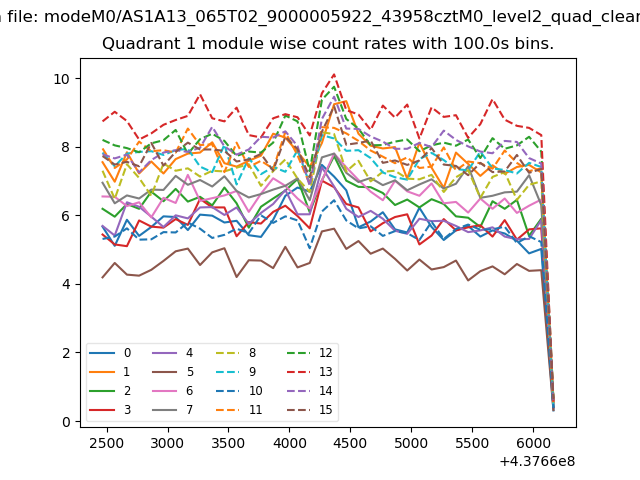
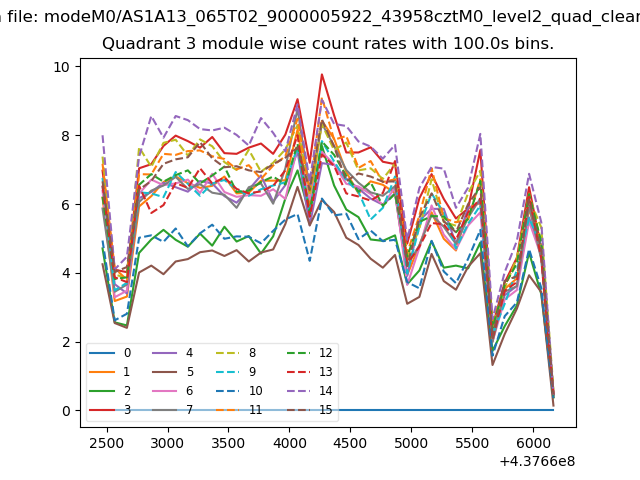
| Module-wise count rates for Quadrant A Data is divided into 100 sec bins |
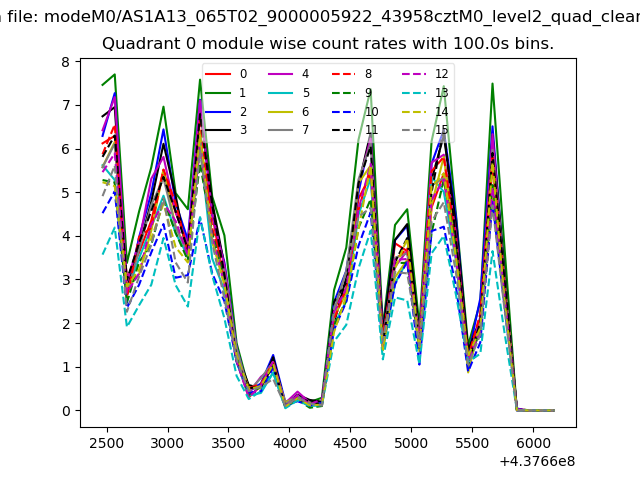 |
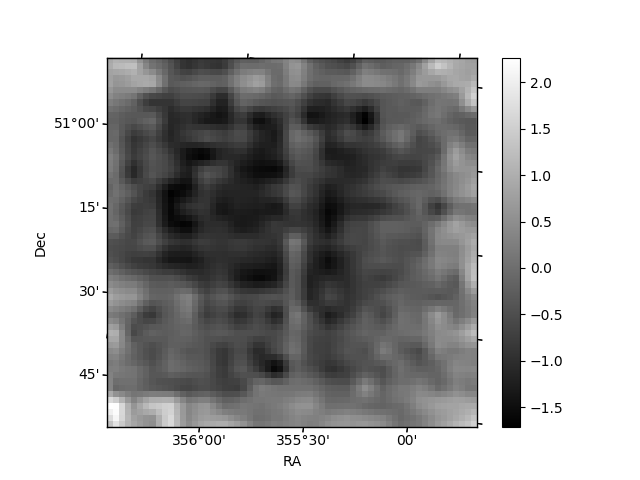 |
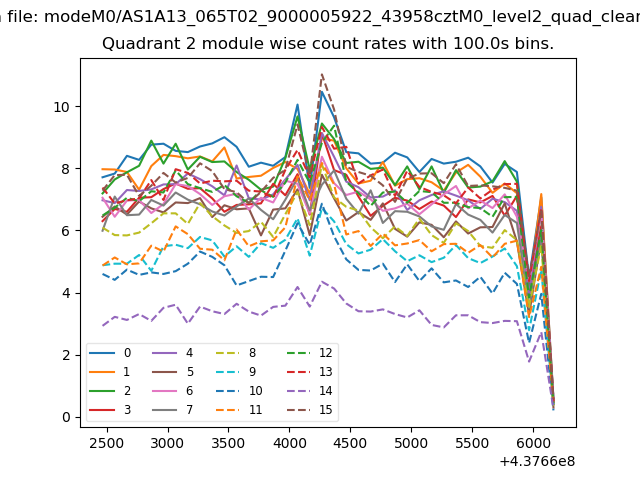
| Module-wise count rates for Quadrant B Data is divided into 100 sec bins |
 |
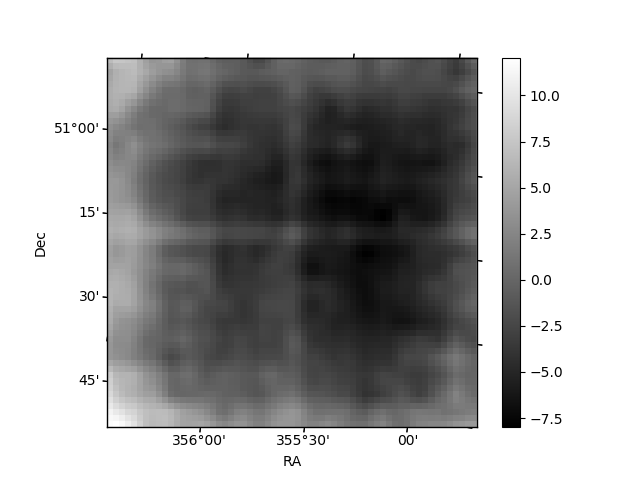 |
| Module-wise count rates for Quadrant C Data is divided into 100 sec bins |
 |
 |
| Module-wise count rates for Quadrant D Data is divided into 100 sec bins |
 |
 |
| Parameter | Plot |
|---|---|
| CZT HV Monitor | 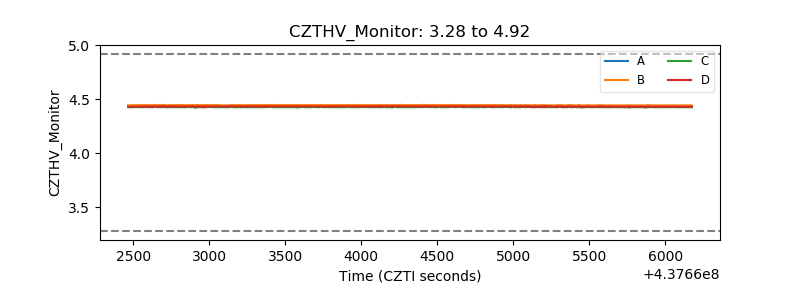 |
| D_VDD | 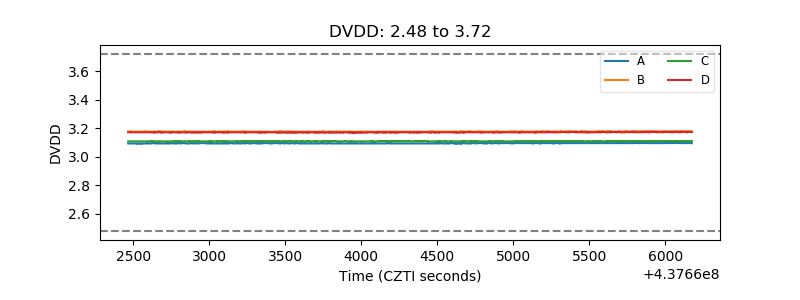 |
| Temperature 1 | 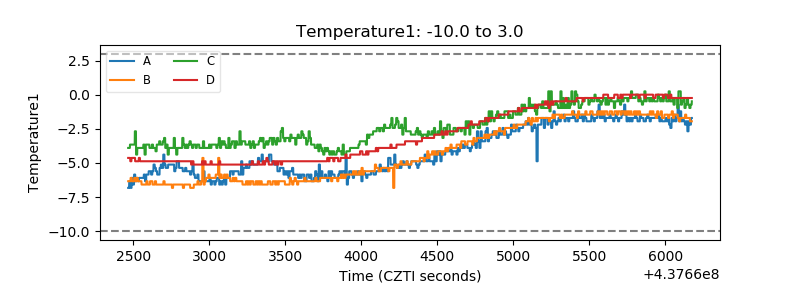 |
| Veto HV Monitor |  |
| Veto LLD |  |
| Alpha Counter | 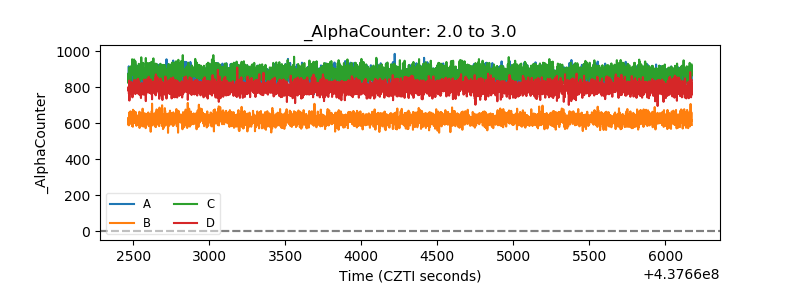 |
| _CPM_Rate | 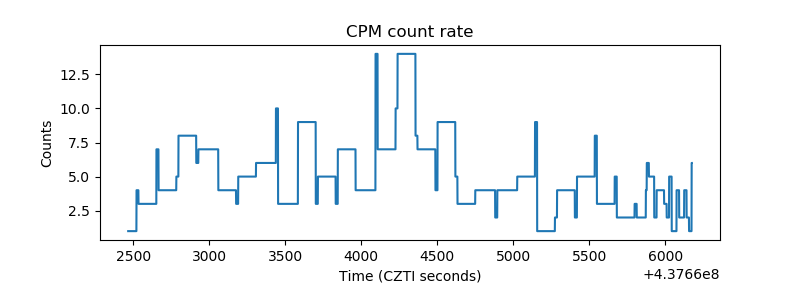 |
| CZT Counter | 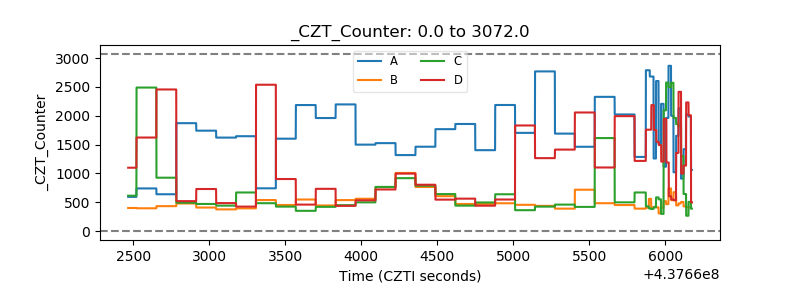 |
| +2.5 Volts monitor | 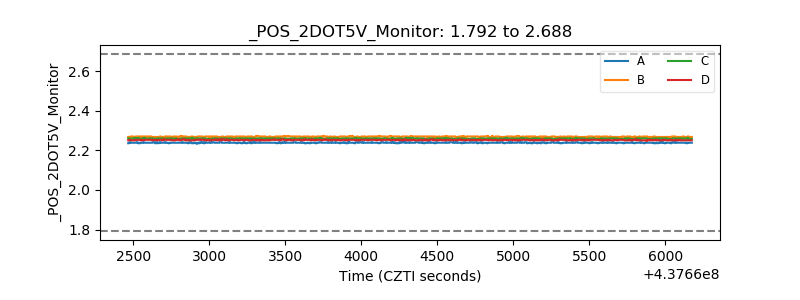 |
| +5 Volts monitor | 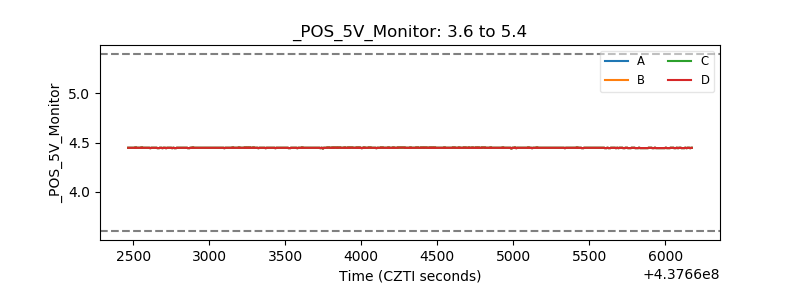 |
| _ROLL_ROT | 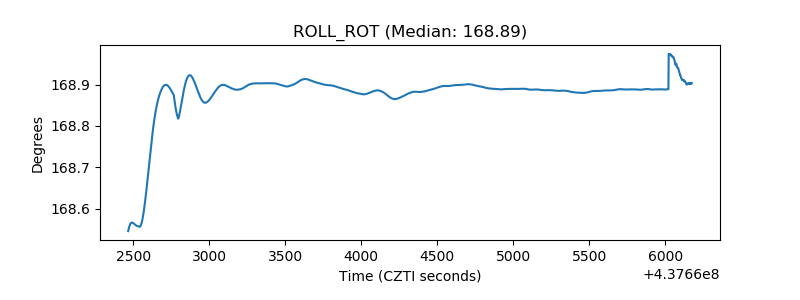 |
| _Roll_DEC | 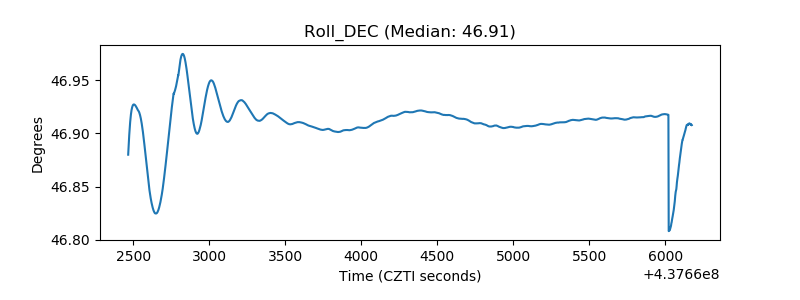 |
| _Roll_RA | 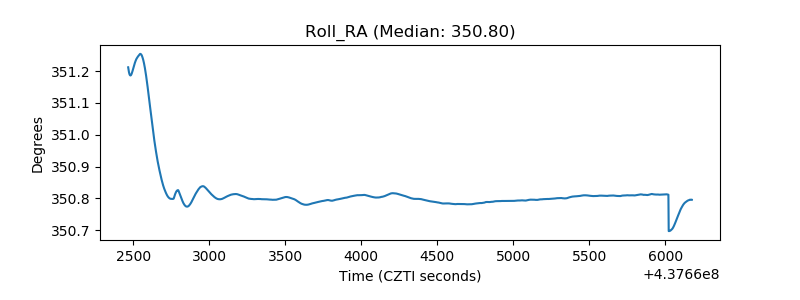 |
| Veto Counter | 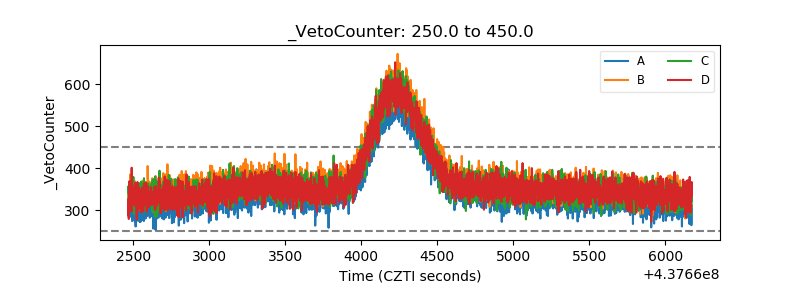 |