| Param | Original file | Final file |
|---|---|---|
| Filename | modeM0/AS1A13_065T06_9000005924_43986cztM0_level2.fits | modeM0/AS1A13_065T06_9000005924_43986cztM0_level2_quad_clean.evt |
| Size (bytes) | 695,151,360 | 103,006,080 |
| Size | 662.9 MB | 98.2 MB |
| Events in quadrant A | 9,843,562 | 440,928 |
| Events in quadrant B | 5,103,997 | 746,797 |
| Events in quadrant C | 3,861,680 | 764,688 |
| Events in quadrant D | 6,350,274 | 653,538 |
| Mode SS | |||
|---|---|---|---|
| Quadrant | BADHDUFLAG | Total packets | Discarded packets |
| A | 0 | 146 | 0 |
| B | 0 | 146 | 0 |
| C | 0 | 146 | 0 |
| D | 0 | 146 | 0 |
| Mode M0 | |||
|---|---|---|---|
| Quadrant | BADHDUFLAG | Total packets | Discarded packets |
| A | 0 | 34685 | 0 |
| B | 0 | 20192 | 0 |
| C | 0 | 16762 | 0 |
| D | 0 | 23878 | 0 |
| Quadrant | Total seconds | Saturated seconds | Saturation percentage |
|---|---|---|---|
| A | 7367 | 3440 | 46.694720% |
| B | 7368 | 698 | 9.473398% |
| C | 7368 | 178 | 2.415852% |
| D | 7367 | 722 | 9.800462% |
Noise dominated data is calculated using 1-second bins in cleaned event files. If a bin has >2000 counts, and if more than 50% of those come from <1% of pixels, then it is considered to be noise-dominated and hence unusable.
| Quadrant | # 1 sec bins | Bins with >0 counts | Bins with >2000 counts | High rate bins dominated by noise | Noise dominated (total time) | Noise dominated (detector-on time) | Marked lightcurve |
|---|---|---|---|---|---|---|---|
| A | 7367 | 7367 | 1513 | 1513 | 20.54% | 20.54% | 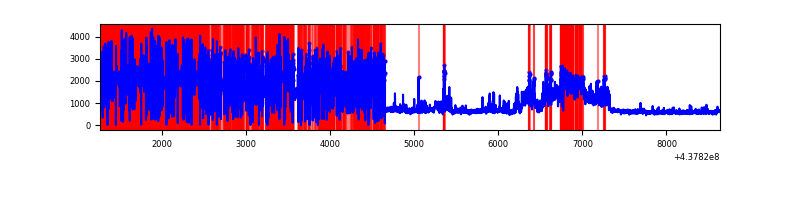 |
| B | 7368 | 7368 | 490 | 490 | 6.65% | 6.65% | 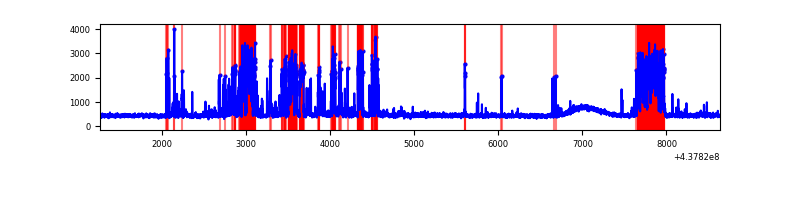 |
| C | 7368 | 7368 | 132 | 132 | 1.79% | 1.79% | 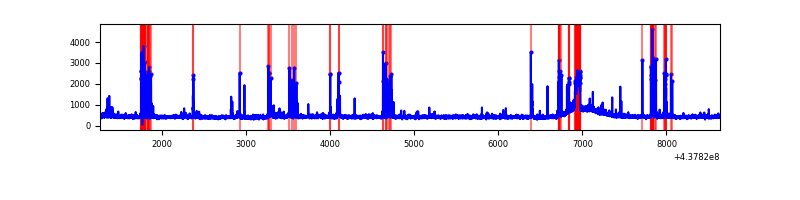 |
| D | 7367 | 7367 | 562 | 562 | 7.63% | 7.63% | 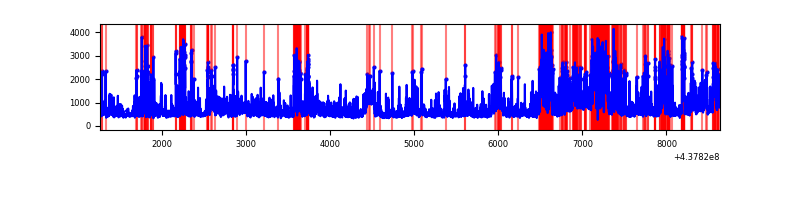 |
Top three noisy pixels from each quadrant. If the there are fewer than three noisy pixels in the level2.evt file, extra rows are filled as -1
| Pixel properties | Quadrant properties | ||||||
|---|---|---|---|---|---|---|---|
| Quadrant | DetID | PixID | Counts | Sigma | Mean | Median | Sigma |
| A | 15 | 223 | 5849262 | 49045.68 | 557 | 544 | 119.3 |
| A | 15 | 222 | 895630 | 7505.94 | 557 | 544 | 119.3 |
| A | 10 | 83 | 714638 | 5988.19 | 557 | 544 | 119.3 |
| B | 5 | 172 | 1710721 | 10695.47 | 800 | 775 | 159.9 |
| B | 4 | 173 | 47915 | 294.85 | 800 | 775 | 159.9 |
| B | 0 | 200 | 32298 | 197.17 | 800 | 775 | 159.9 |
| C | 15 | 158 | 213457 | 1096.71 | 814 | 817 | 193.9 |
| C | 8 | 222 | 146803 | 752.93 | 814 | 817 | 193.9 |
| C | 15 | 157 | 99831 | 510.67 | 814 | 817 | 193.9 |
| D | 12 | 17 | 1136801 | 5668.8 | 785 | 758 | 200.4 |
| D | 1 | 52 | 871080 | 4342.86 | 785 | 758 | 200.4 |
| D | 7 | 80 | 509996 | 2541.07 | 785 | 758 | 200.4 |
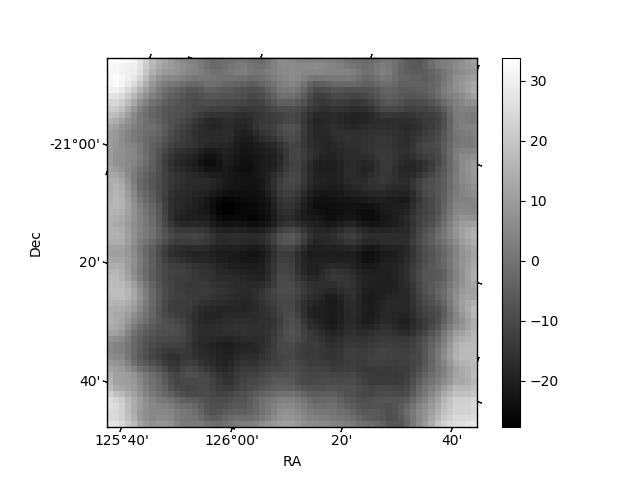
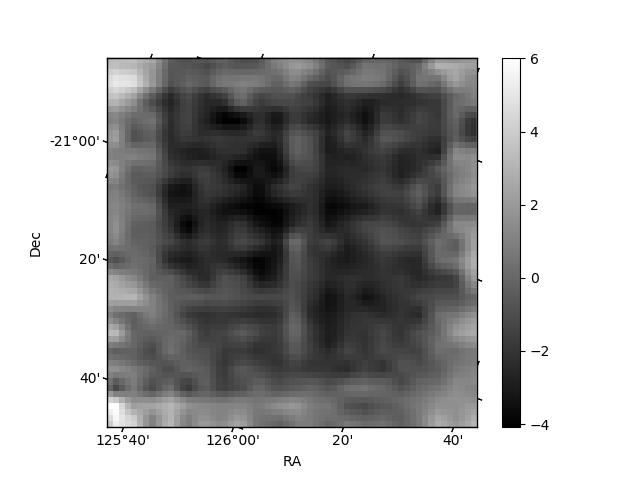
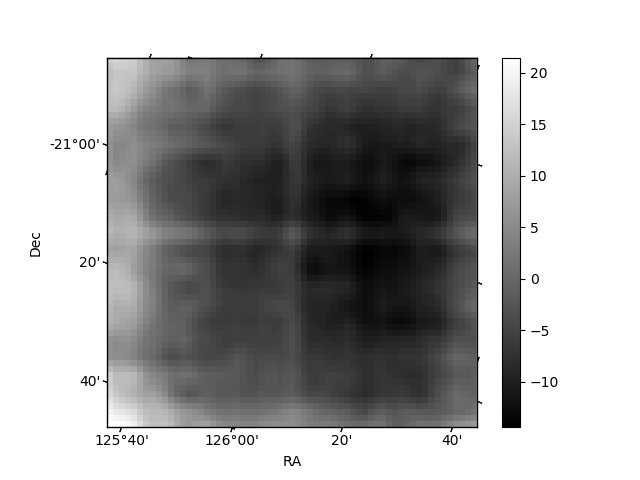
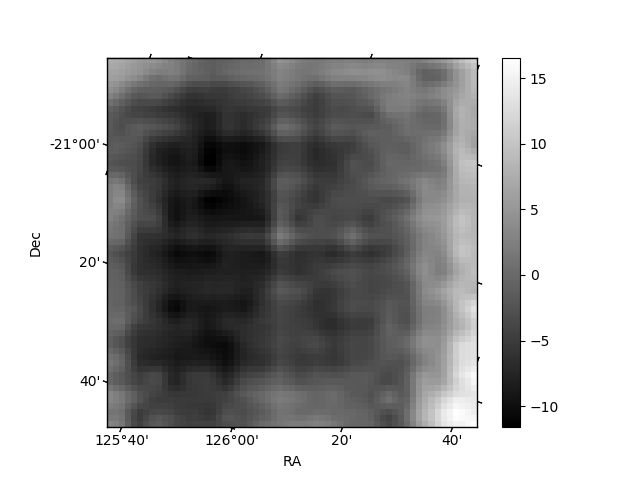
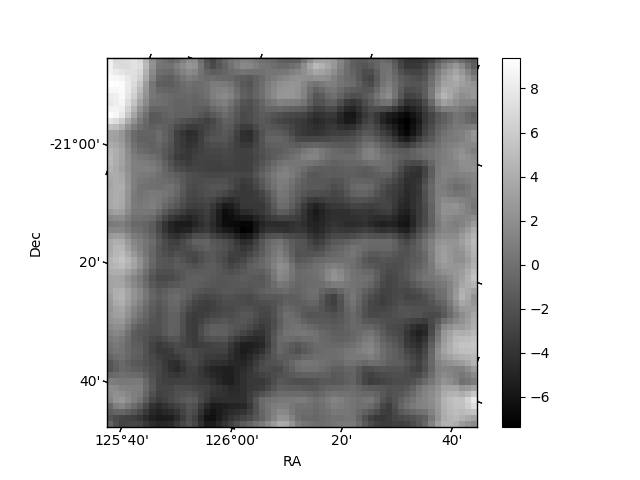
Histogram calculated using DETX and DETY for each event in the final _common_clean file
| Quadrant A | 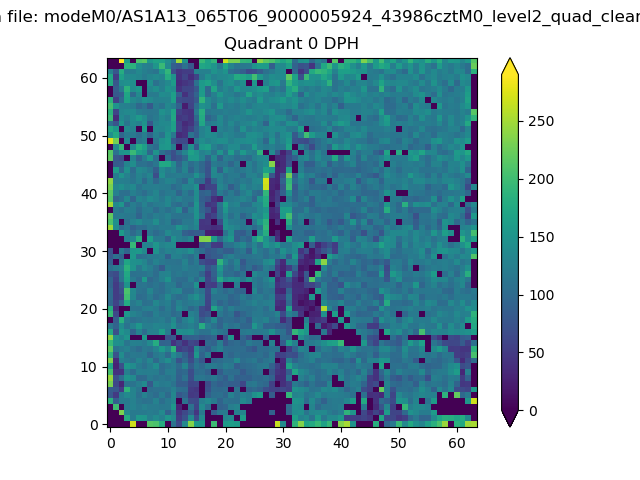 |
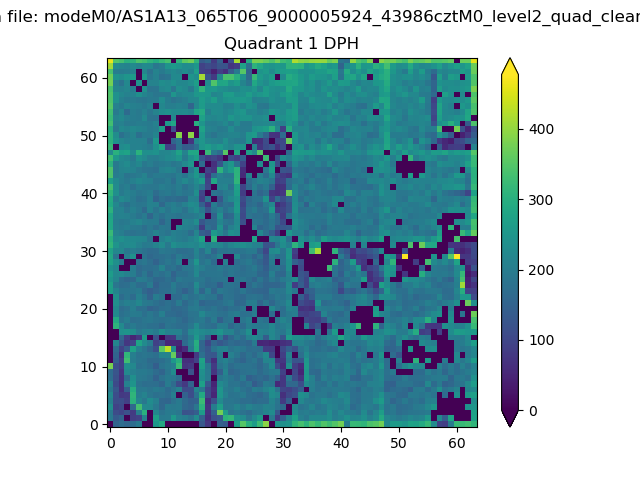 |
Quadrant B |
|---|---|---|---|
| Quadrant D | 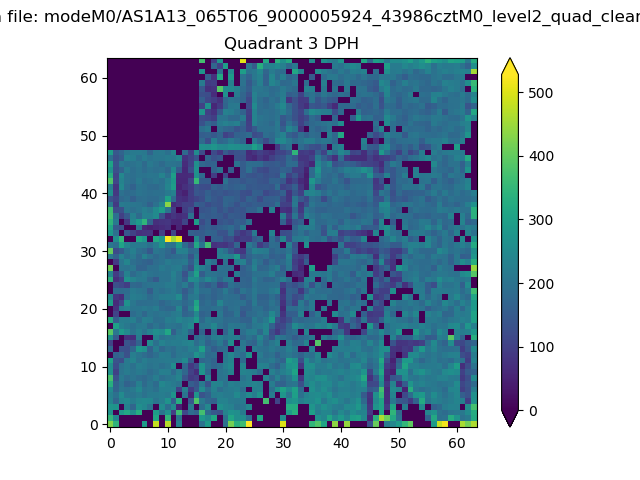 |
 |
Quadrant C |
| Plot type | Count rate plots | Images |
|---|---|---|
| Comparison with Poisson distribution Blue bars denote a histogram of data divided into 1 sec bins. Red curve is a Poisson curve with rate = median count rate of data. |
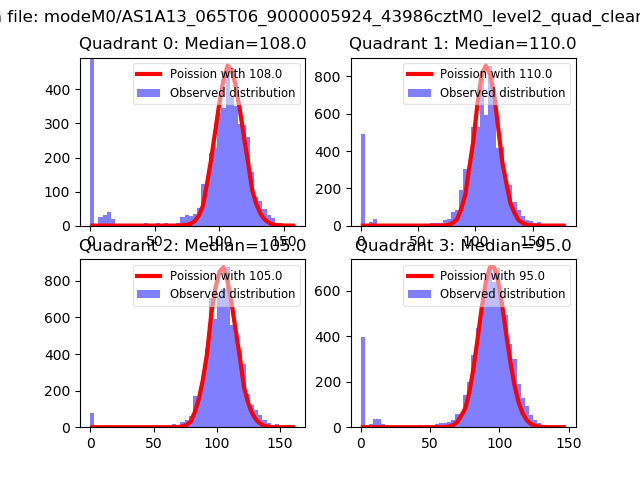 |
 |
| Quadrant-wise count rates Data is divided into 100 sec bins |
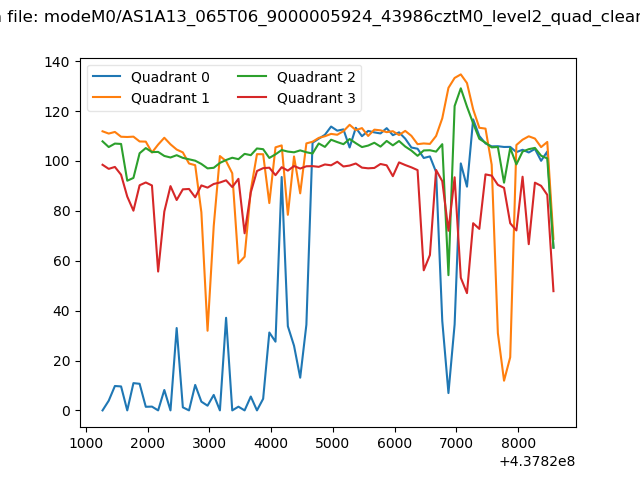 |
|
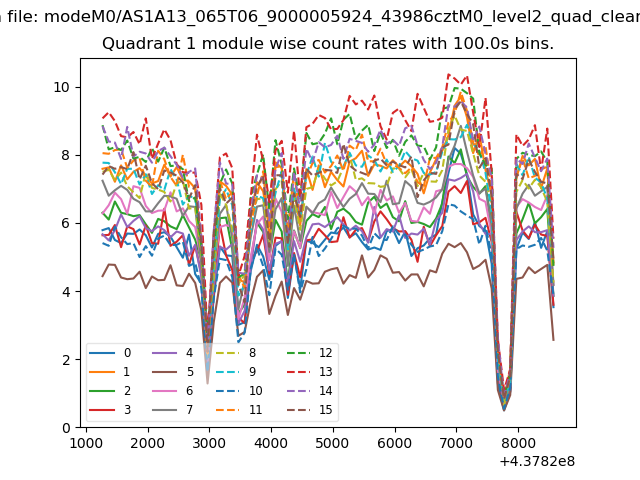
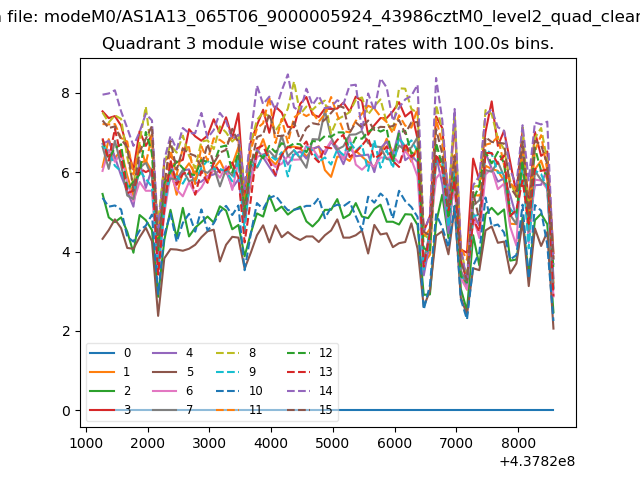
| Module-wise count rates for Quadrant A Data is divided into 100 sec bins |
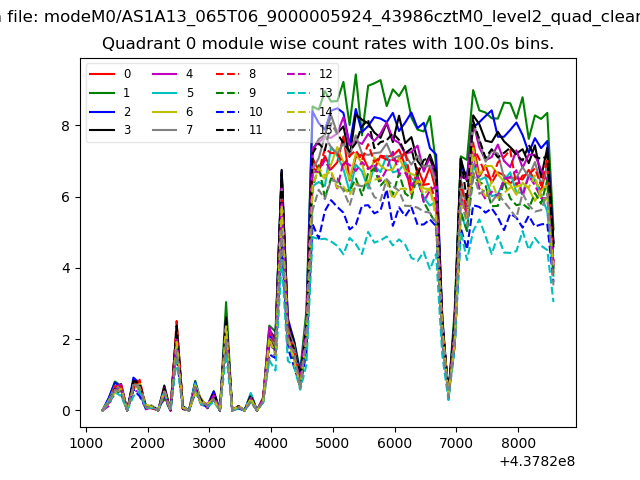 |
 |
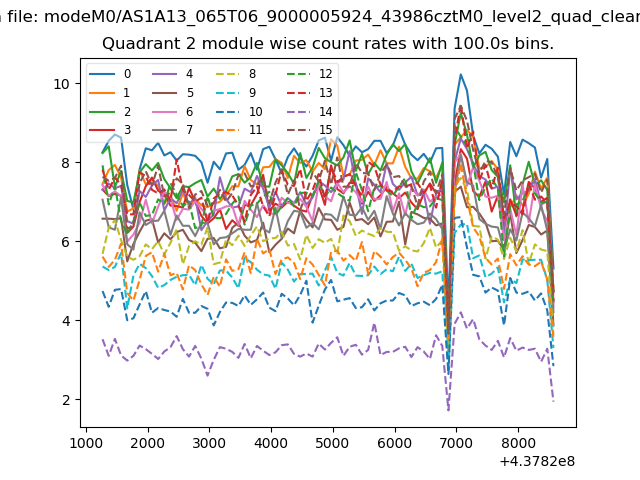
| Module-wise count rates for Quadrant B Data is divided into 100 sec bins |
 |
 |
| Module-wise count rates for Quadrant C Data is divided into 100 sec bins |
 |
 |
| Module-wise count rates for Quadrant D Data is divided into 100 sec bins |
 |
 |
| Parameter | Plot |
|---|---|
| CZT HV Monitor | 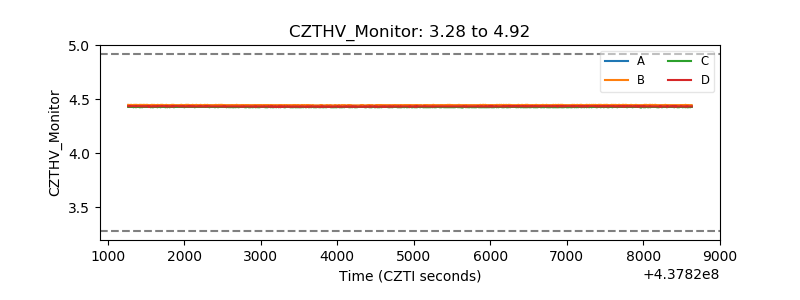 |
| D_VDD | 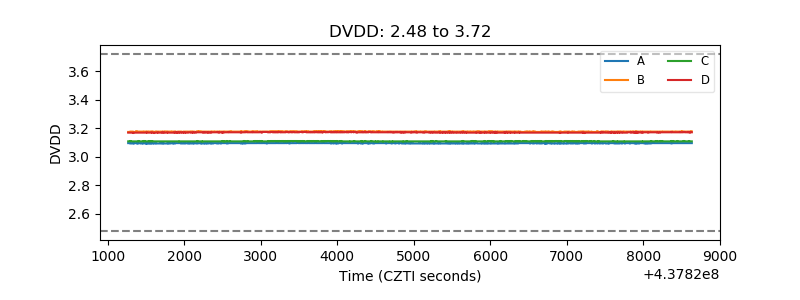 |
| Temperature 1 | 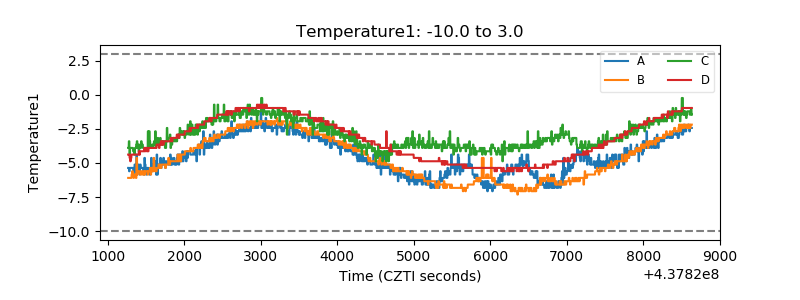 |
| Veto HV Monitor | 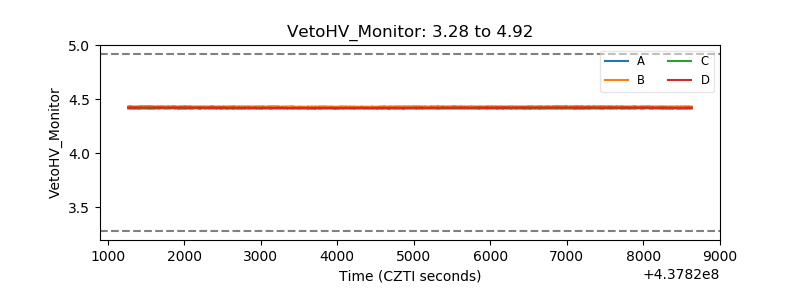 |
| Veto LLD | 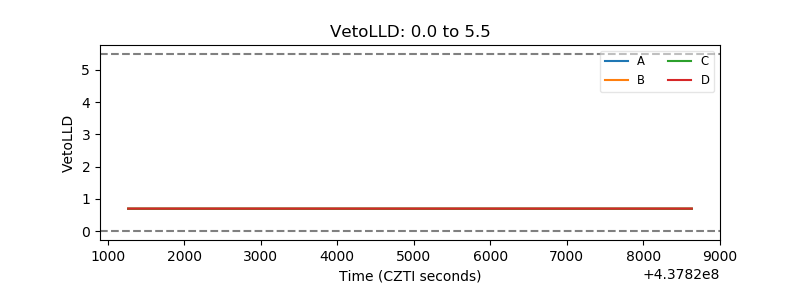 |
| Alpha Counter | 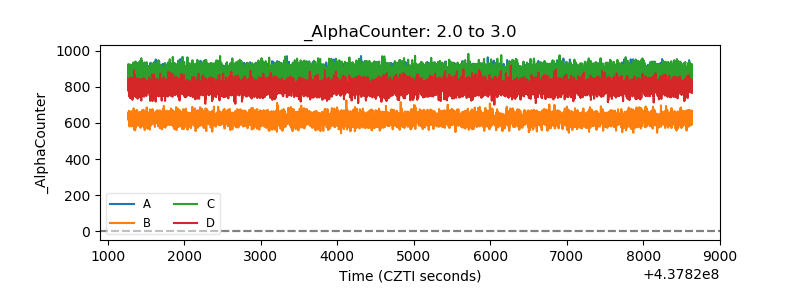 |
| _CPM_Rate | 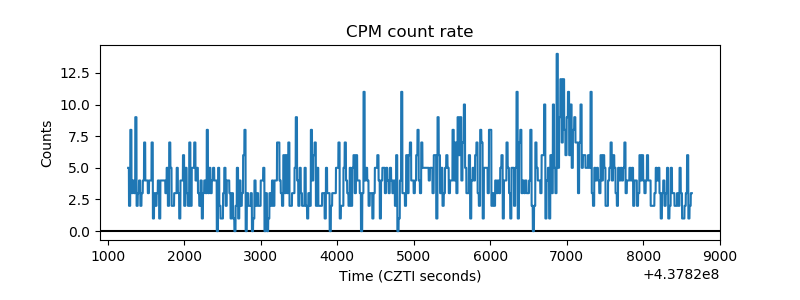 |
| CZT Counter | 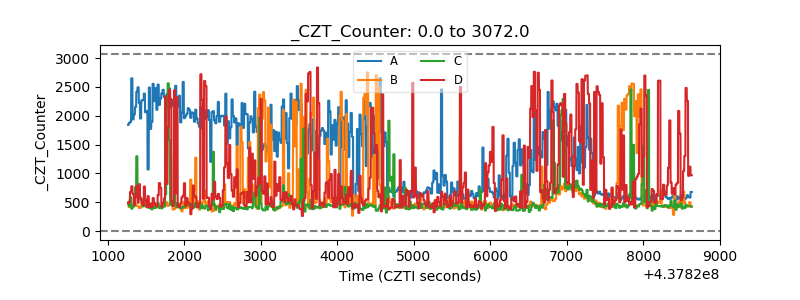 |
| +2.5 Volts monitor | 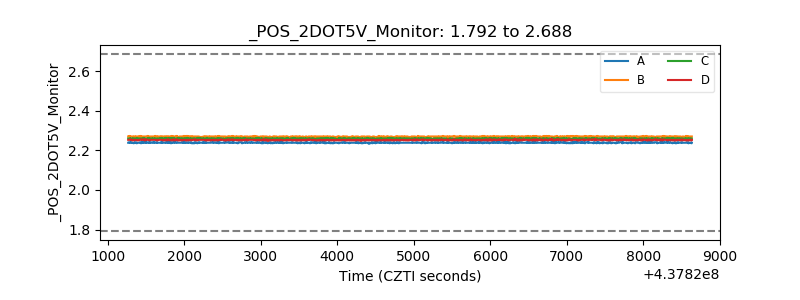 |
| +5 Volts monitor | 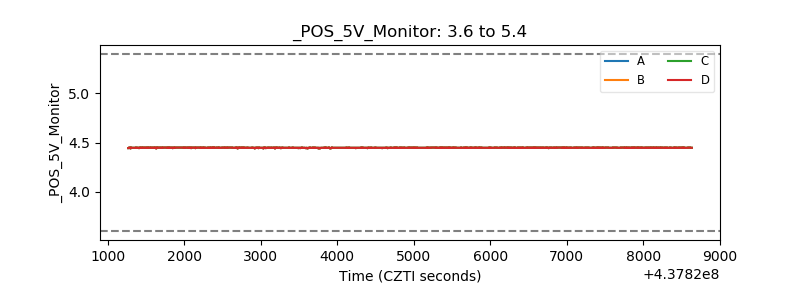 |
| _ROLL_ROT | 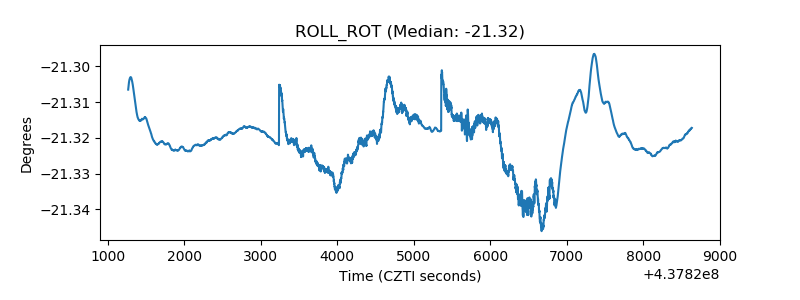 |
| _Roll_DEC | 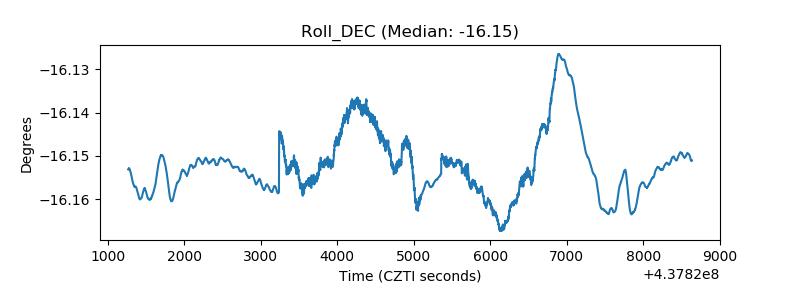 |
| _Roll_RA | 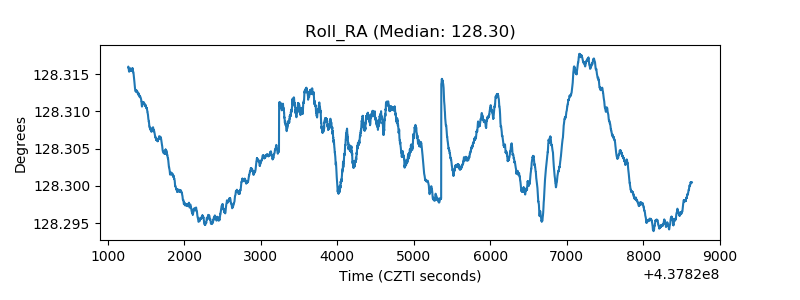 |
| Veto Counter | 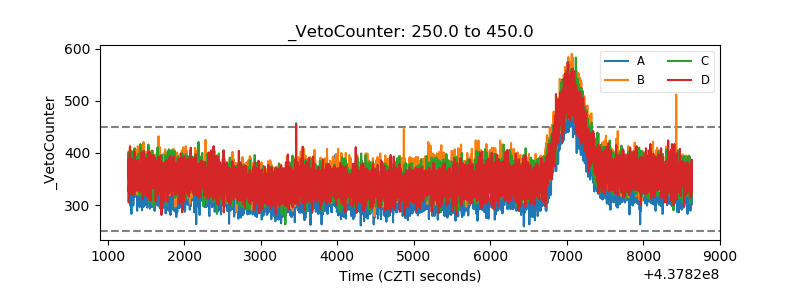 |