| Param | Original file | Final file |
|---|---|---|
| Filename | modeM0/AS1A13_025T02_9000005938_44056cztM0_level2.fits | modeM0/AS1A13_025T02_9000005938_44056cztM0_level2_quad_clean.evt |
| Size (bytes) | 89,233,920 | 13,118,400 |
| Size | 85.1 MB | 12.5 MB |
| Events in quadrant A | 670,854 | 98,961 |
| Events in quadrant B | 422,100 | 107,016 |
| Events in quadrant C | 481,017 | 95,972 |
| Events in quadrant D | 1,658,905 | 28,600 |
| Mode M0 | |||
|---|---|---|---|
| Quadrant | BADHDUFLAG | Total packets | Discarded packets |
| A | 0 | 2644 | 1 |
| B | 0 | 1826 | 1 |
| C | 0 | 2027 | 1 |
| D | 0 | 5513 | 1 |
| Mode M9 | |||
|---|---|---|---|
| Quadrant | BADHDUFLAG | Total packets | Discarded packets |
| A | 0 | 2 | 0 |
| B | 0 | 3 | 0 |
| C | 0 | 3 | 0 |
| D | 0 | 3 | 0 |
| Mode SS | |||
|---|---|---|---|
| Quadrant | BADHDUFLAG | Total packets | Discarded packets |
| A | 0 | 16 | 0 |
| B | 0 | 16 | 0 |
| C | 0 | 16 | 0 |
| D | 0 | 16 | 0 |
| Quadrant | Total seconds | Saturated seconds | Saturation percentage |
|---|---|---|---|
| A | 860 | 39 | 4.534884% |
| B | 860 | 10 | 1.162791% |
| C | 860 | 41 | 4.767442% |
| D | 860 | 625 | 72.674419% |
Noise dominated data is calculated using 1-second bins in cleaned event files. If a bin has >2000 counts, and if more than 50% of those come from <1% of pixels, then it is considered to be noise-dominated and hence unusable.
| Quadrant | # 1 sec bins | Bins with >0 counts | Bins with >2000 counts | High rate bins dominated by noise | Noise dominated (total time) | Noise dominated (detector-on time) | Marked lightcurve |
|---|---|---|---|---|---|---|---|
| A | 860 | 860 | 0 | 0 | 0.00% | 0.00% | 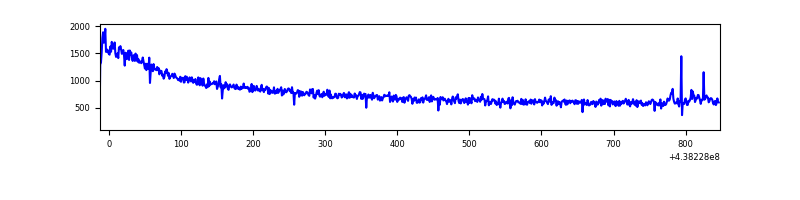 |
| B | 860 | 860 | 0 | 0 | 0.00% | 0.00% | 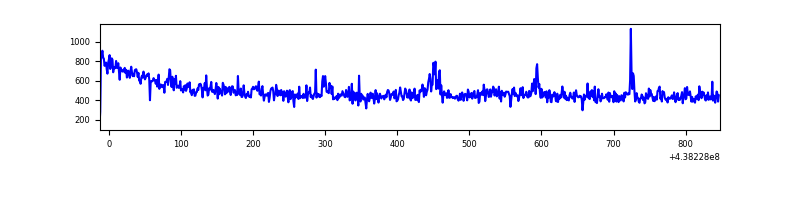 |
| C | 860 | 860 | 16 | 16 | 1.86% | 1.86% | 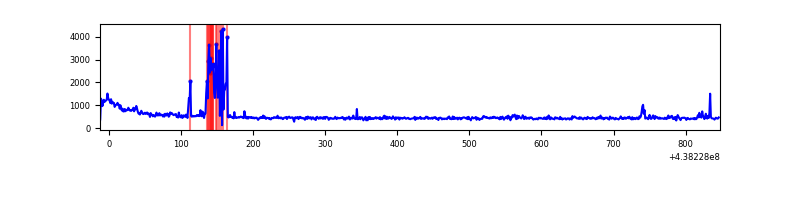 |
| D | 860 | 860 | 447 | 447 | 51.98% | 51.98% | 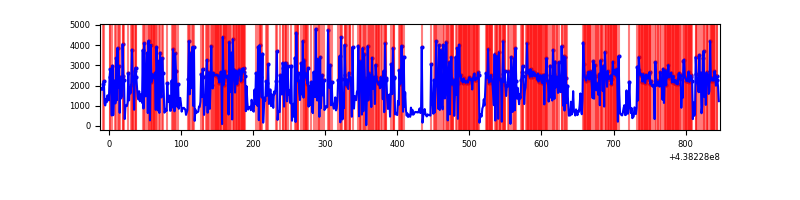 |
Top three noisy pixels from each quadrant. If the there are fewer than three noisy pixels in the level2.evt file, extra rows are filled as -1
| Pixel properties | Quadrant properties | ||||||
|---|---|---|---|---|---|---|---|
| Quadrant | DetID | PixID | Counts | Sigma | Mean | Median | Sigma |
| A | 10 | 83 | 275396 | 12043.61 | 99 | 97 | 22.9 |
| A | 15 | 223 | 6952 | 299.89 | 99 | 97 | 22.9 |
| A | 7 | 3 | 1734 | 71.61 | 99 | 97 | 22.9 |
| B | 0 | 200 | 14366 | 637.94 | 103 | 100 | 22.4 |
| B | 12 | 111 | 2604 | 111.97 | 103 | 100 | 22.4 |
| B | 14 | 111 | 2380 | 101.96 | 103 | 100 | 22.4 |
| C | 14 | 254 | 70875 | 2813.06 | 99 | 99 | 25.2 |
| C | 3 | 233 | 23023 | 911.14 | 99 | 99 | 25.2 |
| C | 13 | 61 | 678 | 23.01 | 99 | 99 | 25.2 |
| D | 1 | 52 | 1434390 | 96434.64 | 51 | 48 | 14.9 |
| D | 5 | 222 | 15692 | 1051.79 | 51 | 48 | 14.9 |
| D | 2 | 249 | 5410 | 360.5 | 51 | 48 | 14.9 |
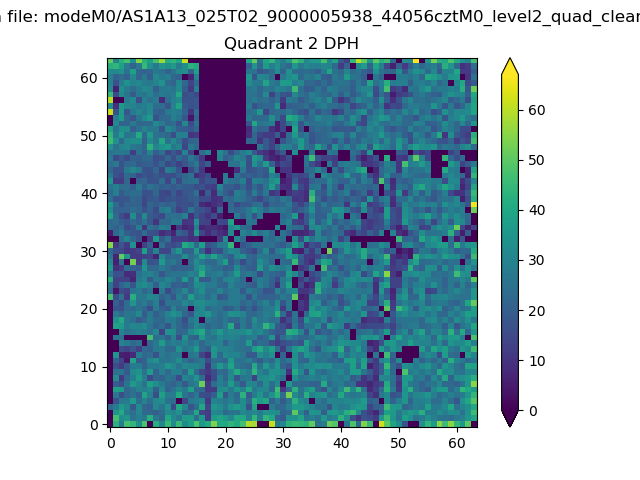
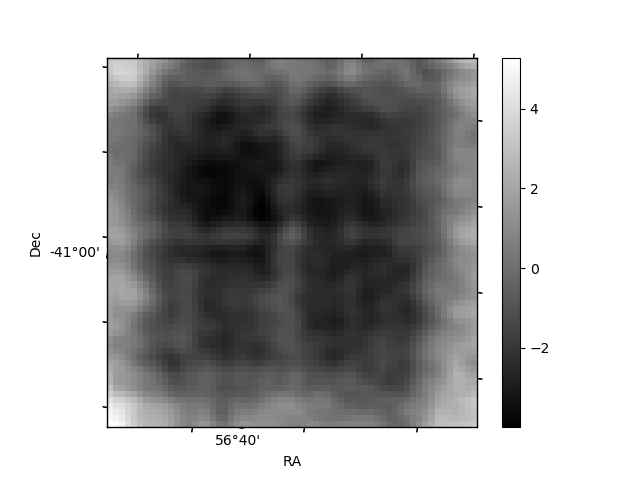
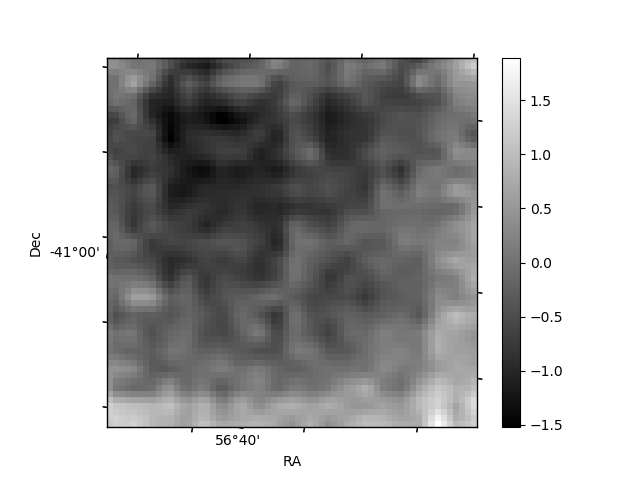
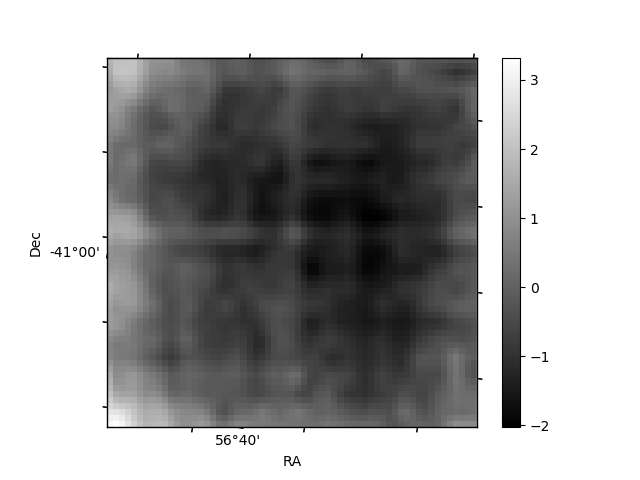
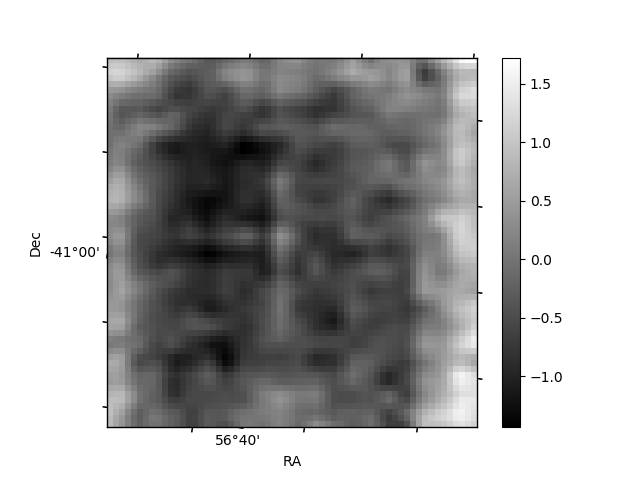
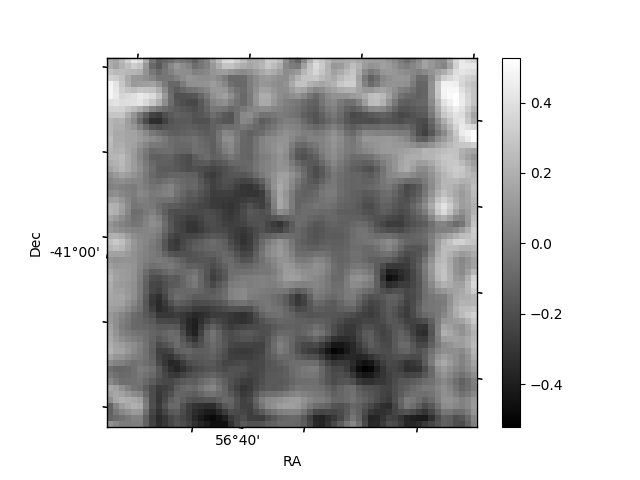
Histogram calculated using DETX and DETY for each event in the final _common_clean file
| Quadrant A | 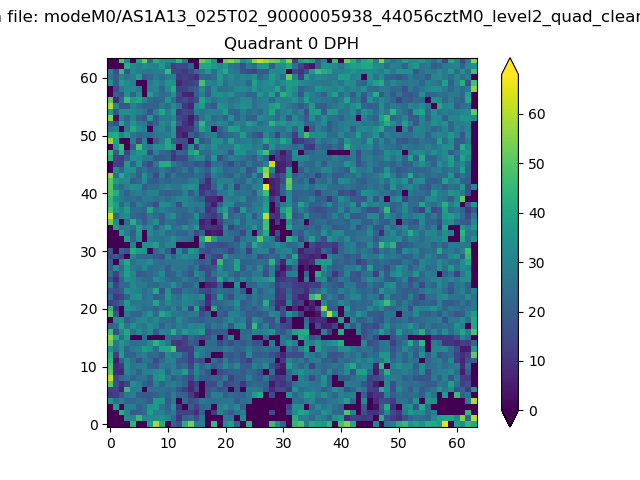 |
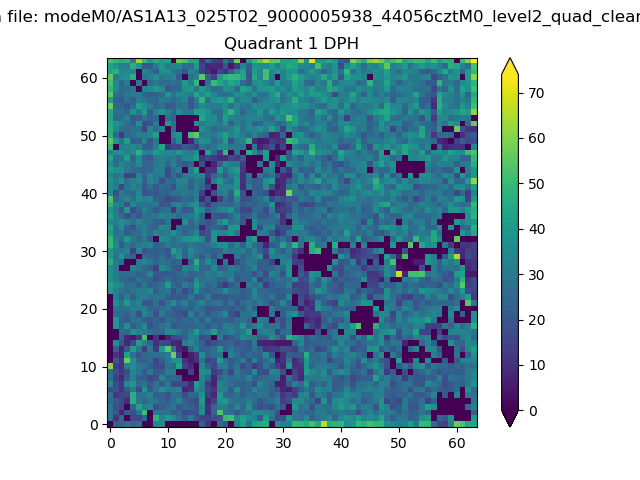 |
Quadrant B |
|---|---|---|---|
| Quadrant D | 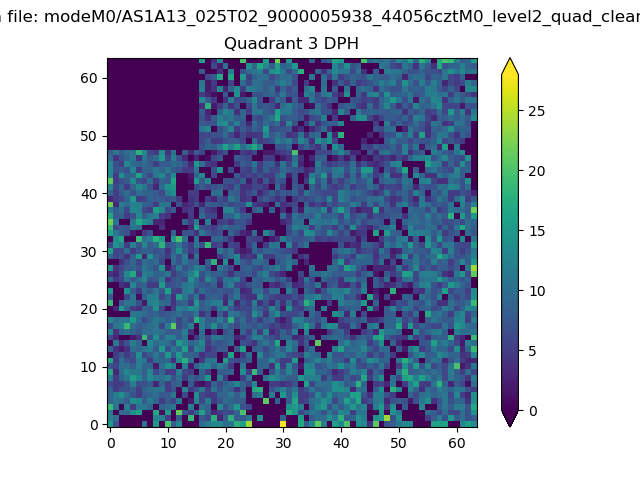 |
 |
Quadrant C |
| Plot type | Count rate plots | Images |
|---|---|---|
| Comparison with Poisson distribution Blue bars denote a histogram of data divided into 1 sec bins. Red curve is a Poisson curve with rate = median count rate of data. |
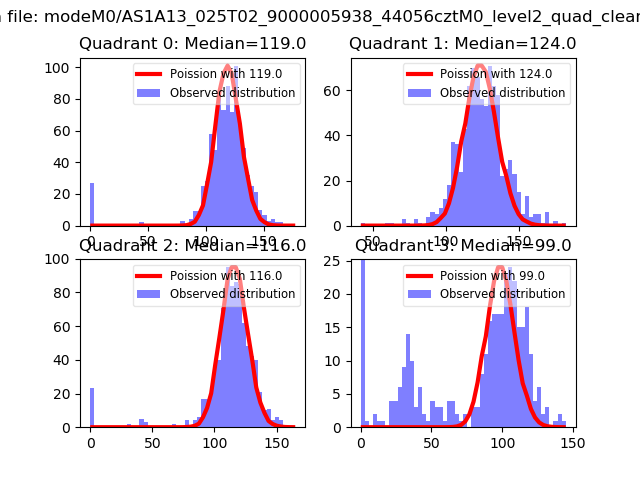 |
 |
| Quadrant-wise count rates Data is divided into 100 sec bins |
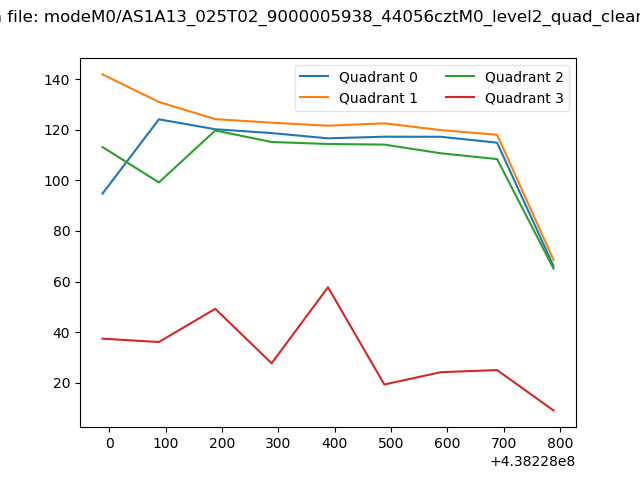 |
|
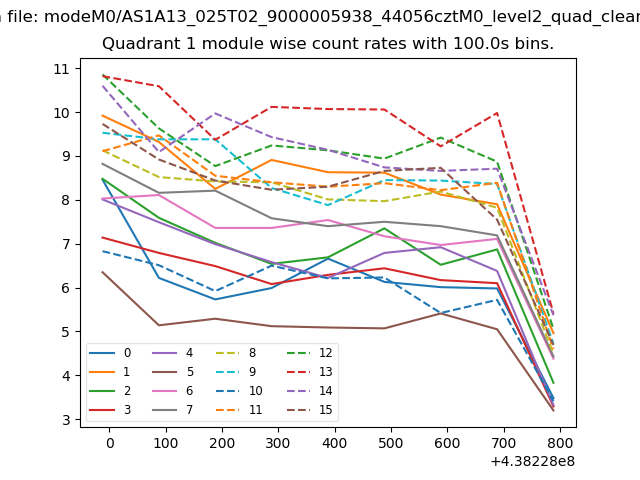
| Module-wise count rates for Quadrant A Data is divided into 100 sec bins |
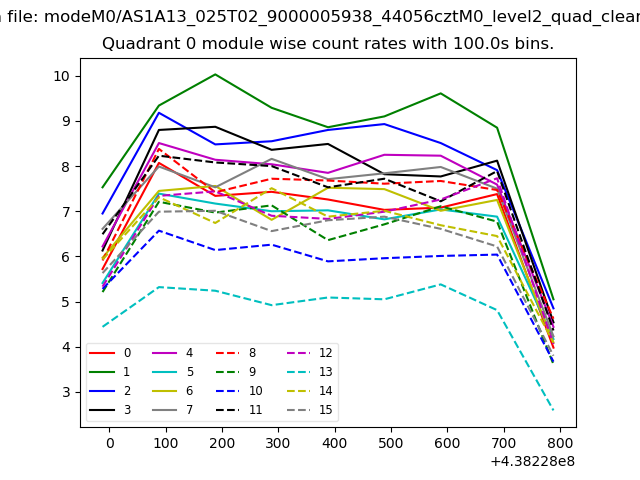 |
 |
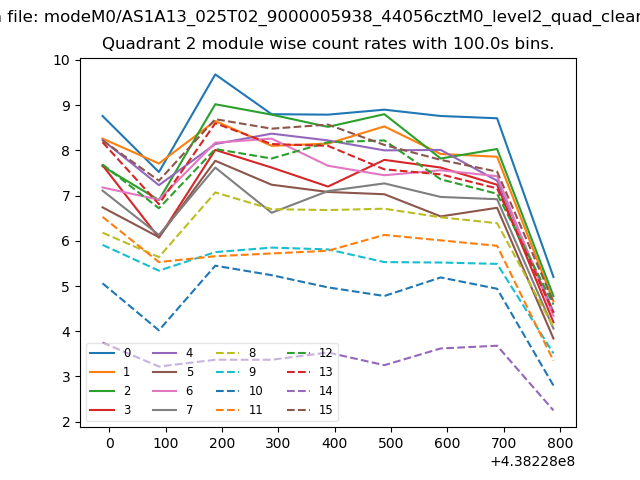
| Module-wise count rates for Quadrant B Data is divided into 100 sec bins |
 |
 |
| Module-wise count rates for Quadrant C Data is divided into 100 sec bins |
 |
 |
| Module-wise count rates for Quadrant D Data is divided into 100 sec bins |
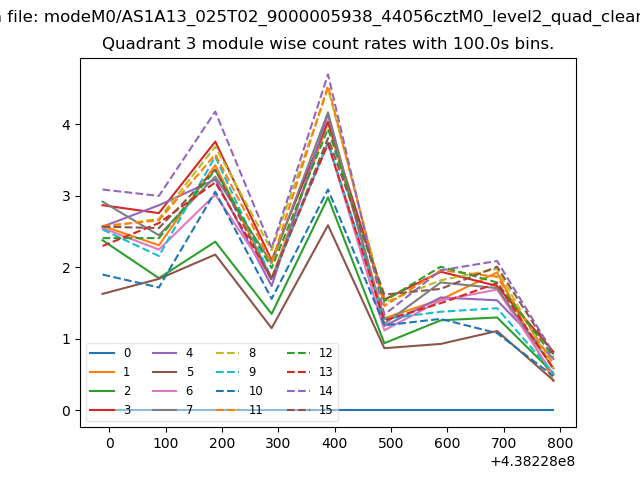 |
 |
| Parameter | Plot |
|---|---|
| CZT HV Monitor |  |
| D_VDD | 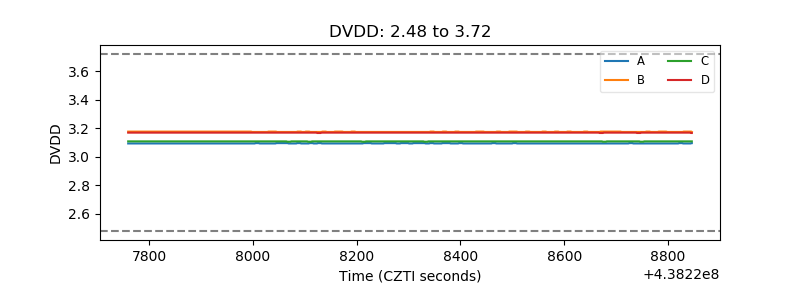 |
| Temperature 1 | 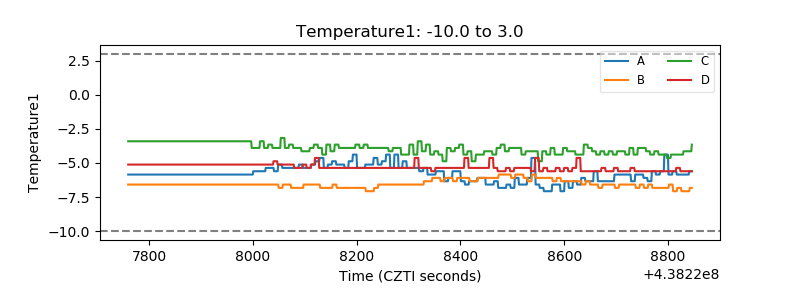 |
| Veto HV Monitor | 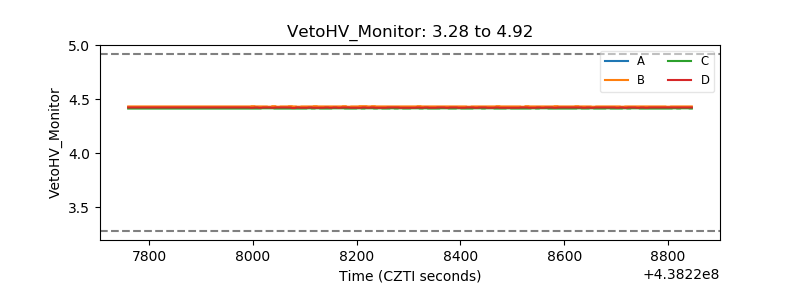 |
| Veto LLD | 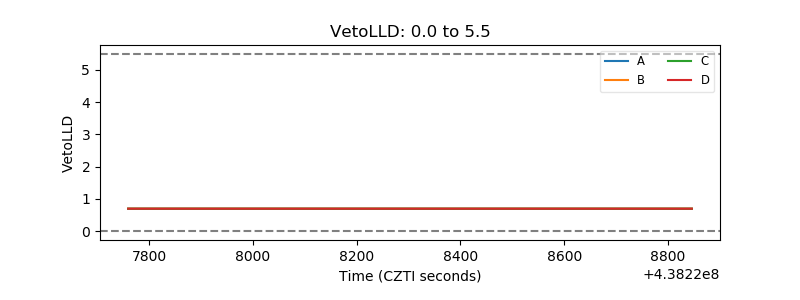 |
| Alpha Counter | 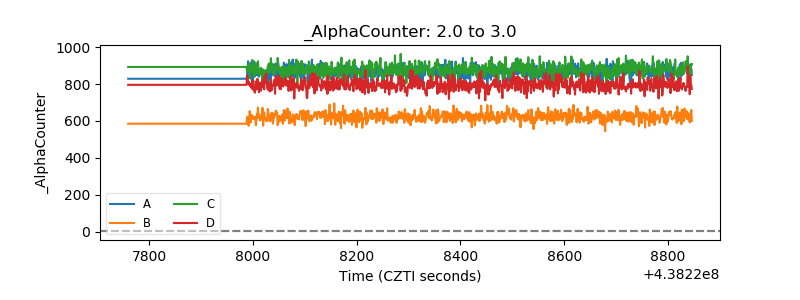 |
| _CPM_Rate | 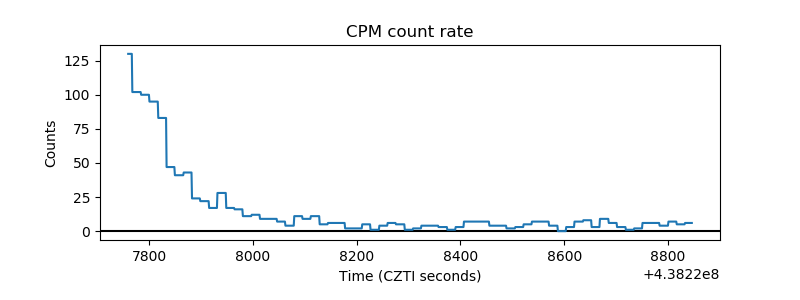 |
| CZT Counter | 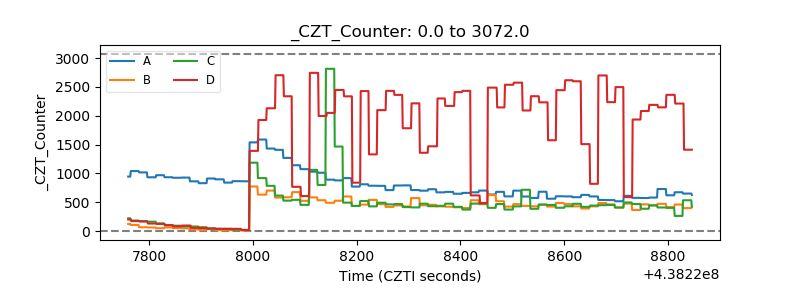 |
| +2.5 Volts monitor | 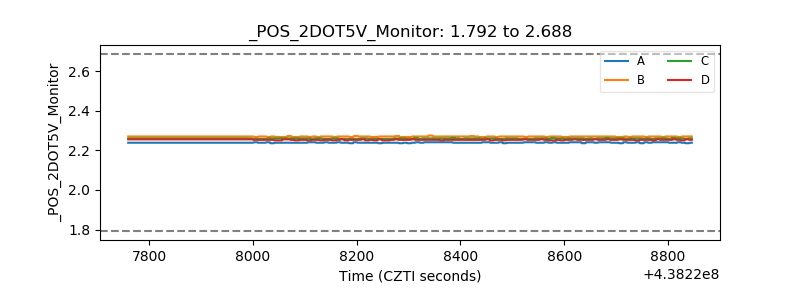 |
| +5 Volts monitor | 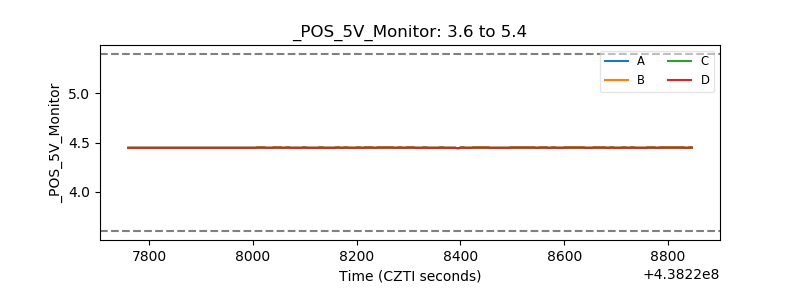 |
| _ROLL_ROT | 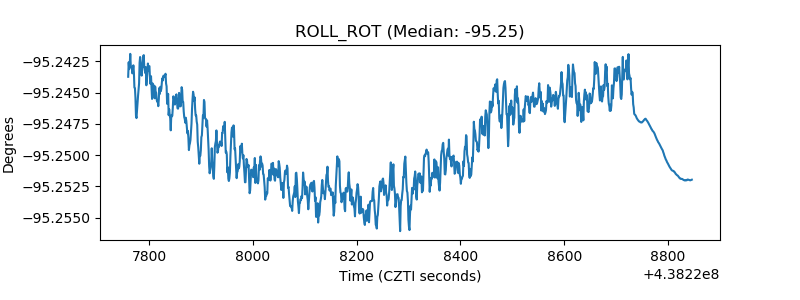 |
| _Roll_DEC | 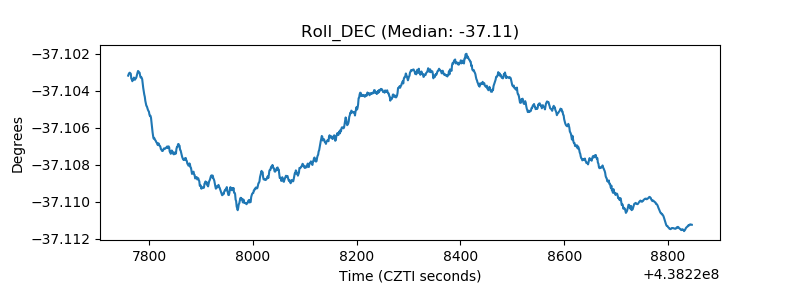 |
| _Roll_RA | 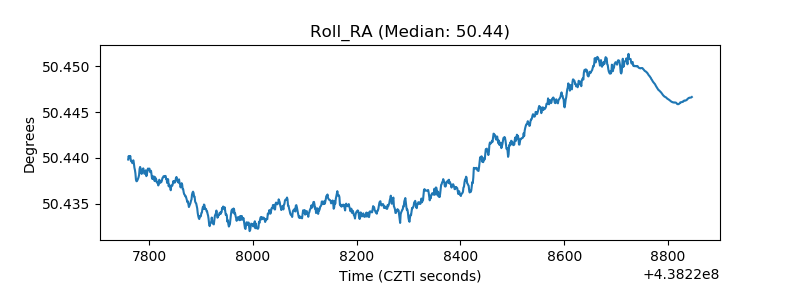 |
| Veto Counter | 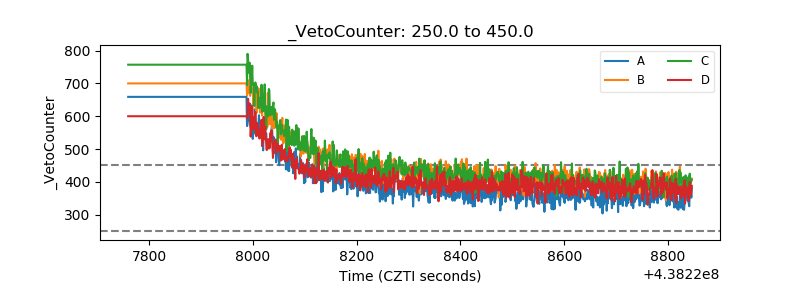 |