| Param | Original file | Final file |
|---|---|---|
| Filename | modeM0/AS1A13_029T01_9000005940_44059cztM0_level2.fits | modeM0/AS1A13_029T01_9000005940_44059cztM0_level2_quad_clean.evt |
| Size (bytes) | 495,576,000 | 123,390,720 |
| Size | 472.6 MB | 117.7 MB |
| Events in quadrant A | 4,504,577 | 825,299 |
| Events in quadrant B | 3,486,333 | 857,347 |
| Events in quadrant C | 4,734,562 | 787,772 |
| Events in quadrant D | 5,026,578 | 735,120 |
| Mode SS | |||
|---|---|---|---|
| Quadrant | BADHDUFLAG | Total packets | Discarded packets |
| A | 0 | 152 | 0 |
| B | 0 | 152 | 0 |
| C | 0 | 152 | 0 |
| D | 0 | 152 | 0 |
| Mode M0 | |||
|---|---|---|---|
| Quadrant | BADHDUFLAG | Total packets | Discarded packets |
| A | 0 | 17825 | 0 |
| B | 0 | 15784 | 0 |
| C | 0 | 19420 | 3 |
| D | 0 | 20173 | 0 |
| Quadrant | Total seconds | Saturated seconds | Saturation percentage |
|---|---|---|---|
| A | 7629 | 34 | 0.445668% |
| B | 7630 | 72 | 0.943644% |
| C | 7629 | 292 | 3.827500% |
| D | 7629 | 142 | 1.861319% |
Noise dominated data is calculated using 1-second bins in cleaned event files. If a bin has >2000 counts, and if more than 50% of those come from <1% of pixels, then it is considered to be noise-dominated and hence unusable.
| Quadrant | # 1 sec bins | Bins with >0 counts | Bins with >2000 counts | High rate bins dominated by noise | Noise dominated (total time) | Noise dominated (detector-on time) | Marked lightcurve |
|---|---|---|---|---|---|---|---|
| A | 7629 | 7629 | 0 | 0 | 0.00% | 0.00% | 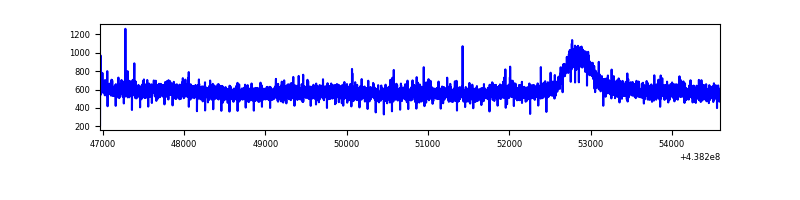 |
| B | 7630 | 7630 | 1 | 1 | 0.01% | 0.01% | 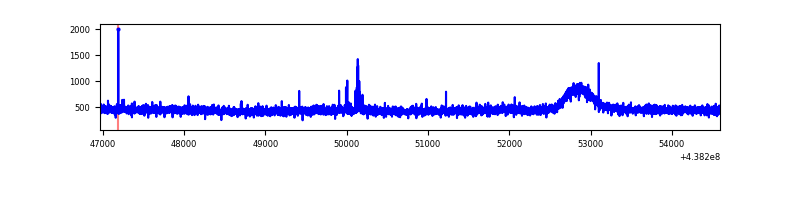 |
| C | 7629 | 7629 | 182 | 182 | 2.39% | 2.39% | 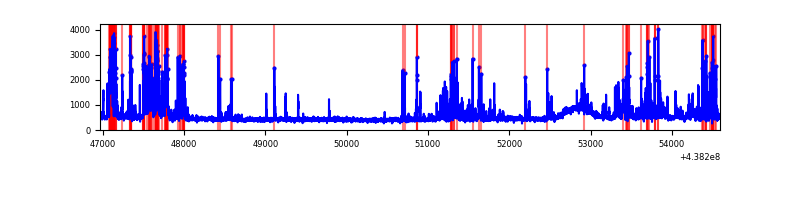 |
| D | 7629 | 7629 | 131 | 131 | 1.72% | 1.72% | 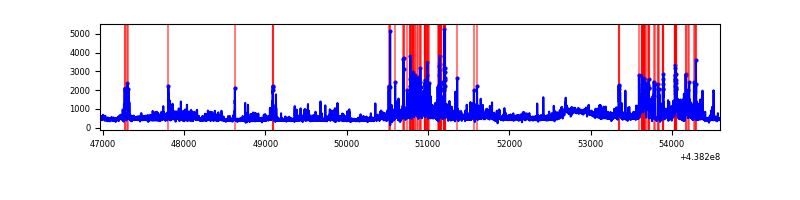 |
Top three noisy pixels from each quadrant. If the there are fewer than three noisy pixels in the level2.evt file, extra rows are filled as -1
| Pixel properties | Quadrant properties | ||||||
|---|---|---|---|---|---|---|---|
| Quadrant | DetID | PixID | Counts | Sigma | Mean | Median | Sigma |
| A | 10 | 83 | 1097361 | 5964.54 | 879 | 863 | 183.8 |
| A | 7 | 3 | 11656 | 58.71 | 879 | 863 | 183.8 |
| A | 3 | 137 | 10526 | 52.56 | 879 | 863 | 183.8 |
| B | 12 | 111 | 23061 | 126.73 | 877 | 850 | 175.3 |
| B | 11 | 111 | 21287 | 116.61 | 877 | 850 | 175.3 |
| B | 14 | 111 | 21254 | 116.42 | 877 | 850 | 175.3 |
| C | 14 | 254 | 769168 | 3754.59 | 860 | 865 | 204.6 |
| C | 1 | 241 | 273567 | 1332.66 | 860 | 865 | 204.6 |
| C | 15 | 208 | 173298 | 842.66 | 860 | 865 | 204.6 |
| D | 5 | 222 | 801932 | 3657.68 | 862 | 836 | 219.0 |
| D | 1 | 52 | 507004 | 2311.08 | 862 | 836 | 219.0 |
| D | 2 | 249 | 298554 | 1359.33 | 862 | 836 | 219.0 |
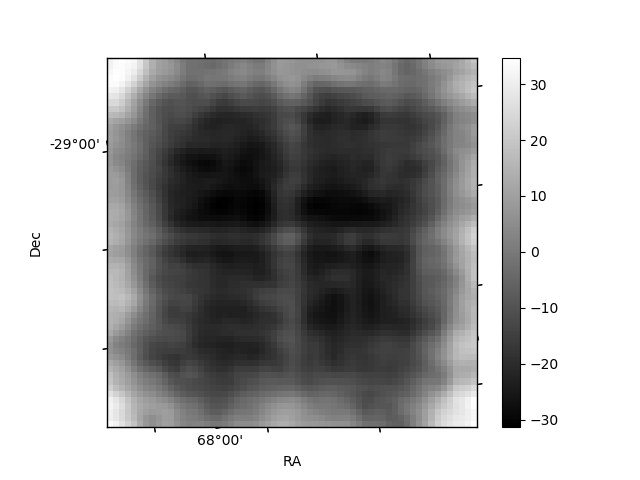
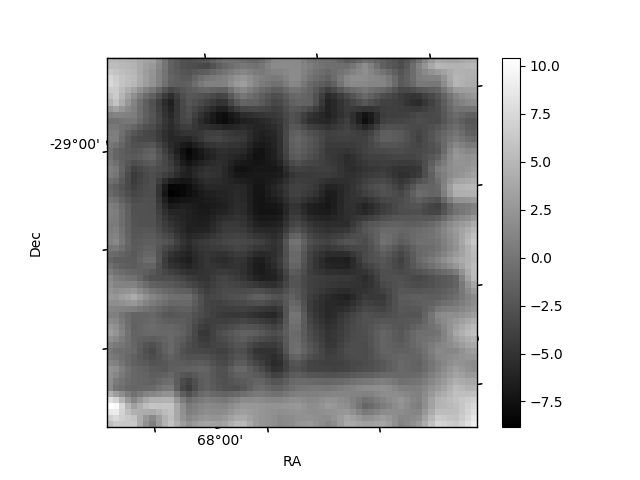
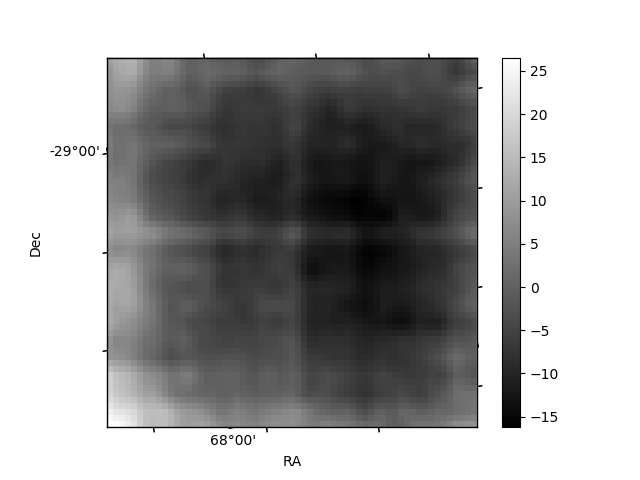
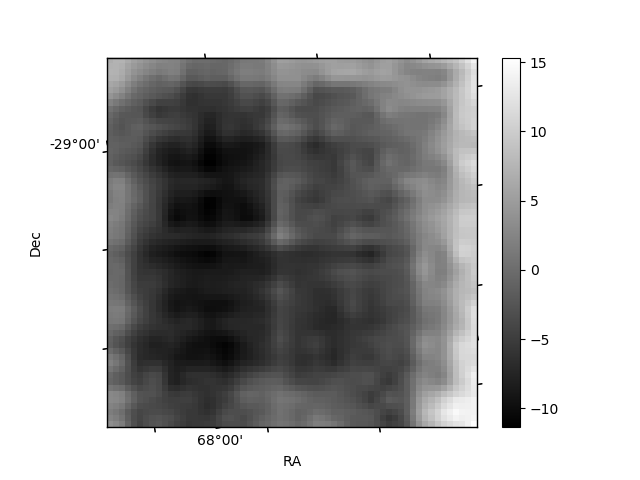
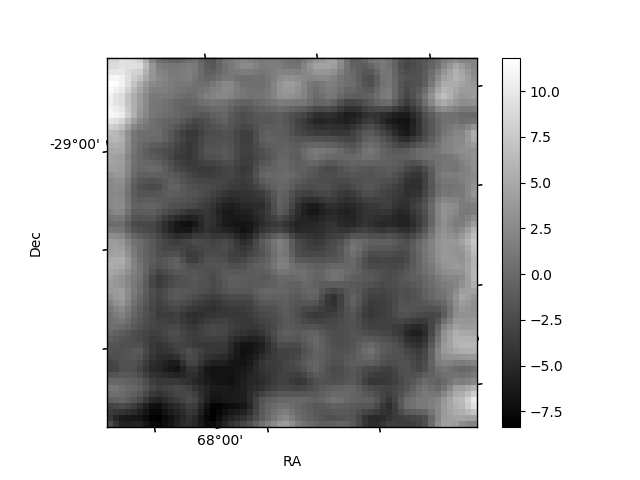
Histogram calculated using DETX and DETY for each event in the final _common_clean file
| Quadrant A | 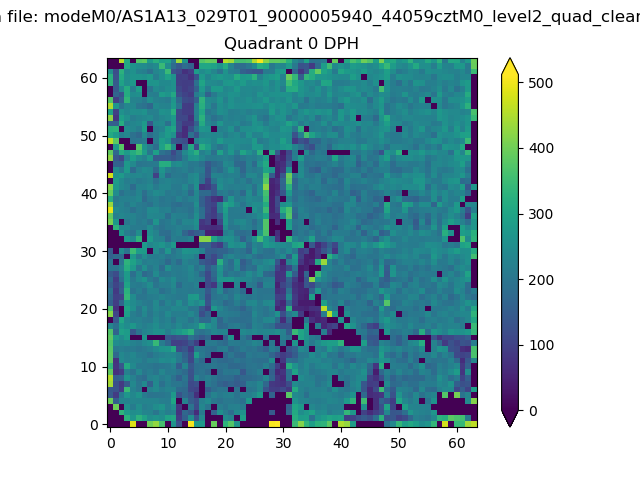 |
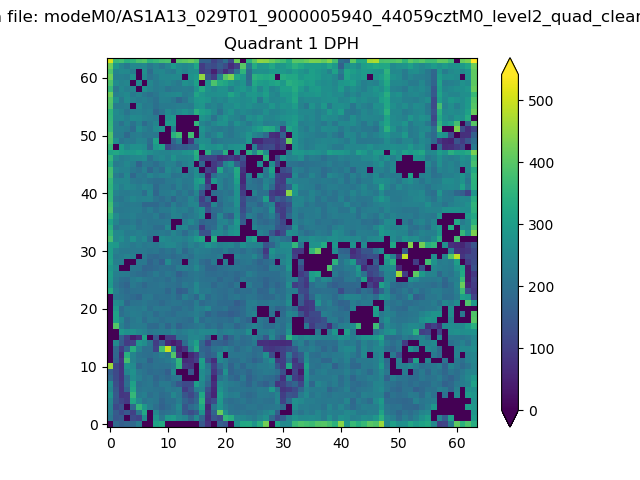 |
Quadrant B |
|---|---|---|---|
| Quadrant D | 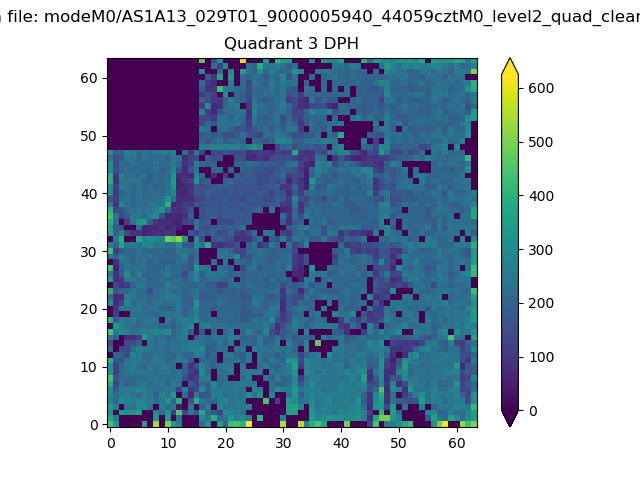 |
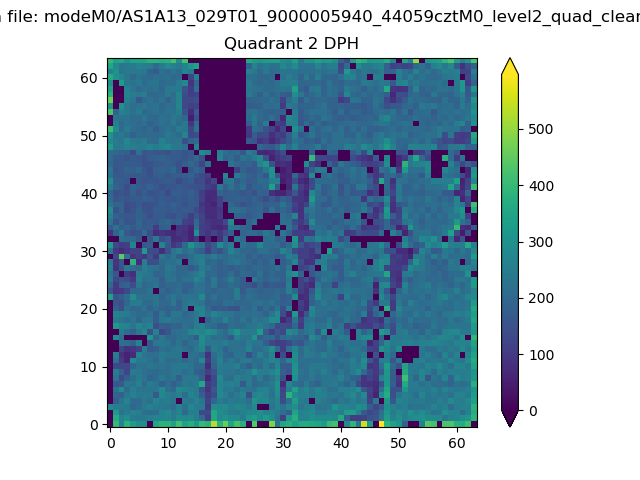 |
Quadrant C |
| Plot type | Count rate plots | Images |
|---|---|---|
| Comparison with Poisson distribution Blue bars denote a histogram of data divided into 1 sec bins. Red curve is a Poisson curve with rate = median count rate of data. |
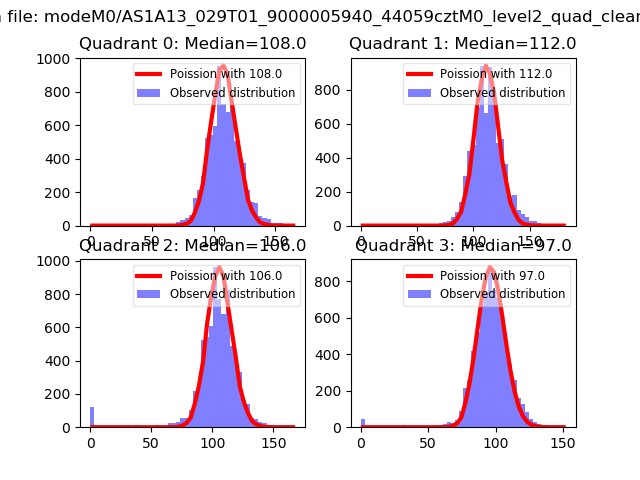 |
 |
| Quadrant-wise count rates Data is divided into 100 sec bins |
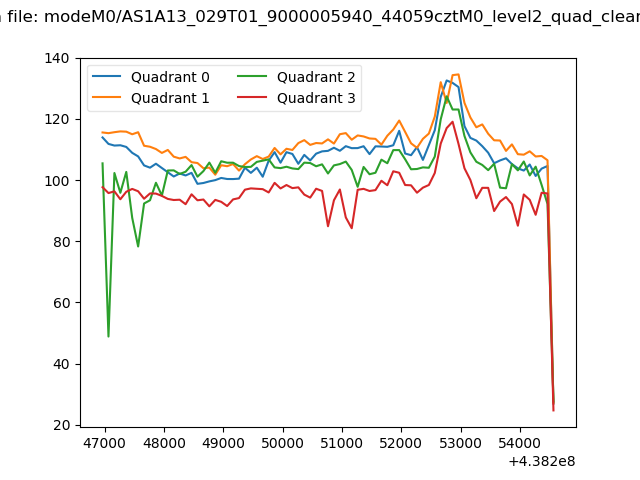 |
|
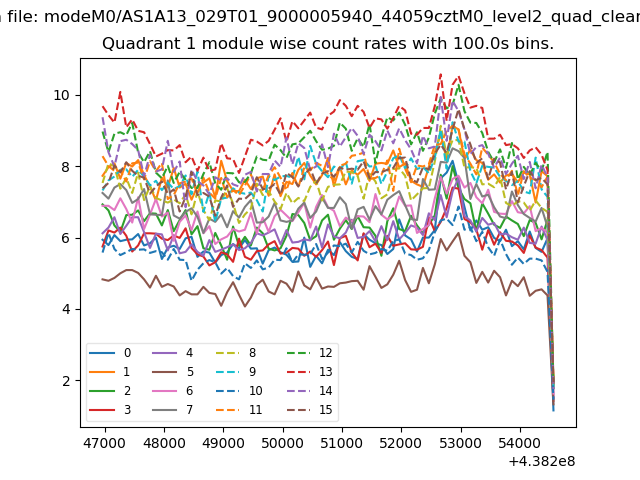
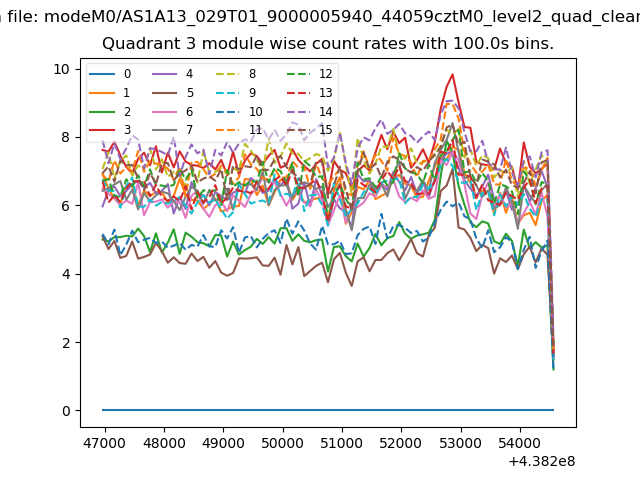
| Module-wise count rates for Quadrant A Data is divided into 100 sec bins |
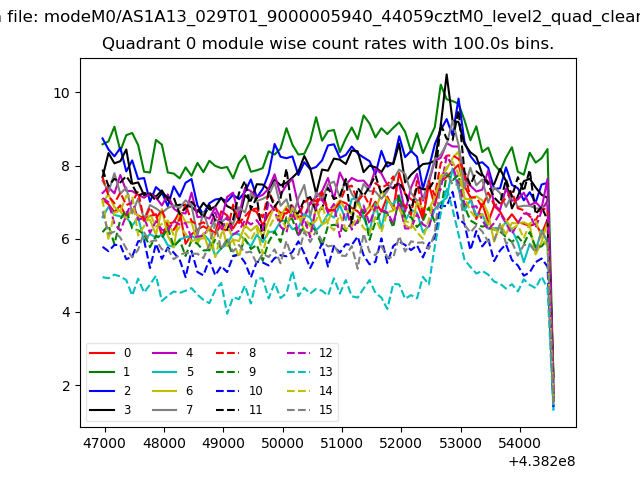 |
 |
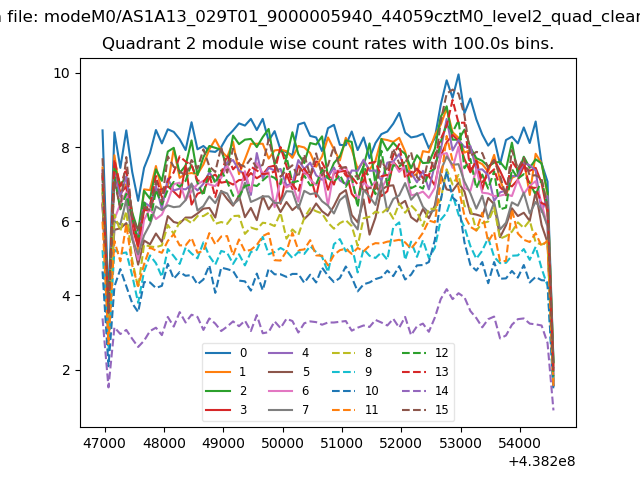
| Module-wise count rates for Quadrant B Data is divided into 100 sec bins |
 |
 |
| Module-wise count rates for Quadrant C Data is divided into 100 sec bins |
 |
 |
| Module-wise count rates for Quadrant D Data is divided into 100 sec bins |
 |
 |
| Parameter | Plot |
|---|---|
| CZT HV Monitor |  |
| D_VDD | 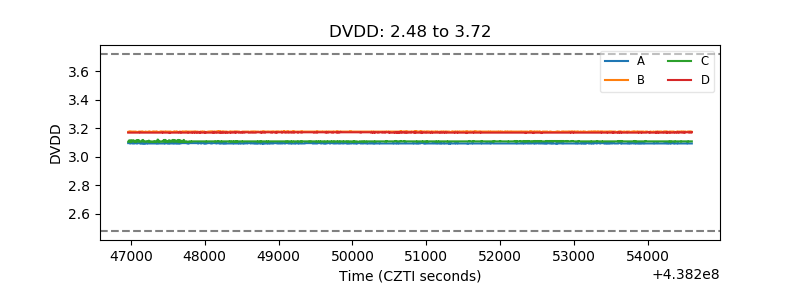 |
| Temperature 1 | 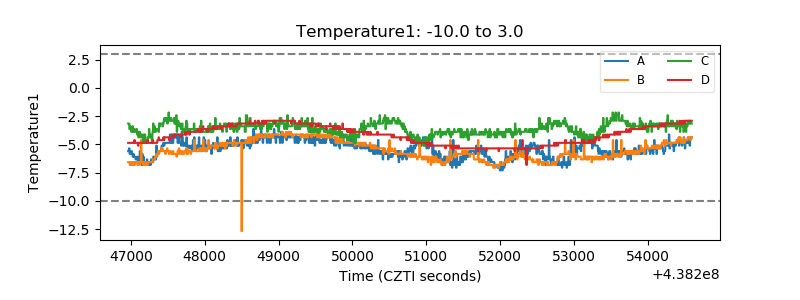 |
| Veto HV Monitor | 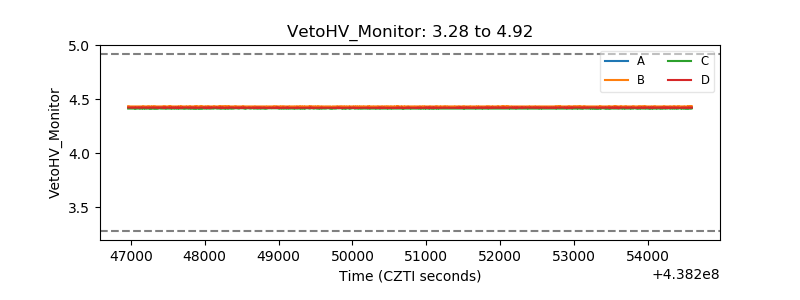 |
| Veto LLD | 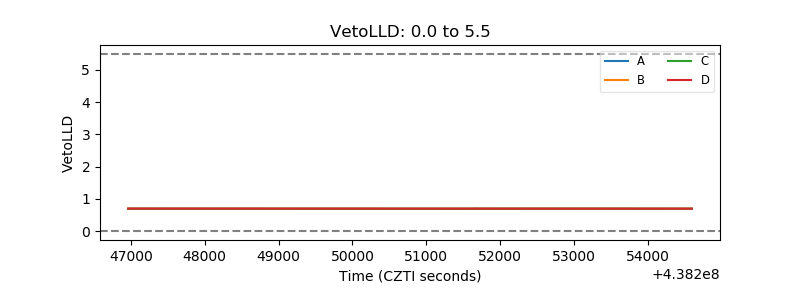 |
| Alpha Counter | 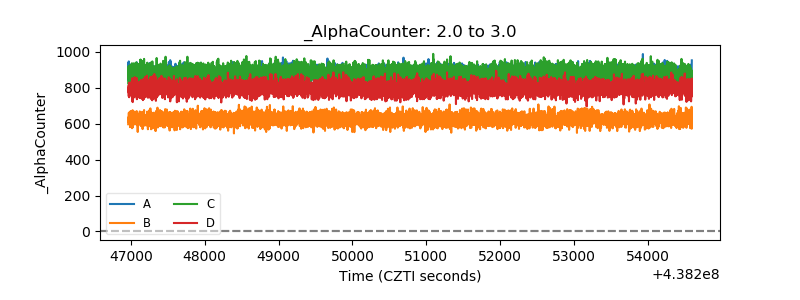 |
| _CPM_Rate | 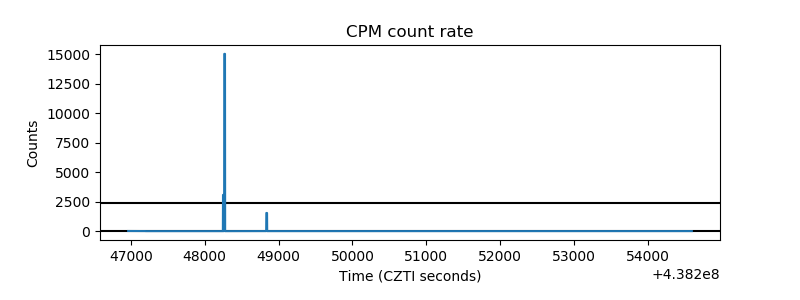 |
| CZT Counter | 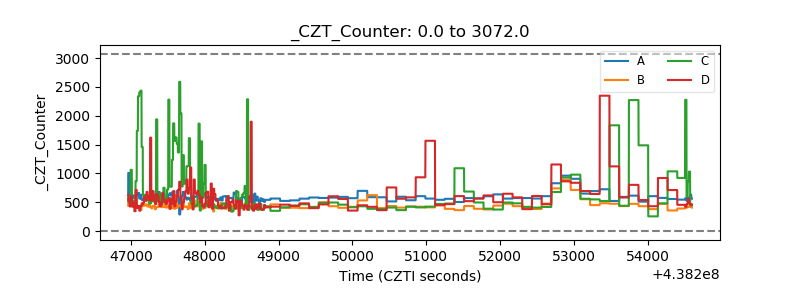 |
| +2.5 Volts monitor | 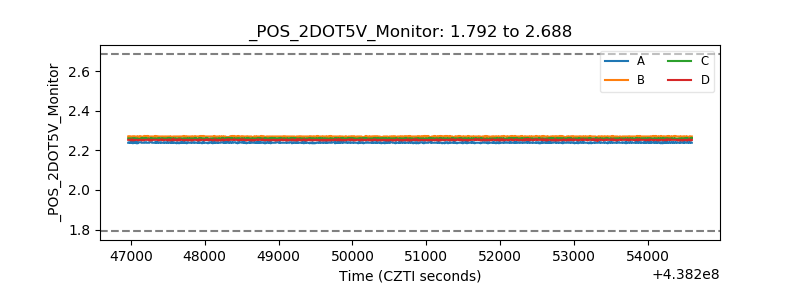 |
| +5 Volts monitor | 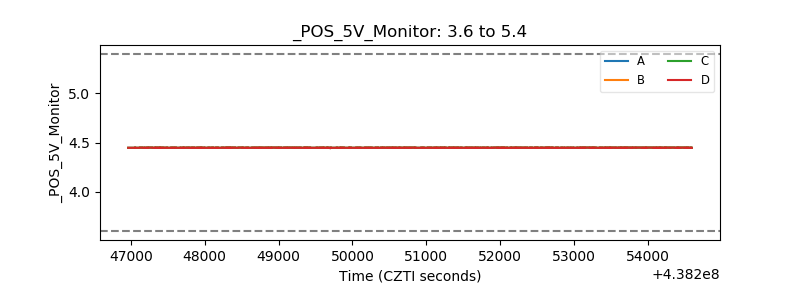 |
| _ROLL_ROT | 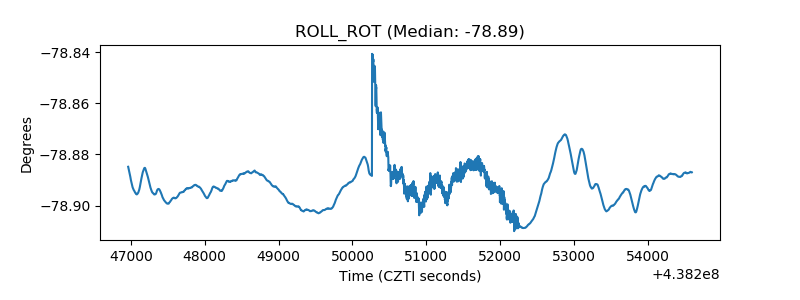 |
| _Roll_DEC | 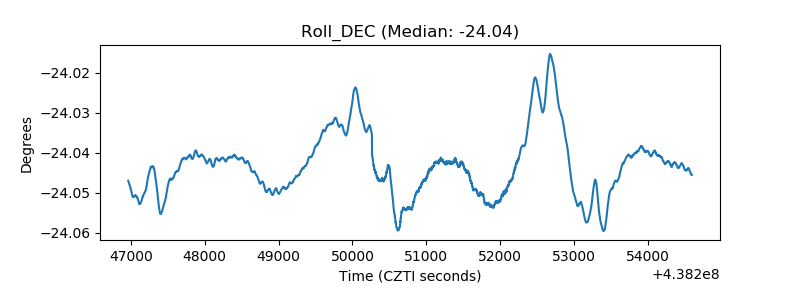 |
| _Roll_RA | 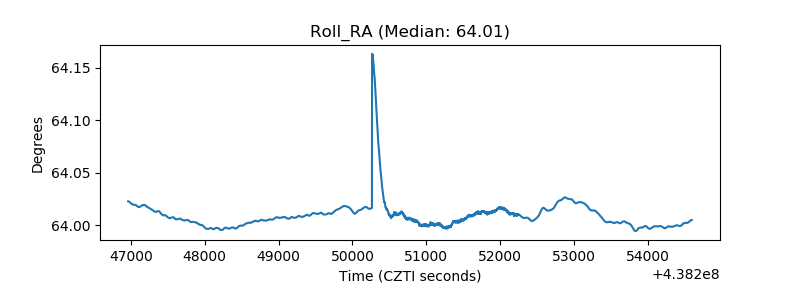 |
| Veto Counter | 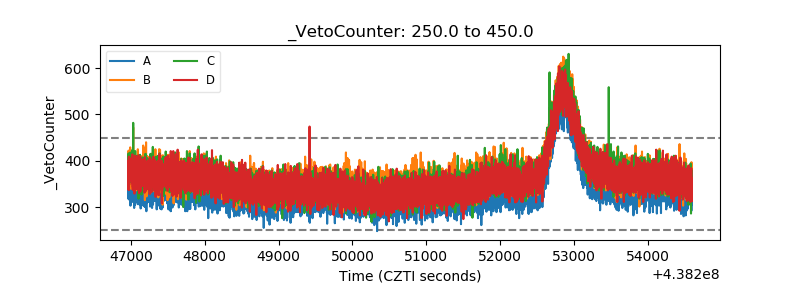 |