| Param | Original file | Final file |
|---|---|---|
| Filename | modeM0/AS1A13_047T01_9000005970_44207cztM0_level2.fits | modeM0/AS1A13_047T01_9000005970_44207cztM0_level2_quad_clean.evt |
| Size (bytes) | 119,609,280 | 24,580,800 |
| Size | 114.1 MB | 23.4 MB |
| Events in quadrant A | 1,702,057 | 153,204 |
| Events in quadrant B | 830,924 | 170,396 |
| Events in quadrant C | 767,389 | 162,794 |
| Events in quadrant D | 1,006,000 | 145,281 |
| Mode SS | |||
|---|---|---|---|
| Quadrant | BADHDUFLAG | Total packets | Discarded packets |
| A | 0 | 30 | 0 |
| B | 0 | 30 | 0 |
| C | 0 | 30 | 0 |
| D | 0 | 30 | 0 |
| Mode M0 | |||
|---|---|---|---|
| Quadrant | BADHDUFLAG | Total packets | Discarded packets |
| A | 0 | 6165 | 0 |
| B | 0 | 3399 | 0 |
| C | 0 | 3276 | 0 |
| D | 0 | 3948 | 0 |
| Quadrant | Total seconds | Saturated seconds | Saturation percentage |
|---|---|---|---|
| A | 1525 | 156 | 10.229508% |
| B | 1525 | 6 | 0.393443% |
| C | 1525 | 2 | 0.131148% |
| D | 1525 | 63 | 4.131148% |
Noise dominated data is calculated using 1-second bins in cleaned event files. If a bin has >2000 counts, and if more than 50% of those come from <1% of pixels, then it is considered to be noise-dominated and hence unusable.
| Quadrant | # 1 sec bins | Bins with >0 counts | Bins with >2000 counts | High rate bins dominated by noise | Noise dominated (total time) | Noise dominated (detector-on time) | Marked lightcurve |
|---|---|---|---|---|---|---|---|
| A | 1525 | 1525 | 86 | 86 | 5.64% | 5.64% | 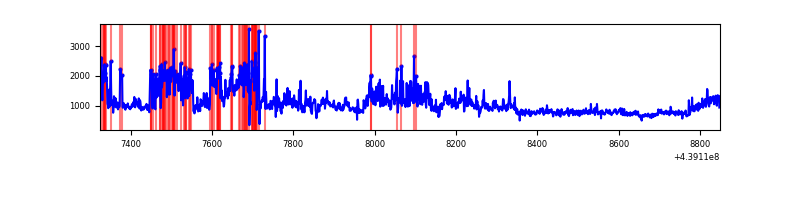 |
| B | 1525 | 1525 | 2 | 2 | 0.13% | 0.13% | 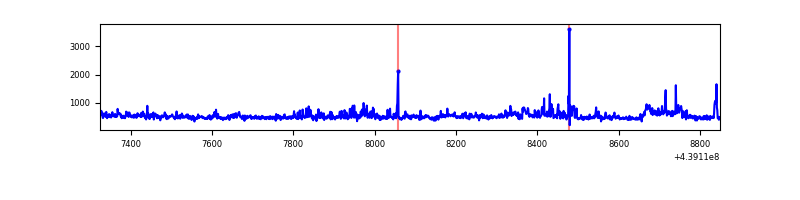 |
| C | 1525 | 1525 | 0 | 0 | 0.00% | 0.00% | 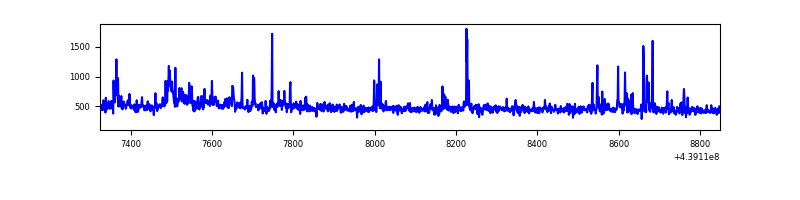 |
| D | 1525 | 1525 | 37 | 37 | 2.43% | 2.43% | 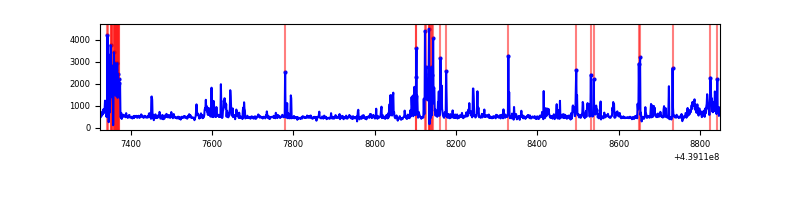 |
Top three noisy pixels from each quadrant. If the there are fewer than three noisy pixels in the level2.evt file, extra rows are filled as -1
| Pixel properties | Quadrant properties | ||||||
|---|---|---|---|---|---|---|---|
| Quadrant | DetID | PixID | Counts | Sigma | Mean | Median | Sigma |
| A | 15 | 223 | 712011 | 18942.04 | 171 | 167 | 37.6 |
| A | 10 | 83 | 323490 | 8603.57 | 171 | 167 | 37.6 |
| A | 0 | 243 | 4110 | 104.92 | 171 | 167 | 37.6 |
| B | 0 | 200 | 67880 | 1868.26 | 175 | 169 | 36.2 |
| B | 4 | 171 | 28969 | 794.64 | 175 | 169 | 36.2 |
| B | 0 | 190 | 9863 | 267.47 | 175 | 169 | 36.2 |
| C | 4 | 254 | 28367 | 647.87 | 176 | 176 | 43.5 |
| C | 14 | 204 | 23831 | 543.63 | 176 | 176 | 43.5 |
| C | 14 | 254 | 22817 | 520.32 | 176 | 176 | 43.5 |
| D | 12 | 16 | 104683 | 2308.64 | 173 | 166 | 45.3 |
| D | 2 | 249 | 83563 | 1842.12 | 173 | 166 | 45.3 |
| D | 1 | 52 | 79124 | 1744.07 | 173 | 166 | 45.3 |
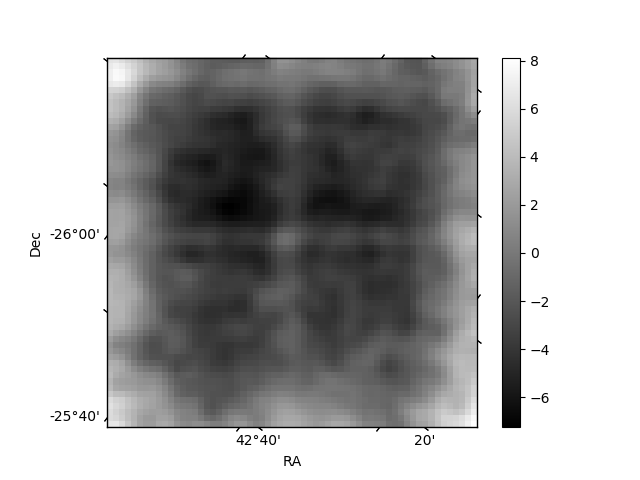
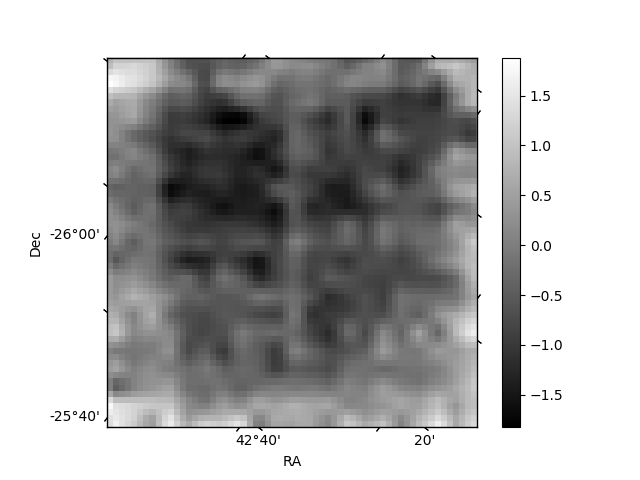
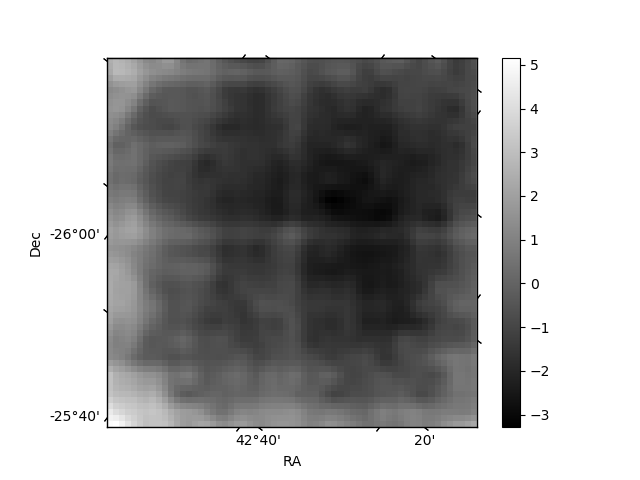
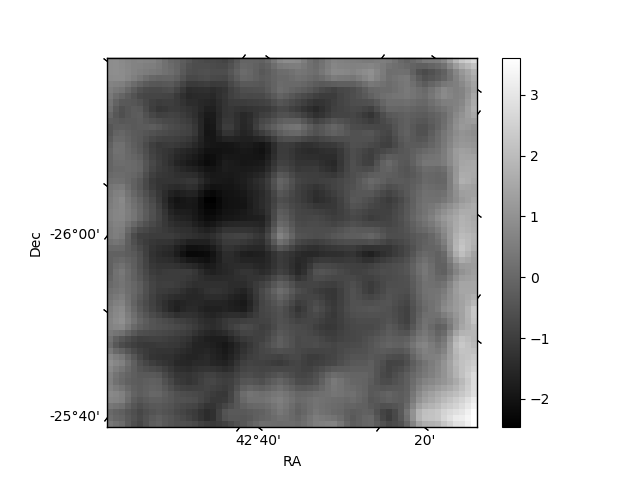
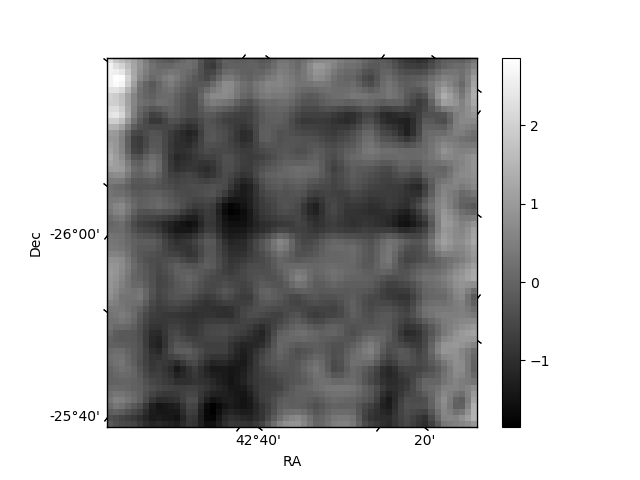
Histogram calculated using DETX and DETY for each event in the final _common_clean file
| Quadrant A | 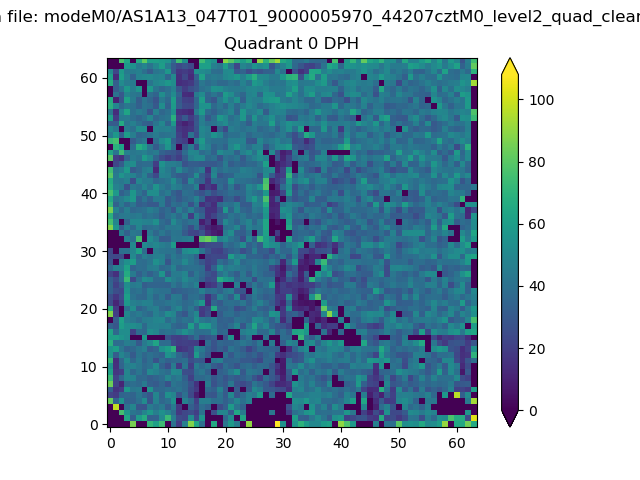 |
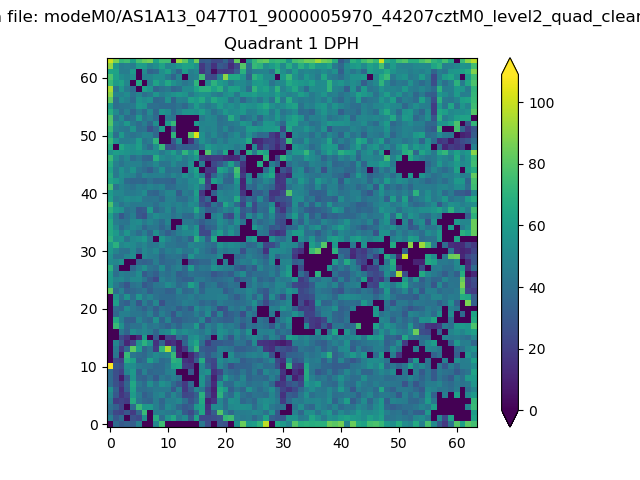 |
Quadrant B |
|---|---|---|---|
| Quadrant D | 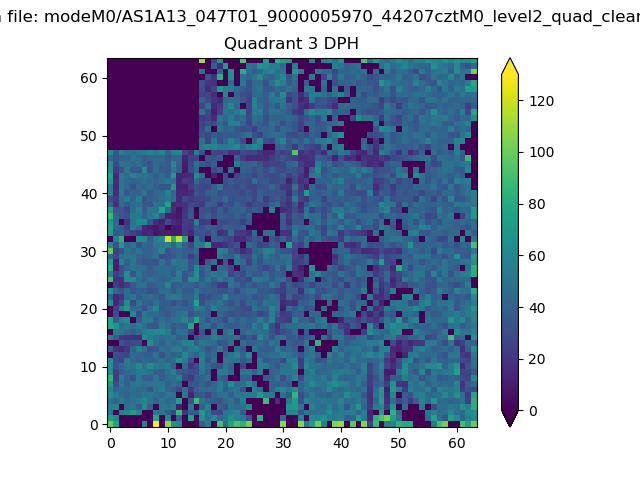 |
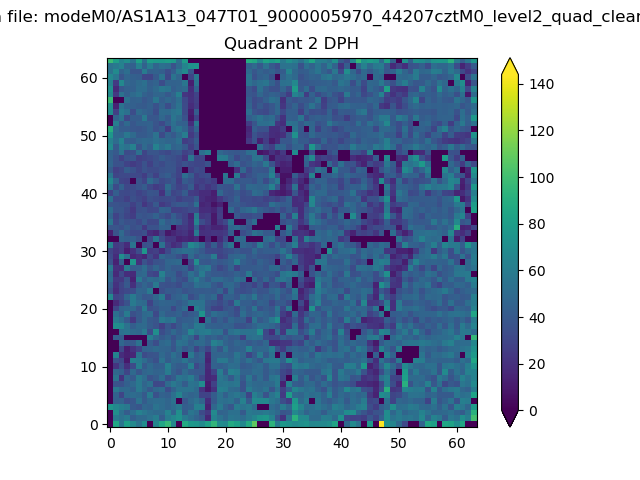 |
Quadrant C |
| Plot type | Count rate plots | Images |
|---|---|---|
| Comparison with Poisson distribution Blue bars denote a histogram of data divided into 1 sec bins. Red curve is a Poisson curve with rate = median count rate of data. |
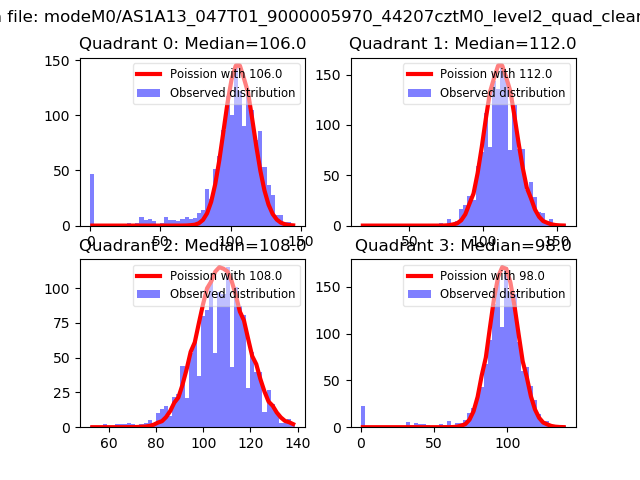 |
 |
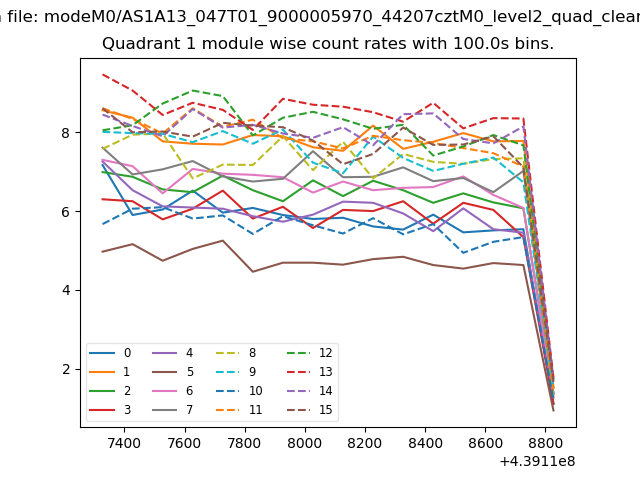
| Quadrant-wise count rates Data is divided into 100 sec bins |
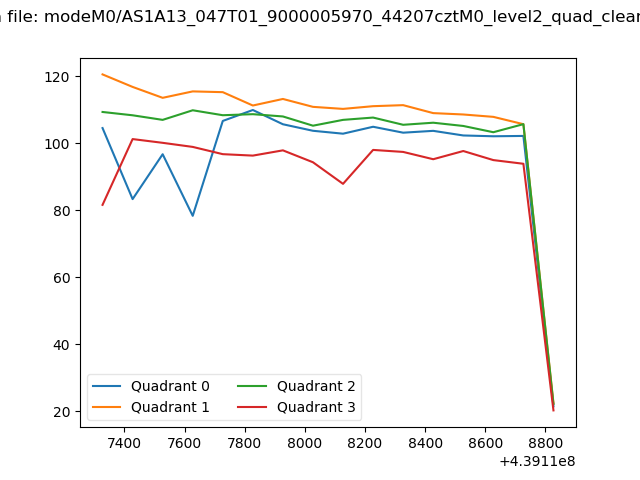 |
|
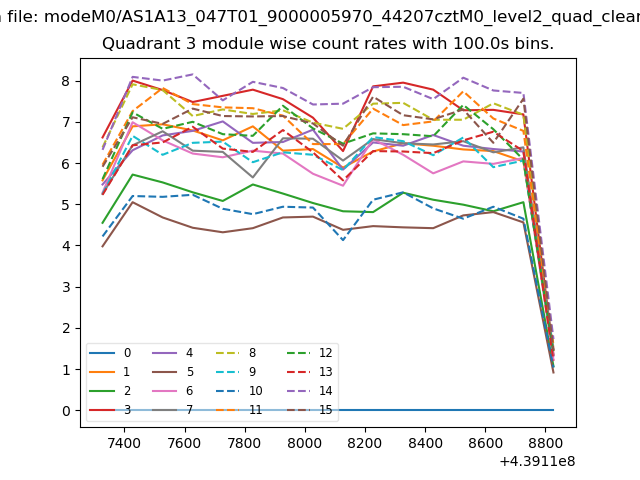
| Module-wise count rates for Quadrant A Data is divided into 100 sec bins |
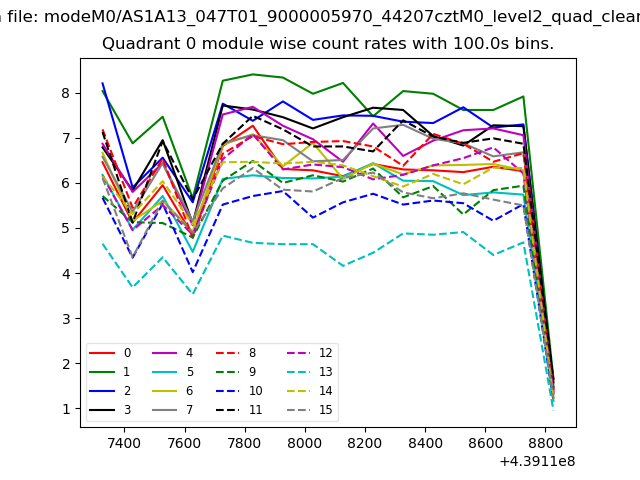 |
 |
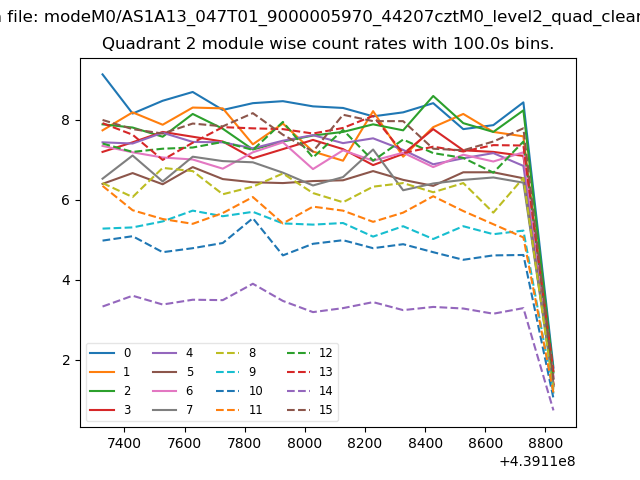
| Module-wise count rates for Quadrant B Data is divided into 100 sec bins |
 |
 |
| Module-wise count rates for Quadrant C Data is divided into 100 sec bins |
 |
 |
| Module-wise count rates for Quadrant D Data is divided into 100 sec bins |
 |
 |
| Parameter | Plot |
|---|---|
| CZT HV Monitor |  |
| D_VDD | 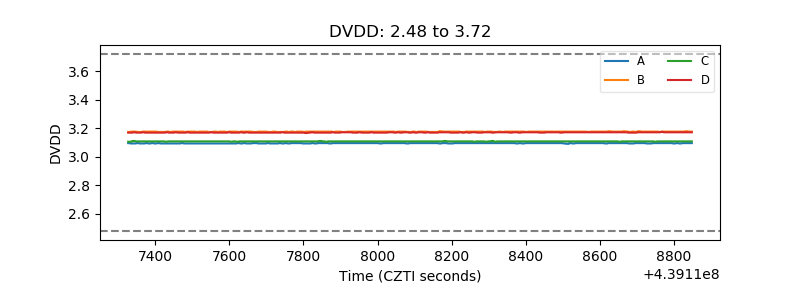 |
| Temperature 1 | 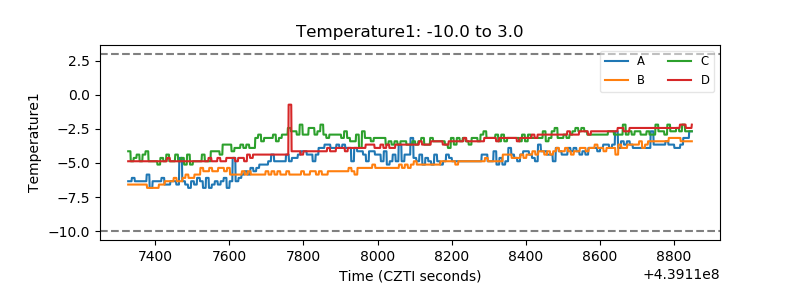 |
| Veto HV Monitor | 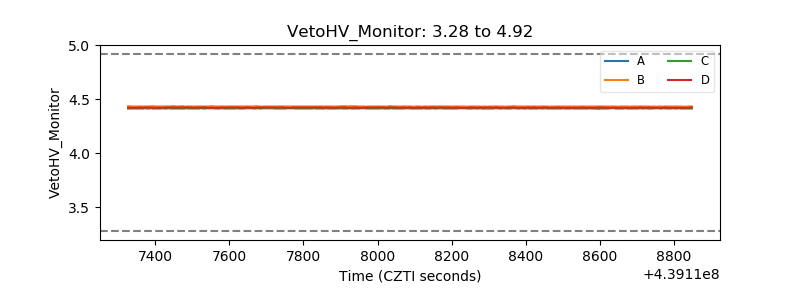 |
| Veto LLD | 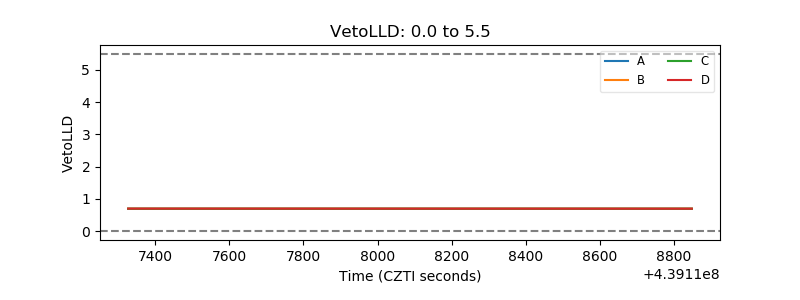 |
| Alpha Counter | 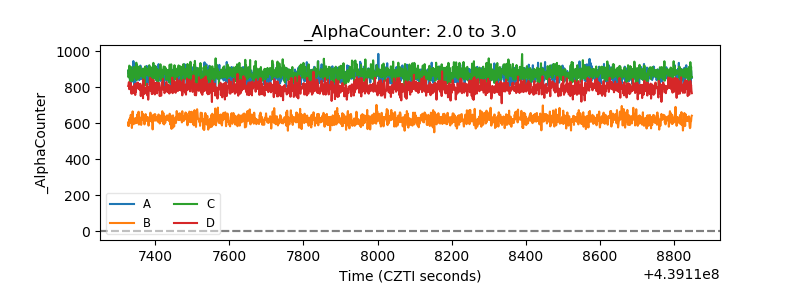 |
| _CPM_Rate |  |
| CZT Counter | 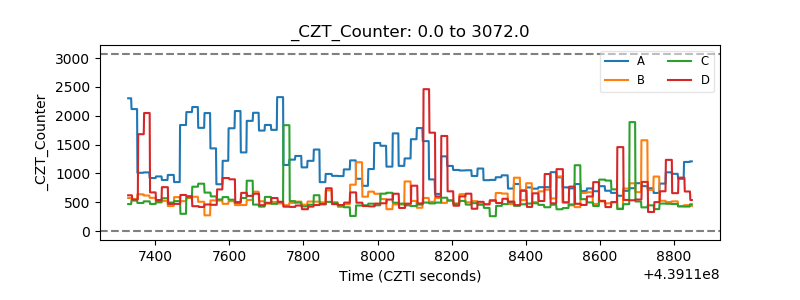 |
| +2.5 Volts monitor | 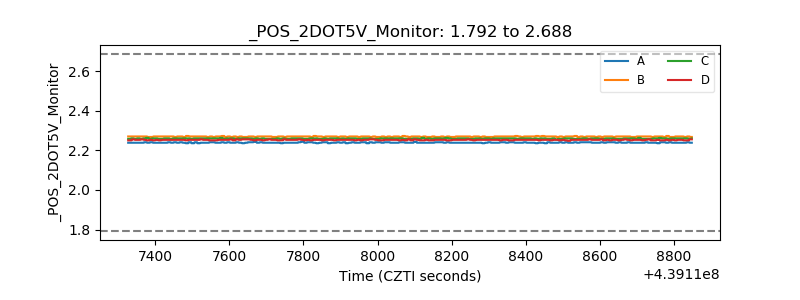 |
| +5 Volts monitor | 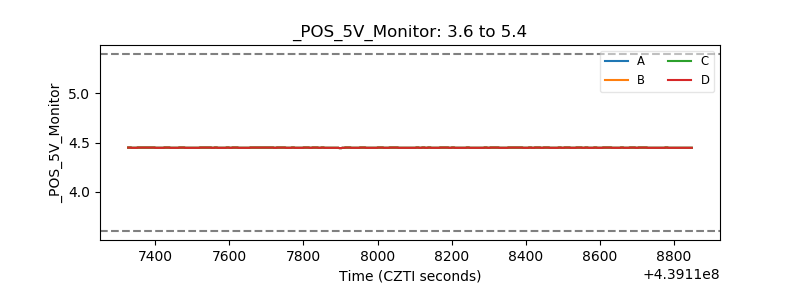 |
| _ROLL_ROT | 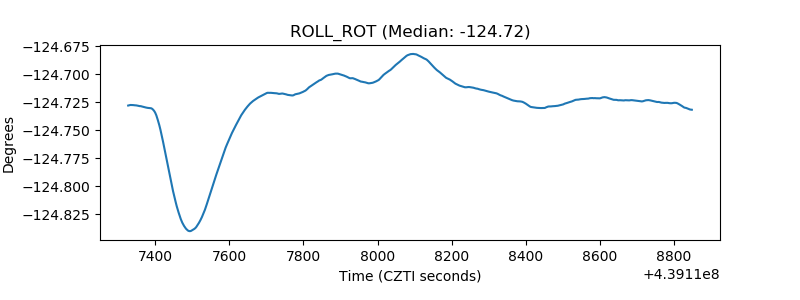 |
| _Roll_DEC | 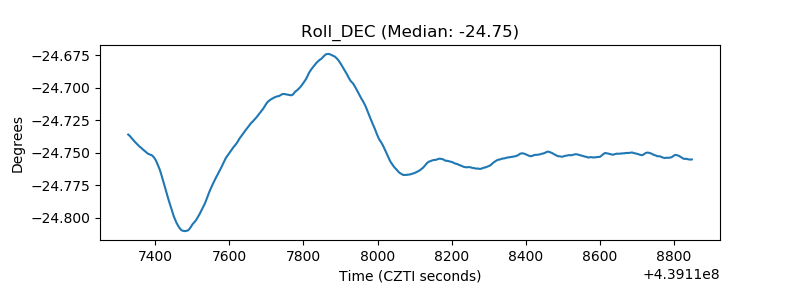 |
| _Roll_RA | 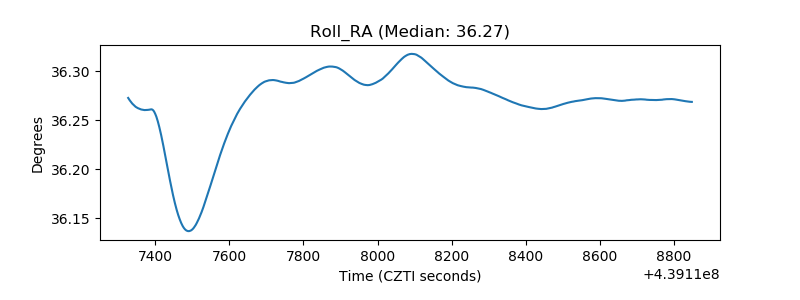 |
| Veto Counter | 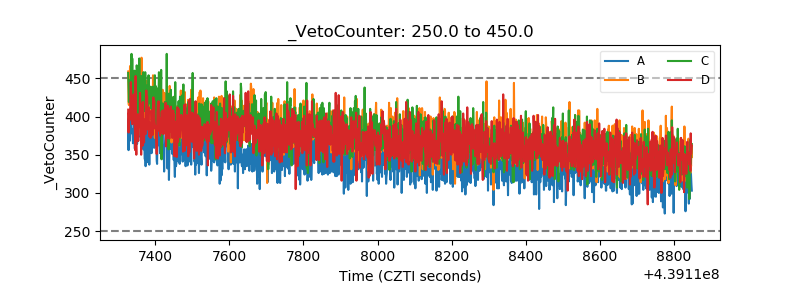 |