| Param | Original file | Final file |
|---|---|---|
| Filename | modeM0/AS1A13_080T05_9000005980_44265cztM0_level2.fits | modeM0/AS1A13_080T05_9000005980_44265cztM0_level2_quad_clean.evt |
| Size (bytes) | 487,759,680 | 76,069,440 |
| Size | 465.2 MB | 72.5 MB |
| Events in quadrant A | 8,142,238 | 380,034 |
| Events in quadrant B | 2,915,908 | 562,060 |
| Events in quadrant C | 2,478,319 | 529,232 |
| Events in quadrant D | 4,109,662 | 463,251 |
| Mode SS | |||
|---|---|---|---|
| Quadrant | BADHDUFLAG | Total packets | Discarded packets |
| A | 0 | 104 | 0 |
| B | 0 | 104 | 0 |
| C | 0 | 104 | 0 |
| D | 0 | 104 | 0 |
| Mode M0 | |||
|---|---|---|---|
| Quadrant | BADHDUFLAG | Total packets | Discarded packets |
| A | 0 | 28032 | 0 |
| B | 0 | 12205 | 0 |
| C | 0 | 11383 | 0 |
| D | 0 | 15857 | 0 |
| Quadrant | Total seconds | Saturated seconds | Saturation percentage |
|---|---|---|---|
| A | 5262 | 1875 | 35.632839% |
| B | 5262 | 56 | 1.064234% |
| C | 5263 | 75 | 1.425043% |
| D | 5263 | 367 | 6.973209% |
Noise dominated data is calculated using 1-second bins in cleaned event files. If a bin has >2000 counts, and if more than 50% of those come from <1% of pixels, then it is considered to be noise-dominated and hence unusable.
| Quadrant | # 1 sec bins | Bins with >0 counts | Bins with >2000 counts | High rate bins dominated by noise | Noise dominated (total time) | Noise dominated (detector-on time) | Marked lightcurve |
|---|---|---|---|---|---|---|---|
| A | 5262 | 5262 | 1638 | 1638 | 31.13% | 31.13% | 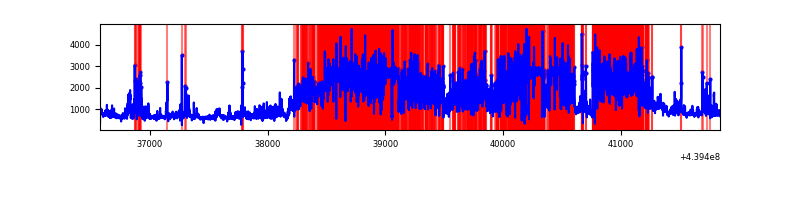 |
| B | 5262 | 5262 | 32 | 32 | 0.61% | 0.61% | 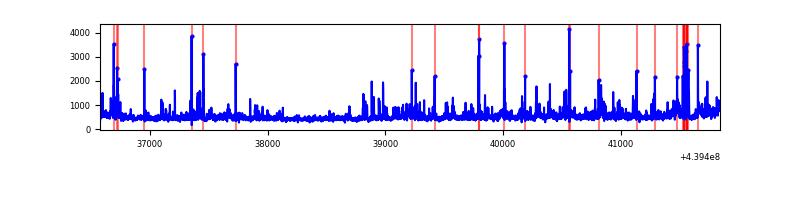 |
| C | 5263 | 5263 | 64 | 64 | 1.22% | 1.22% | 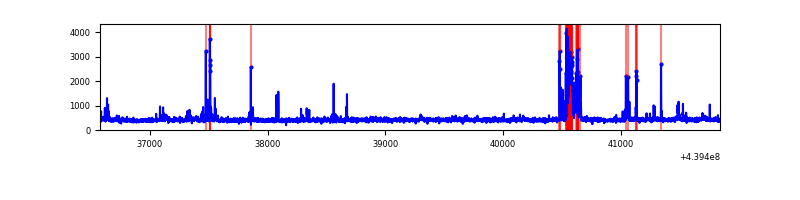 |
| D | 5263 | 5263 | 344 | 344 | 6.54% | 6.54% | 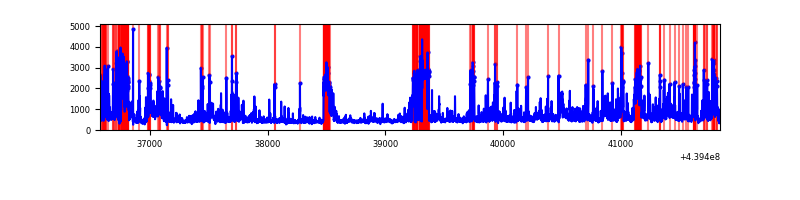 |
Top three noisy pixels from each quadrant. If the there are fewer than three noisy pixels in the level2.evt file, extra rows are filled as -1
| Pixel properties | Quadrant properties | ||||||
|---|---|---|---|---|---|---|---|
| Quadrant | DetID | PixID | Counts | Sigma | Mean | Median | Sigma |
| A | 15 | 223 | 5119284 | 52291.74 | 465 | 453 | 97.9 |
| A | 10 | 83 | 1008355 | 10296.29 | 465 | 453 | 97.9 |
| A | 7 | 3 | 105876 | 1076.96 | 465 | 453 | 97.9 |
| B | 0 | 219 | 88656 | 808.91 | 554 | 538 | 108.9 |
| B | 5 | 172 | 87734 | 800.45 | 554 | 538 | 108.9 |
| B | 0 | 190 | 87036 | 794.04 | 554 | 538 | 108.9 |
| C | 15 | 158 | 187844 | 1459.9 | 539 | 540 | 128.3 |
| C | 14 | 254 | 109785 | 851.48 | 539 | 540 | 128.3 |
| C | 5 | 250 | 50297 | 387.82 | 539 | 540 | 128.3 |
| D | 5 | 235 | 503125 | 3753.65 | 526 | 509 | 133.9 |
| D | 1 | 20 | 301198 | 2245.61 | 526 | 509 | 133.9 |
| D | 12 | 233 | 238383 | 1776.5 | 526 | 509 | 133.9 |
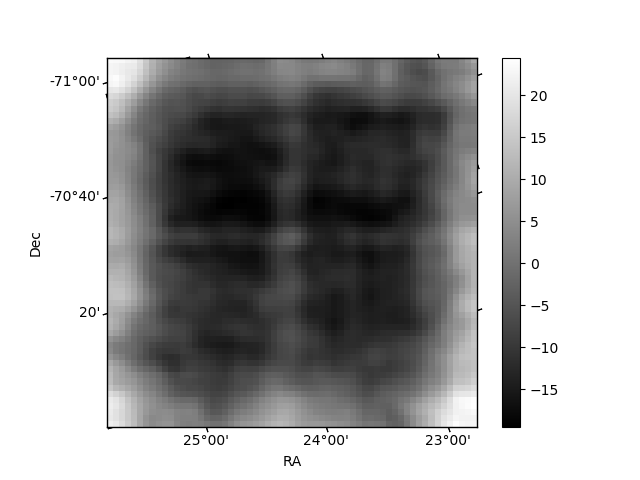
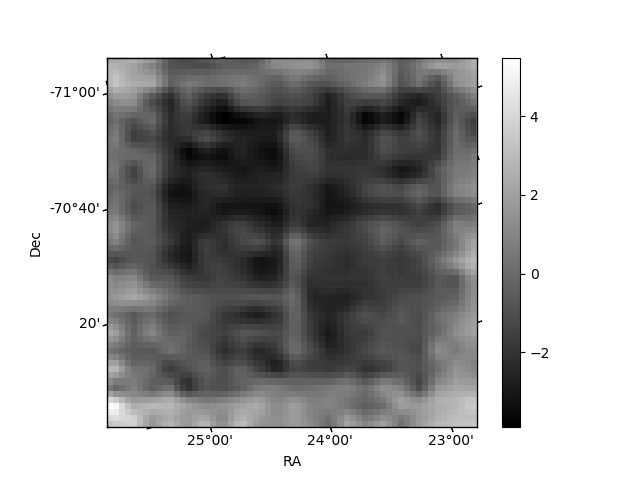
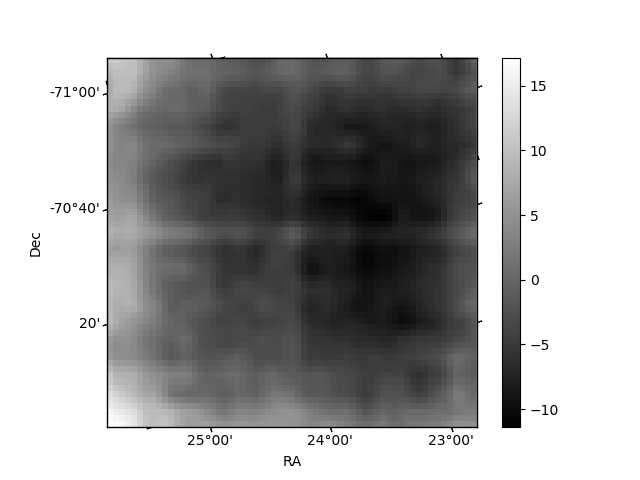
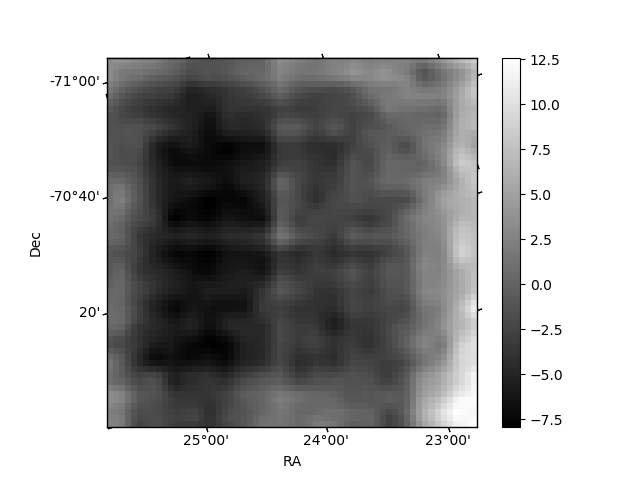
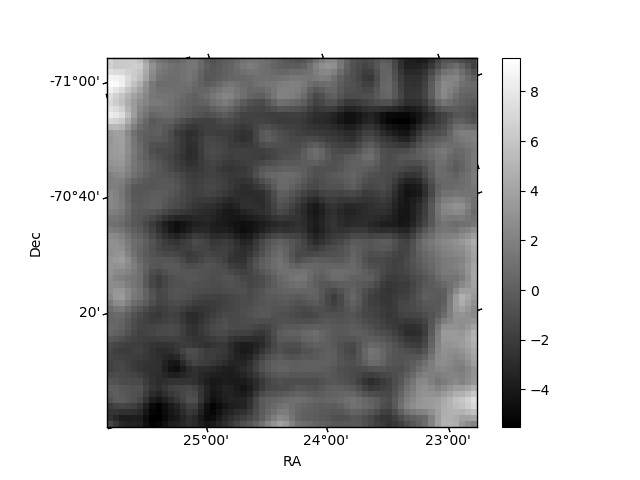
Histogram calculated using DETX and DETY for each event in the final _common_clean file
| Quadrant A | 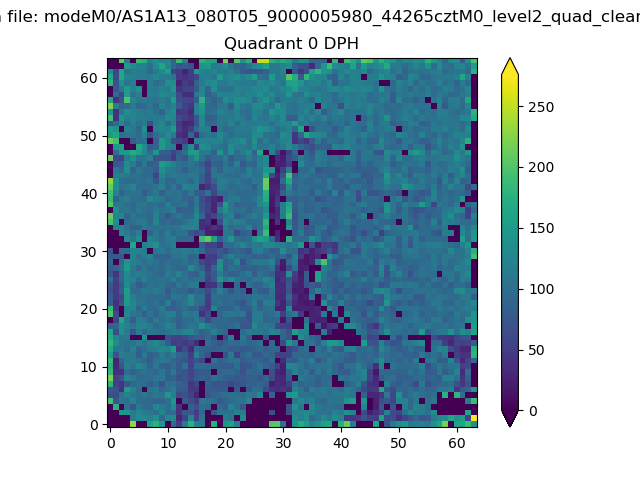 |
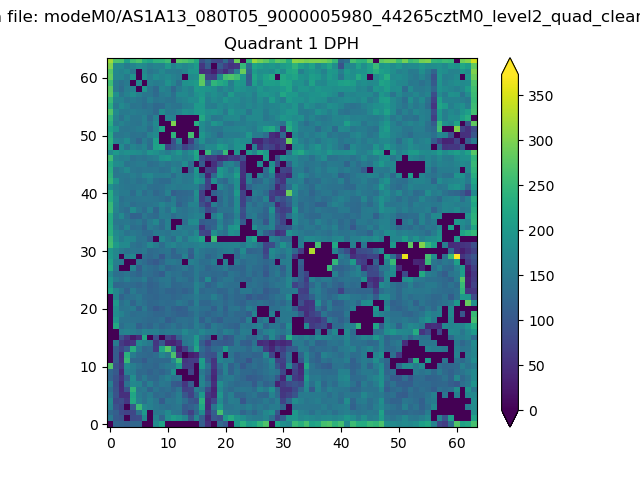 |
Quadrant B |
|---|---|---|---|
| Quadrant D | 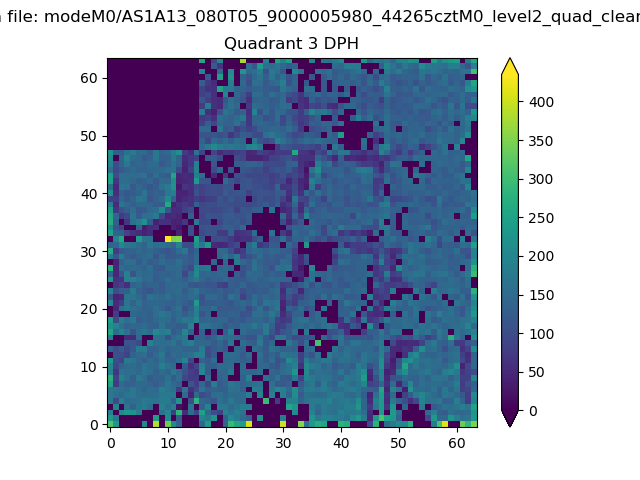 |
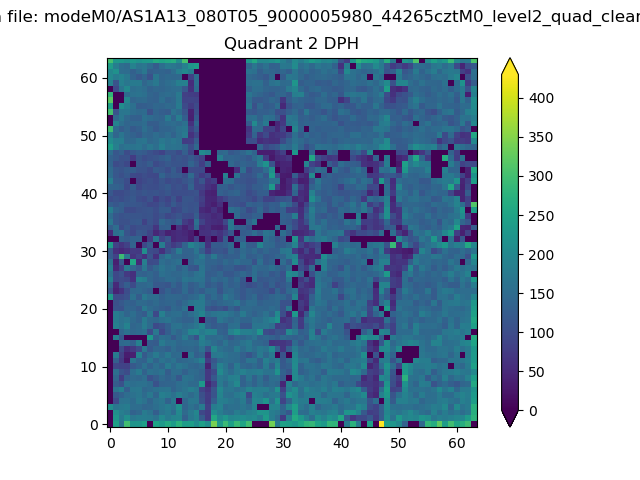 |
Quadrant C |
| Plot type | Count rate plots | Images |
|---|---|---|
| Comparison with Poisson distribution Blue bars denote a histogram of data divided into 1 sec bins. Red curve is a Poisson curve with rate = median count rate of data. |
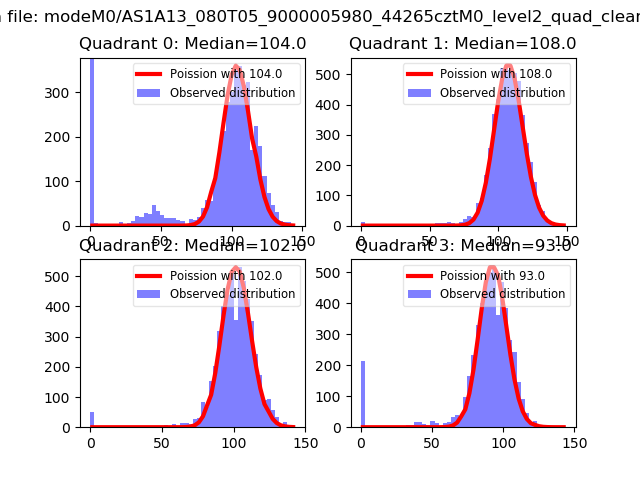 |
 |
| Quadrant-wise count rates Data is divided into 100 sec bins |
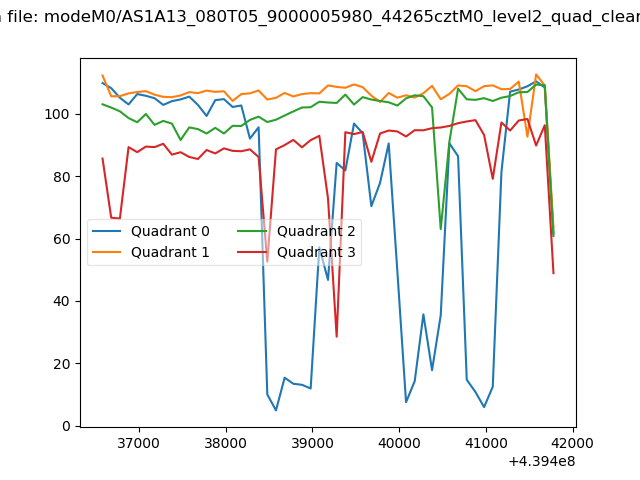 |
|
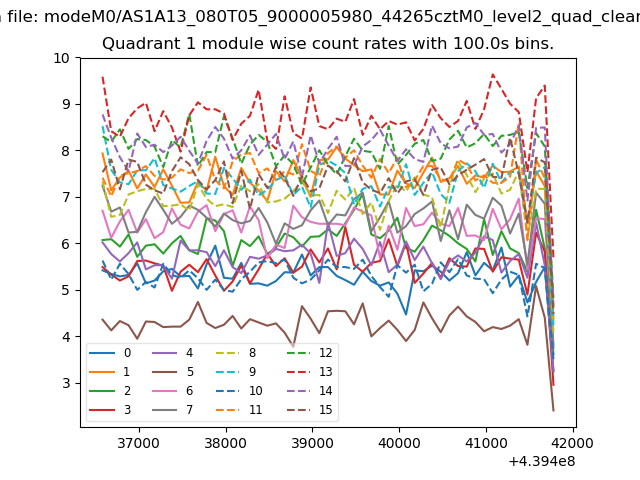
| Module-wise count rates for Quadrant A Data is divided into 100 sec bins |
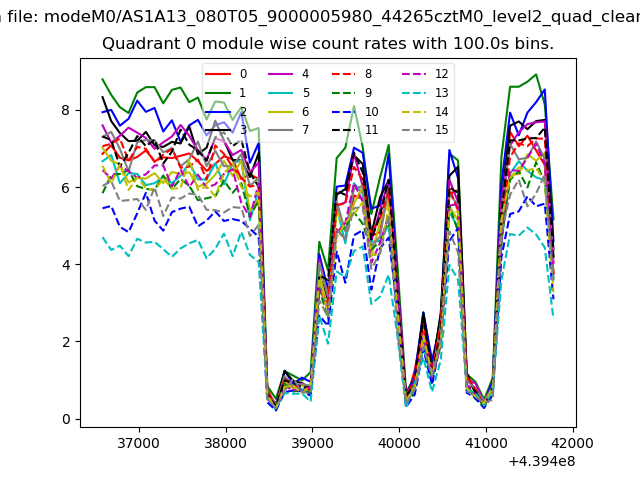 |
 |
| Module-wise count rates for Quadrant B Data is divided into 100 sec bins |
 |
 |
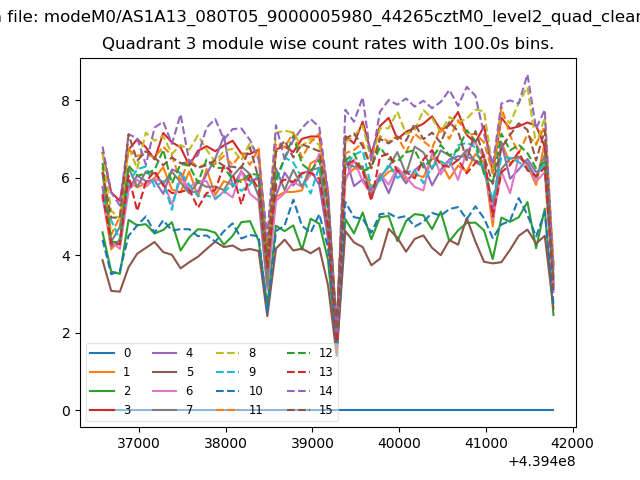
| Module-wise count rates for Quadrant C Data is divided into 100 sec bins |
 |
 |
| Module-wise count rates for Quadrant D Data is divided into 100 sec bins |
 |
 |
| Parameter | Plot |
|---|---|
| CZT HV Monitor |  |
| D_VDD | 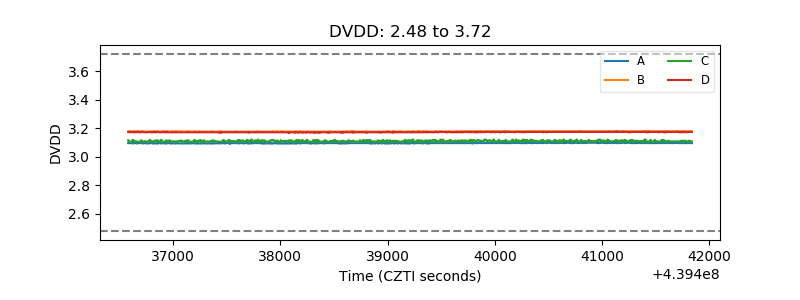 |
| Temperature 1 | 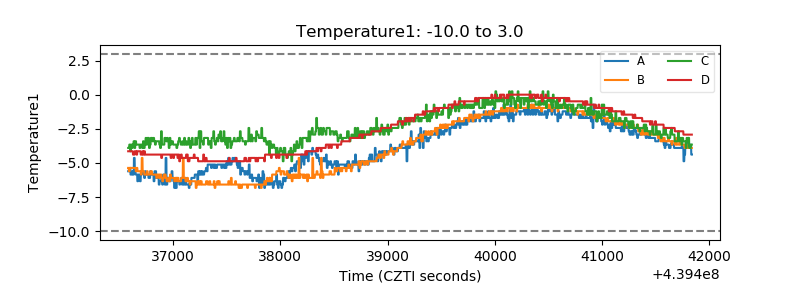 |
| Veto HV Monitor | 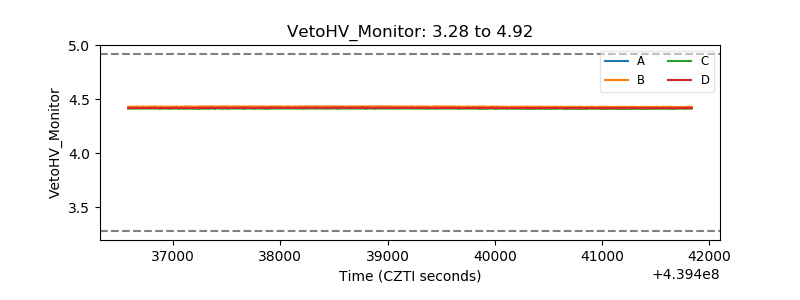 |
| Veto LLD | 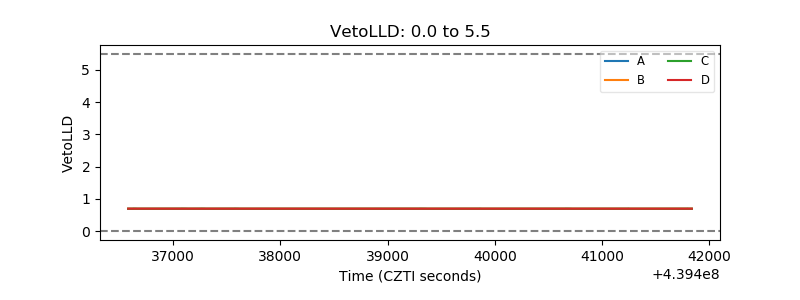 |
| Alpha Counter | 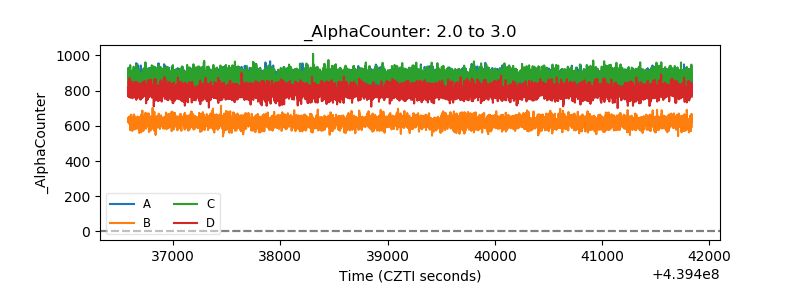 |
| _CPM_Rate | 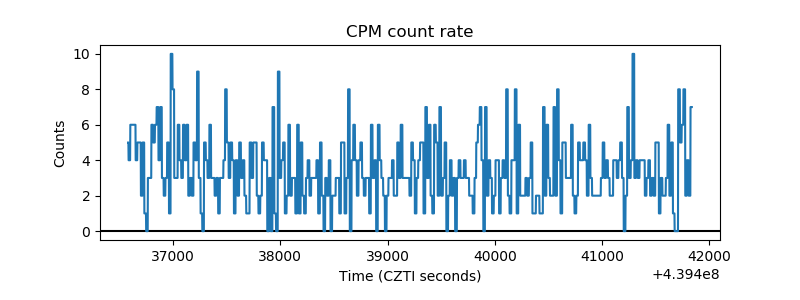 |
| CZT Counter | 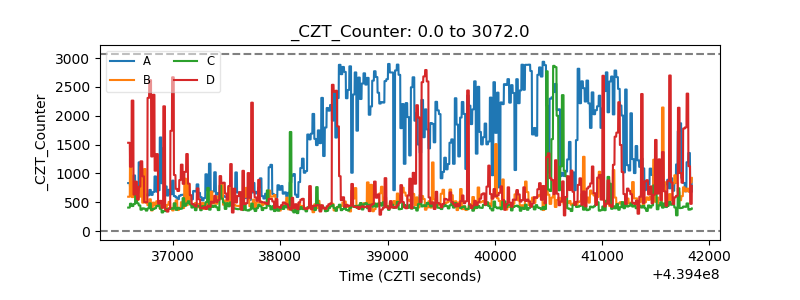 |
| +2.5 Volts monitor | 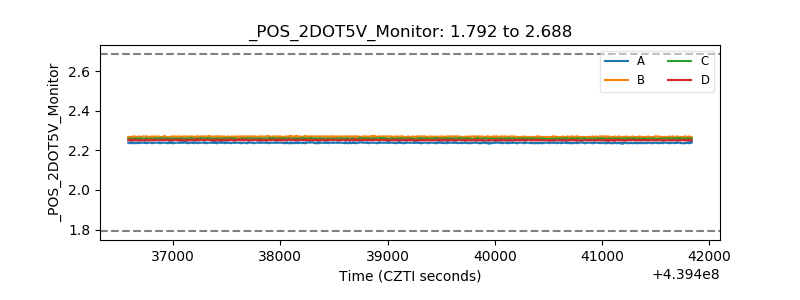 |
| +5 Volts monitor | 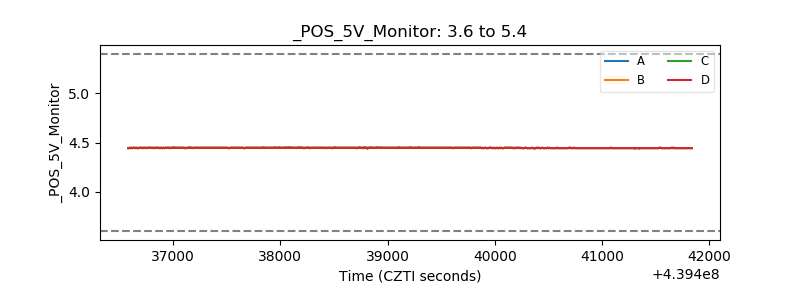 |
| _ROLL_ROT | 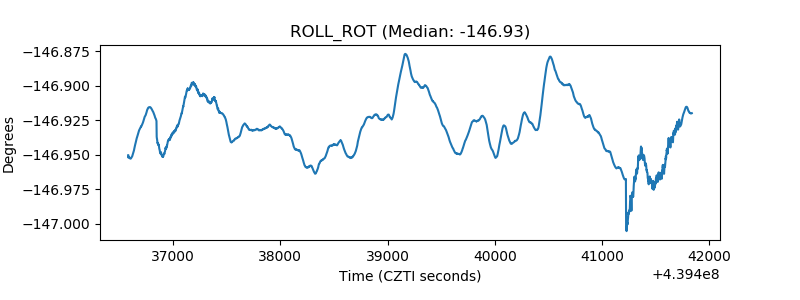 |
| _Roll_DEC | 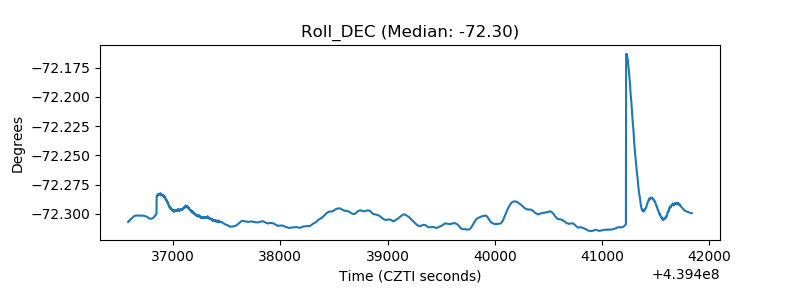 |
| _Roll_RA | 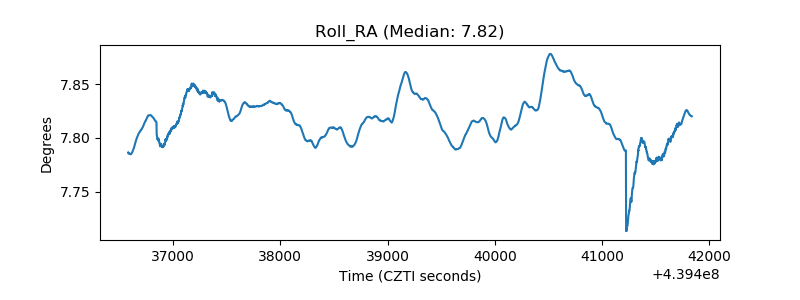 |
| Veto Counter | 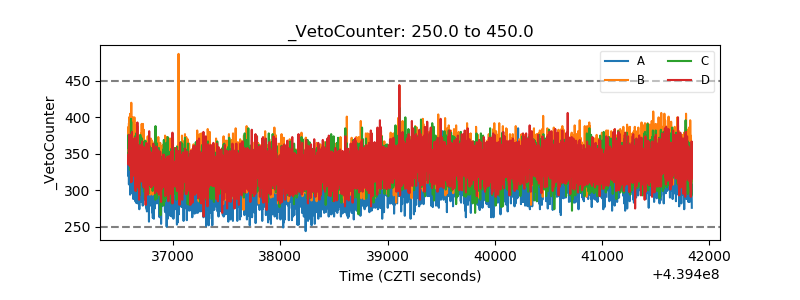 |