| Param | Original file | Final file |
|---|---|---|
| Filename | modeM0/AS1A13_080T05_9000005980_44444cztM0_level2.fits | modeM0/AS1A13_080T05_9000005980_44444cztM0_level2_quad_clean.evt |
| Size (bytes) | 115,721,280 | 30,493,440 |
| Size | 110.4 MB | 29.1 MB |
| Events in quadrant A | 1,253,204 | 207,032 |
| Events in quadrant B | 843,078 | 214,439 |
| Events in quadrant C | 833,663 | 202,820 |
| Events in quadrant D | 1,215,612 | 171,916 |
| Mode SS | |||
|---|---|---|---|
| Quadrant | BADHDUFLAG | Total packets | Discarded packets |
| A | 0 | 34 | 0 |
| B | 0 | 34 | 0 |
| C | 0 | 34 | 0 |
| D | 0 | 34 | 0 |
| Mode M0 | |||
|---|---|---|---|
| Quadrant | BADHDUFLAG | Total packets | Discarded packets |
| A | 0 | 5100 | 0 |
| B | 0 | 3707 | 0 |
| C | 0 | 3718 | 0 |
| D | 0 | 4904 | 0 |
| Quadrant | Total seconds | Saturated seconds | Saturation percentage |
|---|---|---|---|
| A | 1740 | 4 | 0.229885% |
| B | 1740 | 20 | 1.149425% |
| C | 1741 | 4 | 0.229753% |
| D | 1741 | 153 | 8.788053% |
Noise dominated data is calculated using 1-second bins in cleaned event files. If a bin has >2000 counts, and if more than 50% of those come from <1% of pixels, then it is considered to be noise-dominated and hence unusable.
| Quadrant | # 1 sec bins | Bins with >0 counts | Bins with >2000 counts | High rate bins dominated by noise | Noise dominated (total time) | Noise dominated (detector-on time) | Marked lightcurve |
|---|---|---|---|---|---|---|---|
| A | 1740 | 1740 | 0 | 0 | 0.00% | 0.00% | 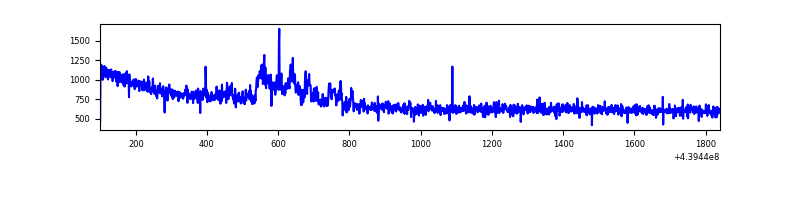 |
| B | 1740 | 1740 | 13 | 13 | 0.75% | 0.75% | 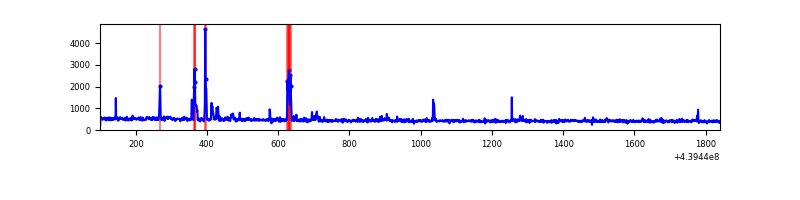 |
| C | 1741 | 1741 | 2 | 2 | 0.11% | 0.11% | 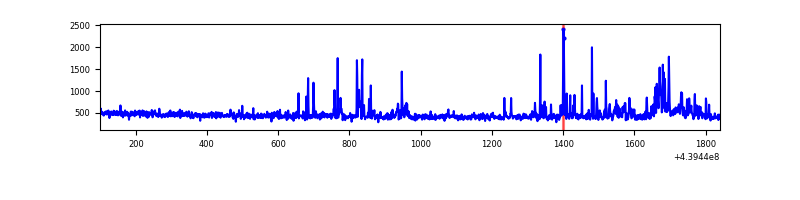 |
| D | 1741 | 1741 | 119 | 119 | 6.84% | 6.84% | 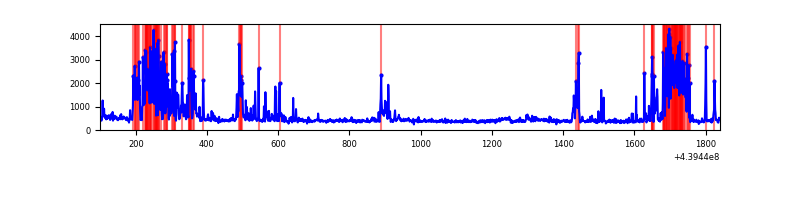 |
Top three noisy pixels from each quadrant. If the there are fewer than three noisy pixels in the level2.evt file, extra rows are filled as -1
| Pixel properties | Quadrant properties | ||||||
|---|---|---|---|---|---|---|---|
| Quadrant | DetID | PixID | Counts | Sigma | Mean | Median | Sigma |
| A | 10 | 83 | 450095 | 10889.84 | 192 | 188 | 41.3 |
| A | 15 | 235 | 59181 | 1427.91 | 192 | 188 | 41.3 |
| A | 8 | 4 | 2310 | 51.36 | 192 | 188 | 41.3 |
| B | 5 | 255 | 41453 | 1041.46 | 191 | 186 | 39.6 |
| B | 5 | 172 | 27682 | 693.92 | 191 | 186 | 39.6 |
| B | 0 | 168 | 11100 | 275.44 | 191 | 186 | 39.6 |
| C | 14 | 254 | 63965 | 1427.29 | 185 | 186 | 44.7 |
| C | 2 | 14 | 37114 | 826.4 | 185 | 186 | 44.7 |
| C | 3 | 233 | 6482 | 140.9 | 185 | 186 | 44.7 |
| D | 12 | 17 | 254351 | 5618.69 | 176 | 171 | 45.2 |
| D | 2 | 249 | 198737 | 4389.34 | 176 | 171 | 45.2 |
| D | 13 | 249 | 44745 | 985.32 | 176 | 171 | 45.2 |
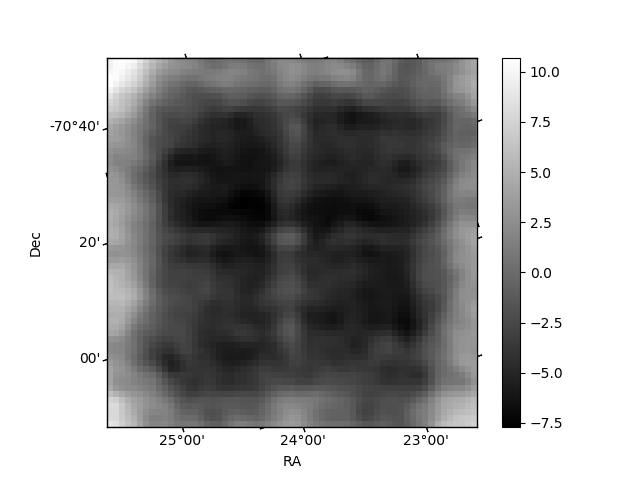
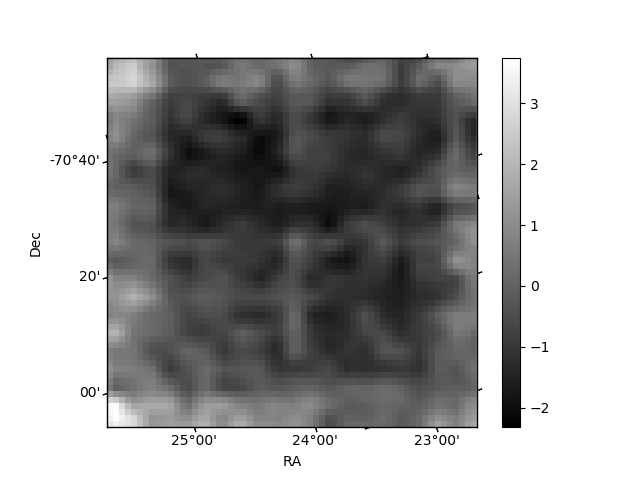
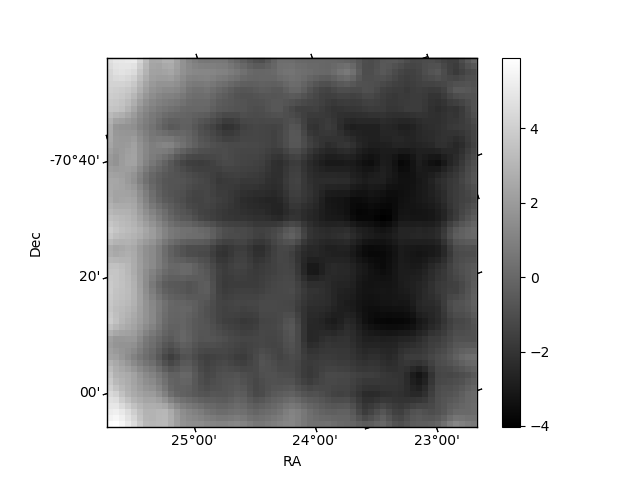
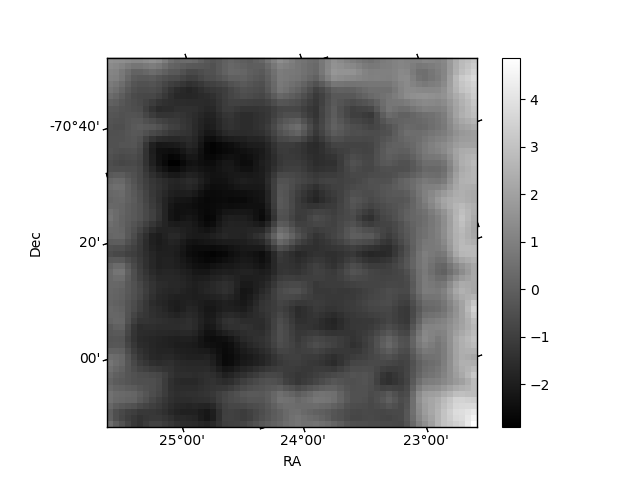
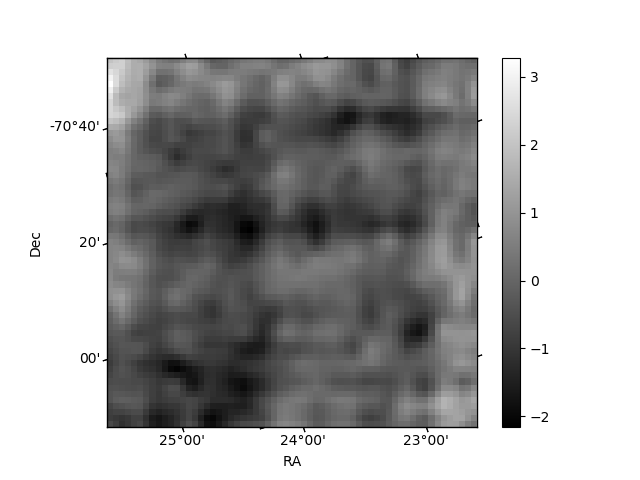
Histogram calculated using DETX and DETY for each event in the final _common_clean file
| Quadrant A | 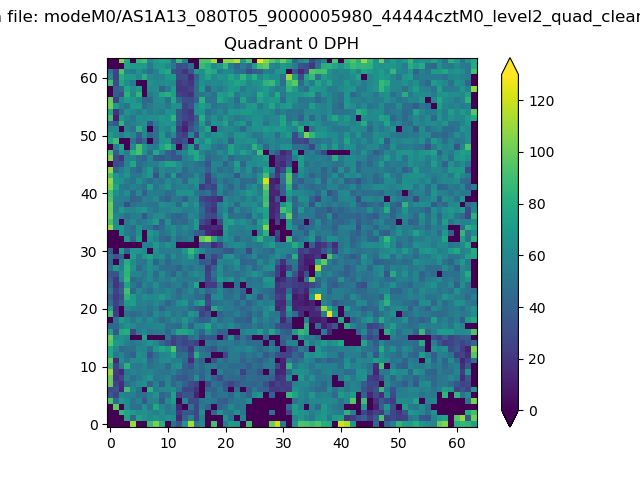 |
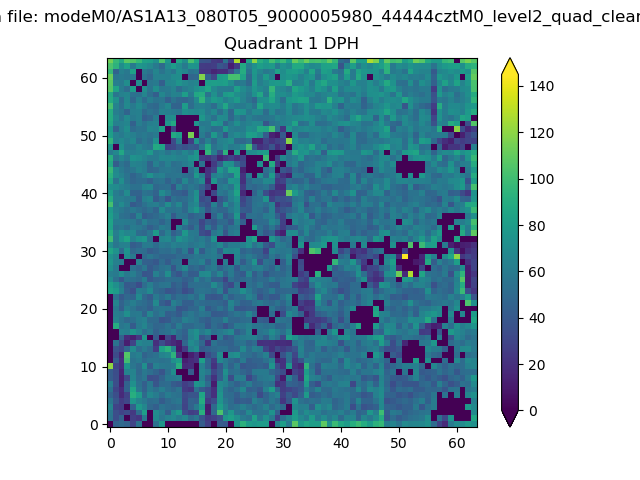 |
Quadrant B |
|---|---|---|---|
| Quadrant D | 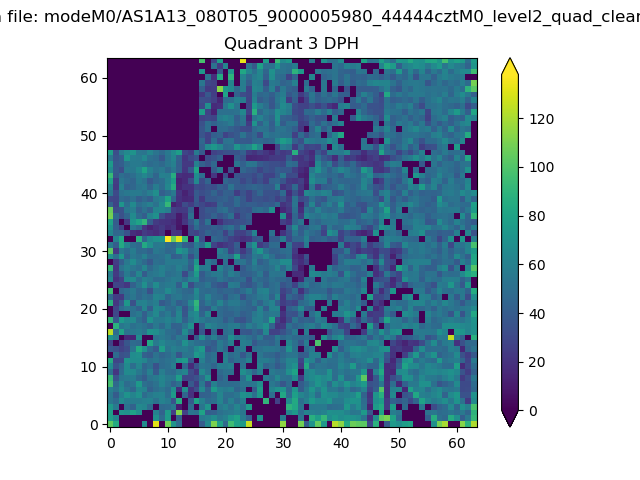 |
 |
Quadrant C |
| Plot type | Count rate plots | Images |
|---|---|---|
| Comparison with Poisson distribution Blue bars denote a histogram of data divided into 1 sec bins. Red curve is a Poisson curve with rate = median count rate of data. |
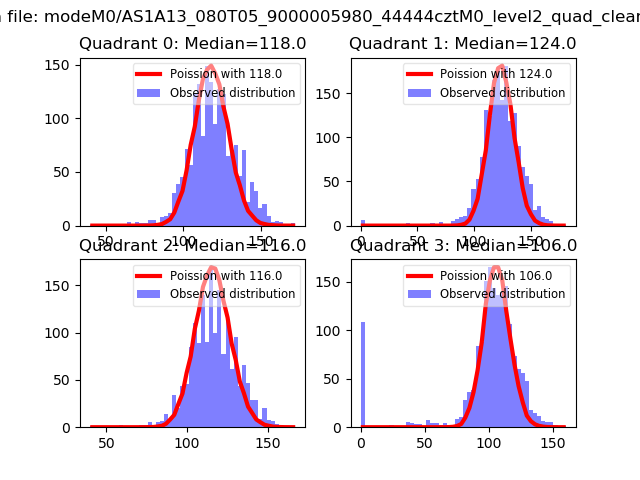 |
 |
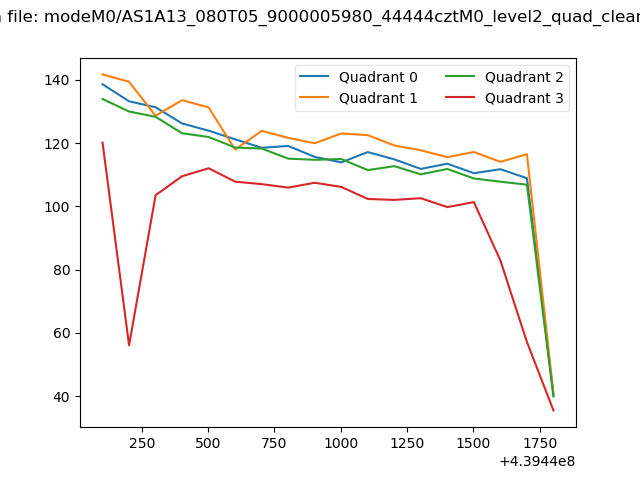
| Quadrant-wise count rates Data is divided into 100 sec bins |
 |
|
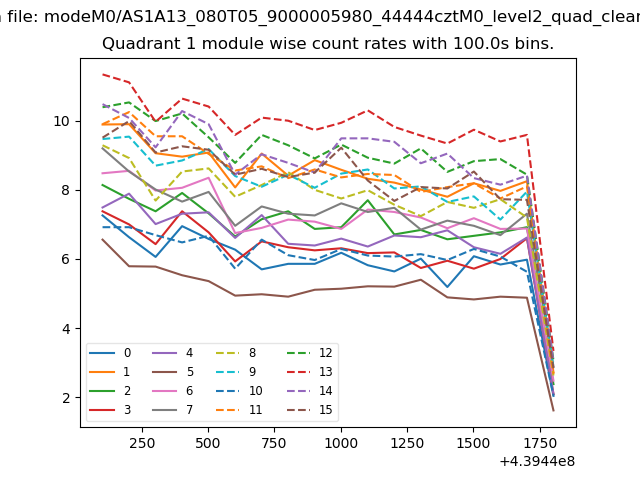
| Module-wise count rates for Quadrant A Data is divided into 100 sec bins |
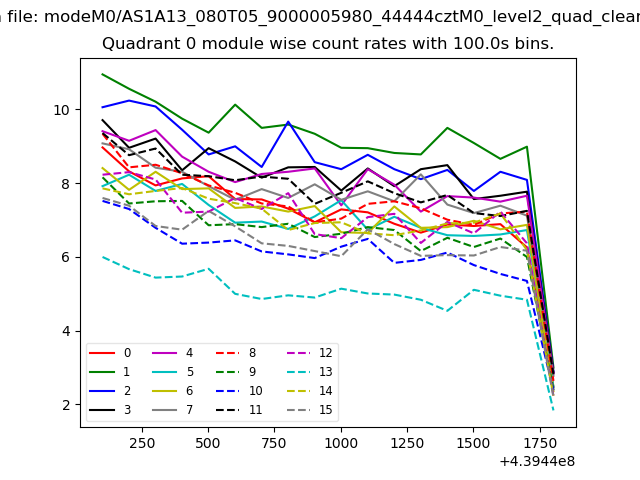 |
 |
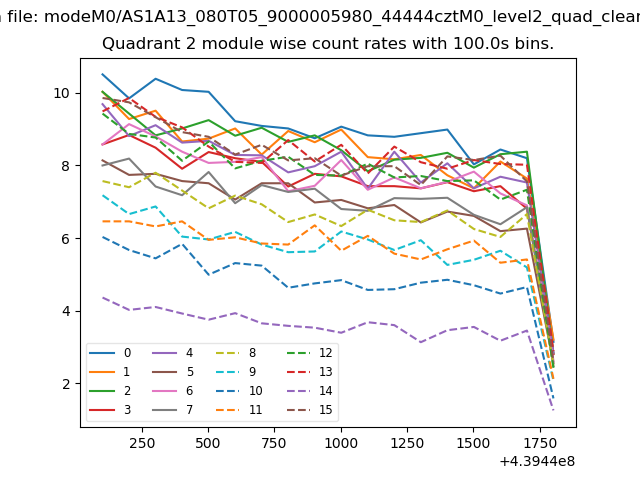
| Module-wise count rates for Quadrant B Data is divided into 100 sec bins |
 |
 |
| Module-wise count rates for Quadrant C Data is divided into 100 sec bins |
 |
 |
| Module-wise count rates for Quadrant D Data is divided into 100 sec bins |
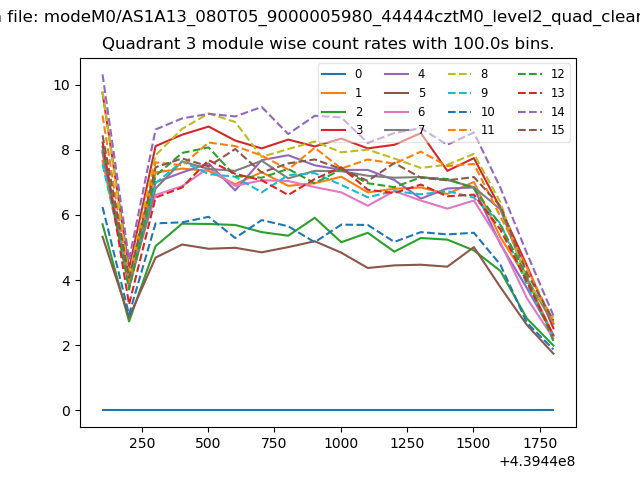 |
 |
| Parameter | Plot |
|---|---|
| CZT HV Monitor | 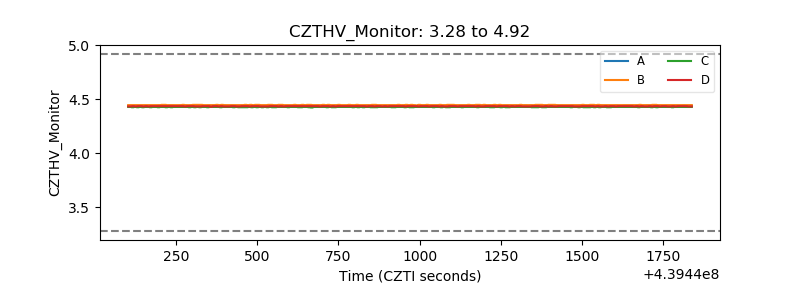 |
| D_VDD | 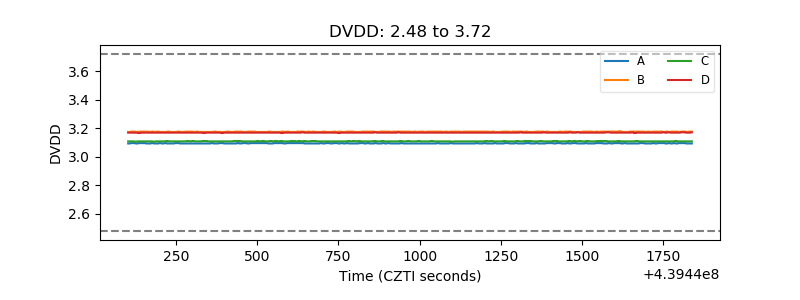 |
| Temperature 1 | 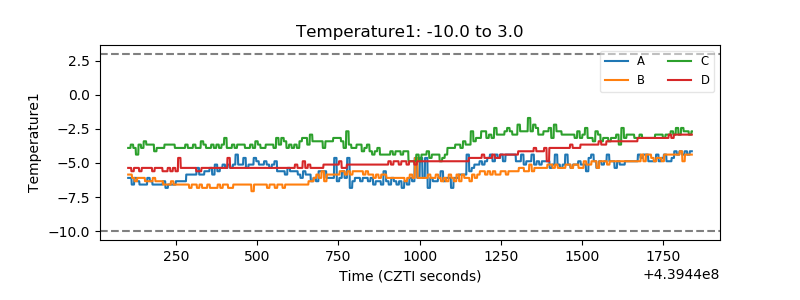 |
| Veto HV Monitor | 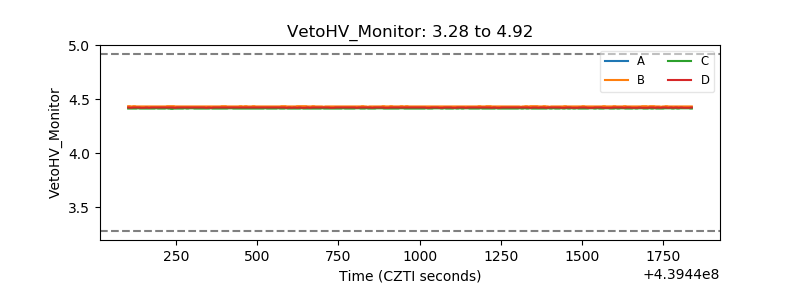 |
| Veto LLD | 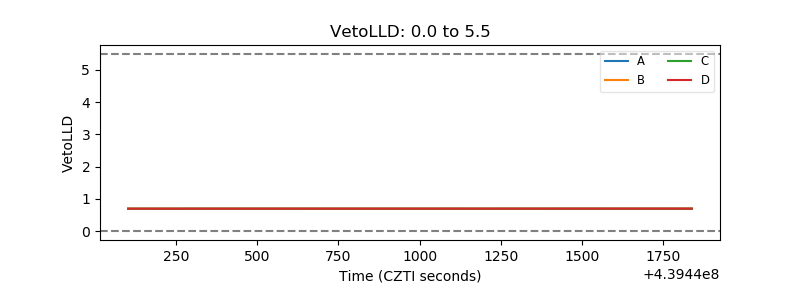 |
| Alpha Counter | 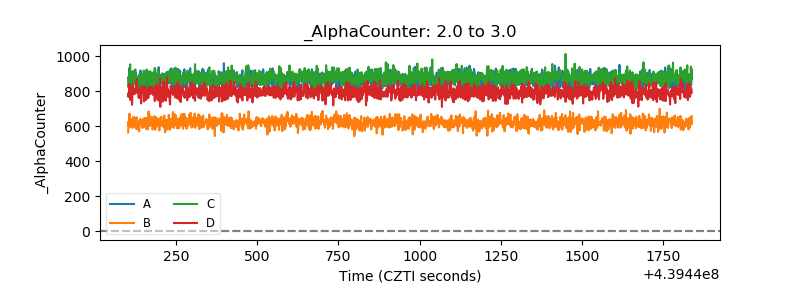 |
| _CPM_Rate | 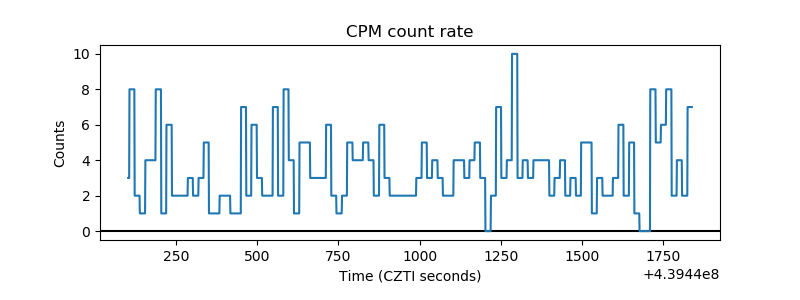 |
| CZT Counter | 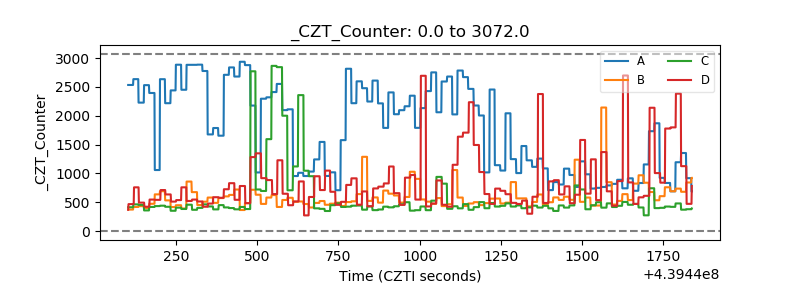 |
| +2.5 Volts monitor | 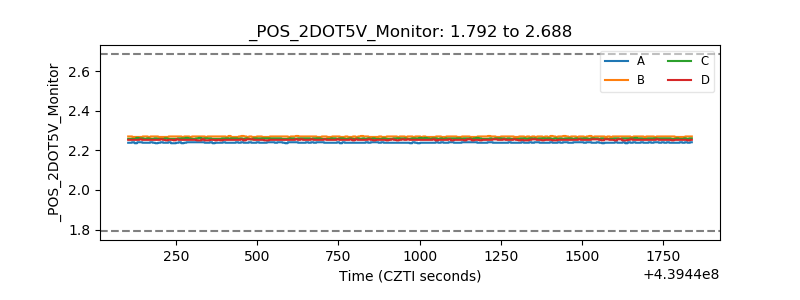 |
| +5 Volts monitor | 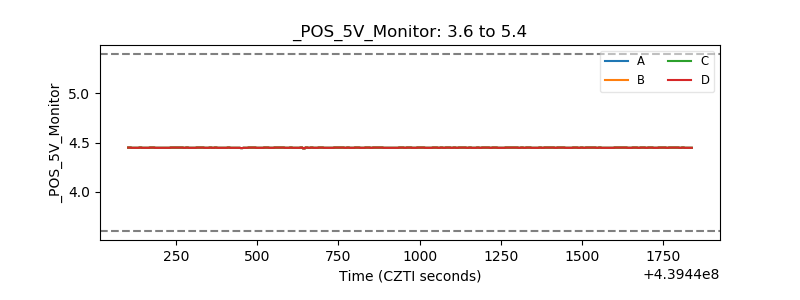 |
| _ROLL_ROT | 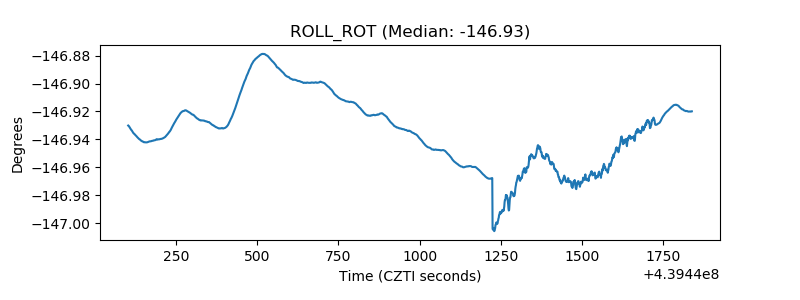 |
| _Roll_DEC | 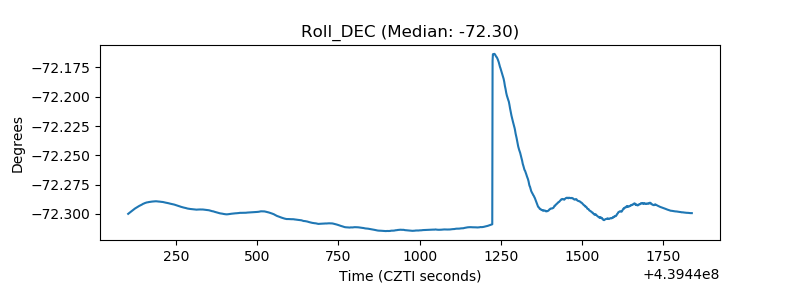 |
| _Roll_RA | 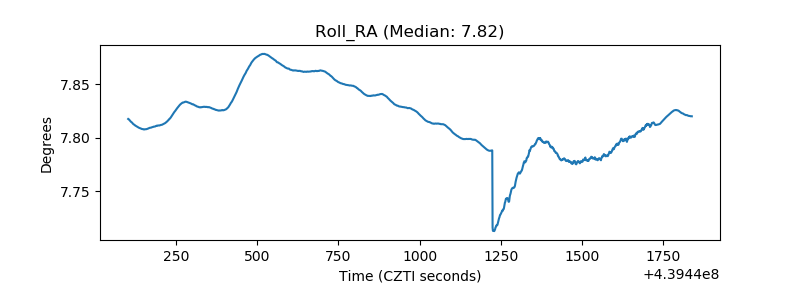 |
| Veto Counter | 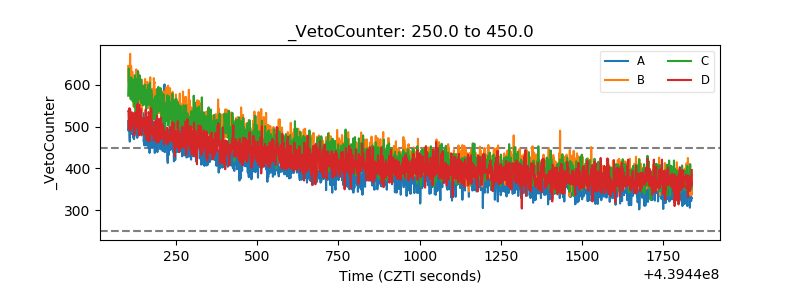 |