| Param | Original file | Final file |
|---|---|---|
| Filename | modeM0/AS1A13_080T06_9000005982_44271cztM0_level2.fits | modeM0/AS1A13_080T06_9000005982_44271cztM0_level2_quad_clean.evt |
| Size (bytes) | 310,815,360 | 47,747,520 |
| Size | 296.4 MB | 45.5 MB |
| Events in quadrant A | 4,775,747 | 272,607 |
| Events in quadrant B | 1,860,112 | 352,615 |
| Events in quadrant C | 1,293,123 | 334,287 |
| Events in quadrant D | 3,345,235 | 274,824 |
| Mode M0 | |||
|---|---|---|---|
| Quadrant | BADHDUFLAG | Total packets | Discarded packets |
| A | 0 | 16276 | 0 |
| B | 0 | 7527 | 0 |
| C | 0 | 6120 | 0 |
| D | 0 | 12023 | 0 |
| Mode SS | |||
|---|---|---|---|
| Quadrant | BADHDUFLAG | Total packets | Discarded packets |
| A | 0 | 60 | 0 |
| B | 0 | 60 | 0 |
| C | 0 | 60 | 0 |
| D | 0 | 60 | 0 |
| Quadrant | Total seconds | Saturated seconds | Saturation percentage |
|---|---|---|---|
| A | 2962 | 789 | 26.637407% |
| B | 2962 | 39 | 1.316678% |
| C | 2963 | 5 | 0.168748% |
| D | 2963 | 424 | 14.309821% |
Noise dominated data is calculated using 1-second bins in cleaned event files. If a bin has >2000 counts, and if more than 50% of those come from <1% of pixels, then it is considered to be noise-dominated and hence unusable.
| Quadrant | # 1 sec bins | Bins with >0 counts | Bins with >2000 counts | High rate bins dominated by noise | Noise dominated (total time) | Noise dominated (detector-on time) | Marked lightcurve |
|---|---|---|---|---|---|---|---|
| A | 2962 | 2962 | 818 | 818 | 27.62% | 27.62% | 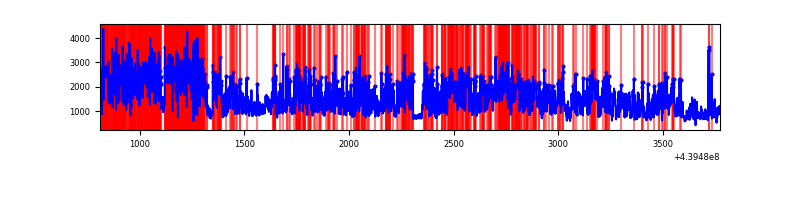 |
| B | 2962 | 2962 | 29 | 29 | 0.98% | 0.98% | 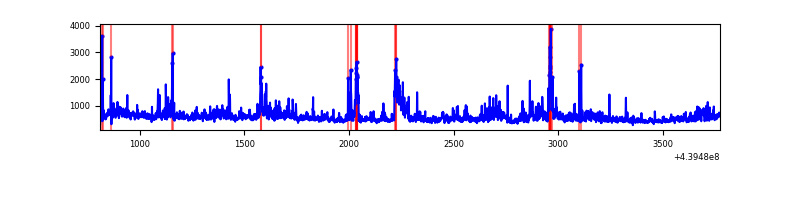 |
| C | 2963 | 2963 | 3 | 3 | 0.10% | 0.10% | 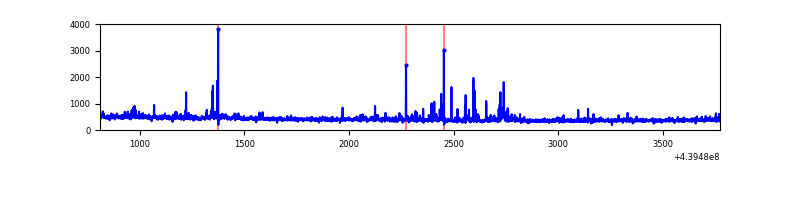 |
| D | 2963 | 2963 | 417 | 417 | 14.07% | 14.07% | 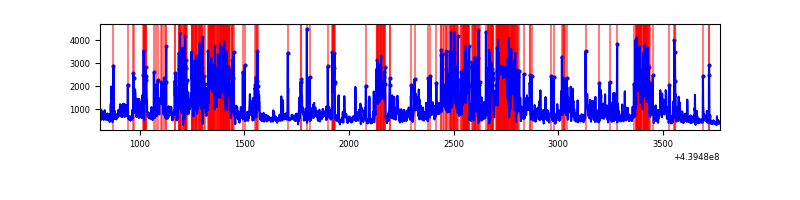 |
Top three noisy pixels from each quadrant. If the there are fewer than three noisy pixels in the level2.evt file, extra rows are filled as -1
| Pixel properties | Quadrant properties | ||||||
|---|---|---|---|---|---|---|---|
| Quadrant | DetID | PixID | Counts | Sigma | Mean | Median | Sigma |
| A | 15 | 223 | 2852873 | 46696.41 | 288 | 283 | 61.1 |
| A | 10 | 83 | 730078 | 11946.62 | 288 | 283 | 61.1 |
| A | 7 | 3 | 27691 | 448.66 | 288 | 283 | 61.1 |
| B | 4 | 173 | 116242 | 1859.01 | 321 | 313 | 62.4 |
| B | 0 | 189 | 94712 | 1513.76 | 321 | 313 | 62.4 |
| B | 0 | 200 | 72257 | 1153.68 | 321 | 313 | 62.4 |
| C | 3 | 233 | 37275 | 515.23 | 304 | 306 | 71.8 |
| C | 14 | 254 | 35386 | 488.9 | 304 | 306 | 71.8 |
| C | 12 | 250 | 24645 | 339.21 | 304 | 306 | 71.8 |
| D | 1 | 52 | 1216263 | 16424.62 | 290 | 279 | 74.0 |
| D | 5 | 235 | 288139 | 3888.2 | 290 | 279 | 74.0 |
| D | 12 | 1 | 249993 | 3372.95 | 290 | 279 | 74.0 |
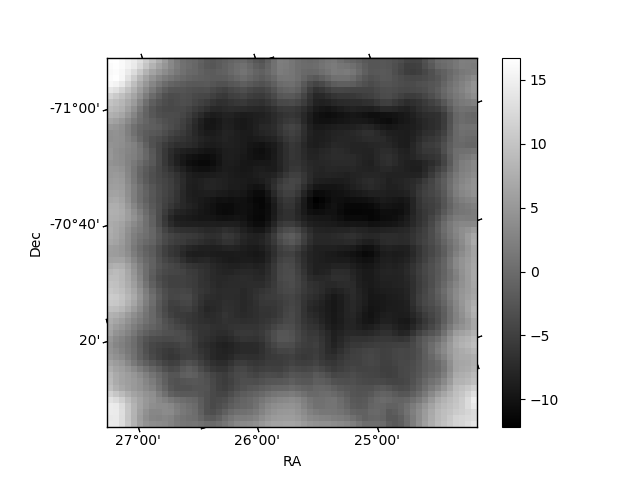
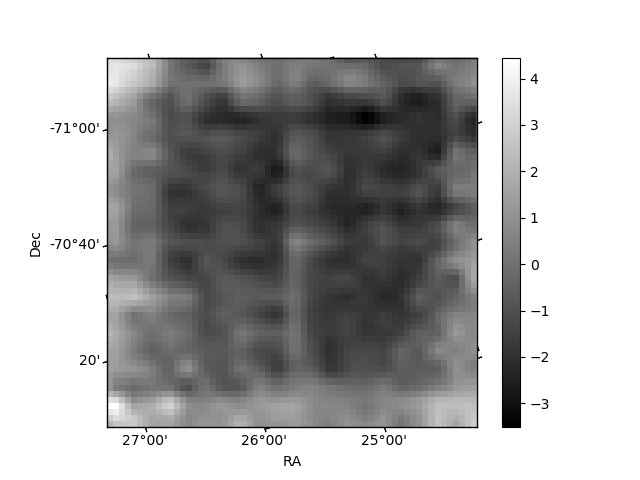
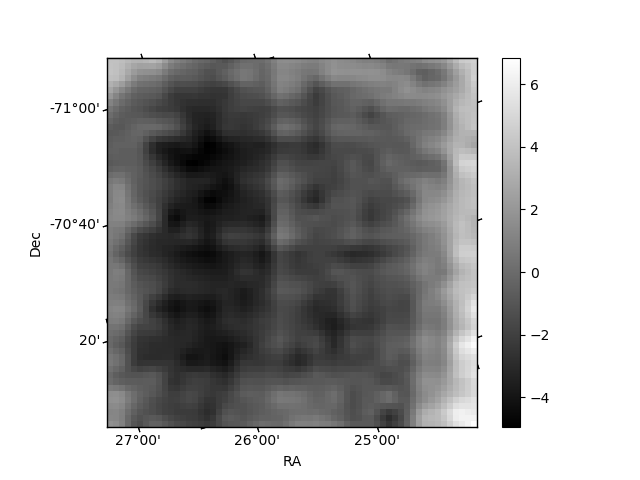
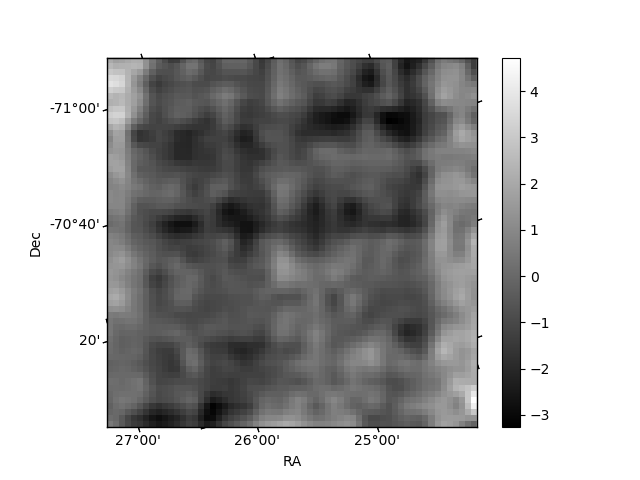
Histogram calculated using DETX and DETY for each event in the final _common_clean file
| Quadrant A | 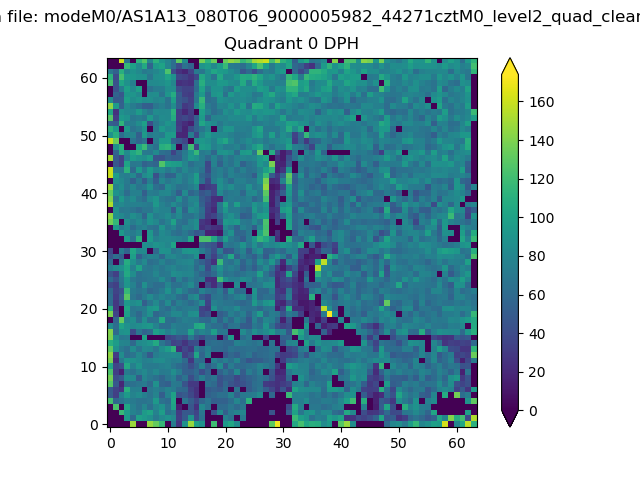 |
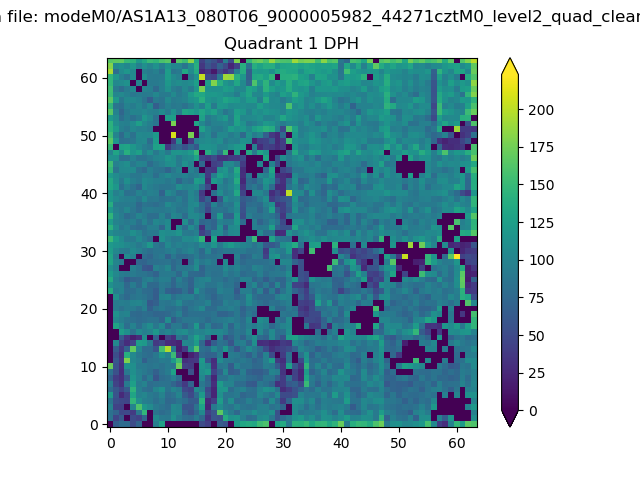 |
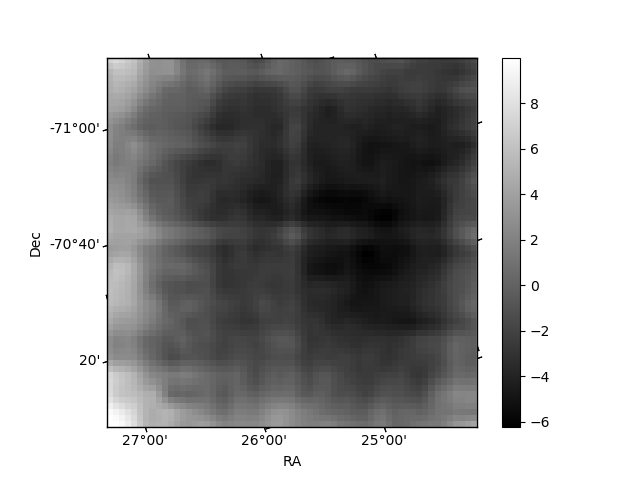
Quadrant B |
|---|---|---|---|
| Quadrant D | 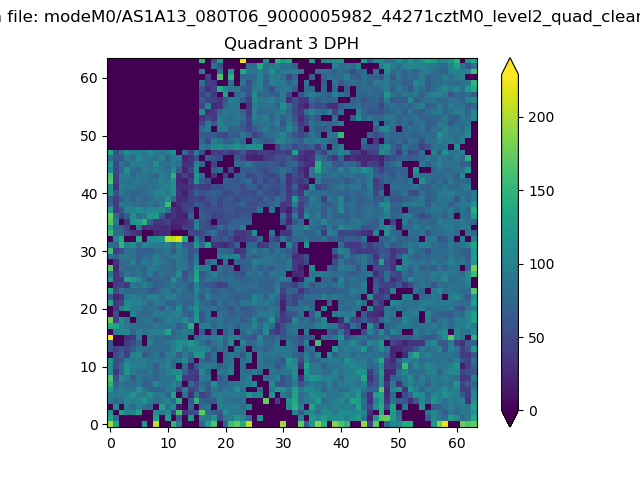 |
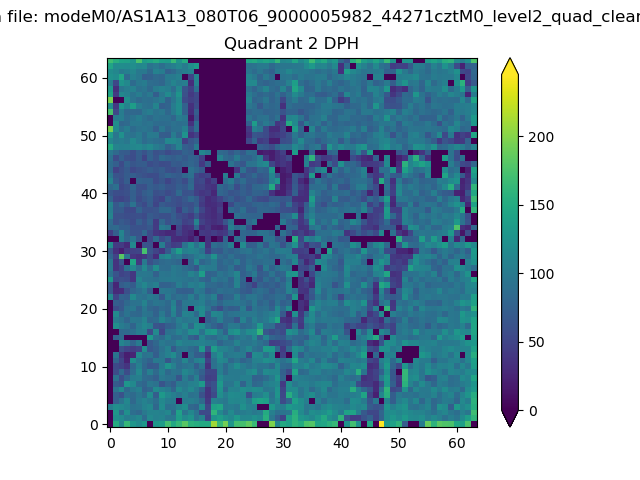 |
Quadrant C |
| Plot type | Count rate plots | Images |
|---|---|---|
| Comparison with Poisson distribution Blue bars denote a histogram of data divided into 1 sec bins. Red curve is a Poisson curve with rate = median count rate of data. |
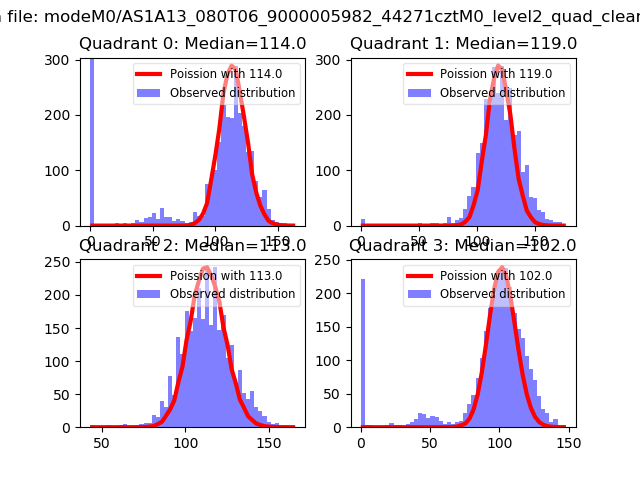 |
 |
| Quadrant-wise count rates Data is divided into 100 sec bins |
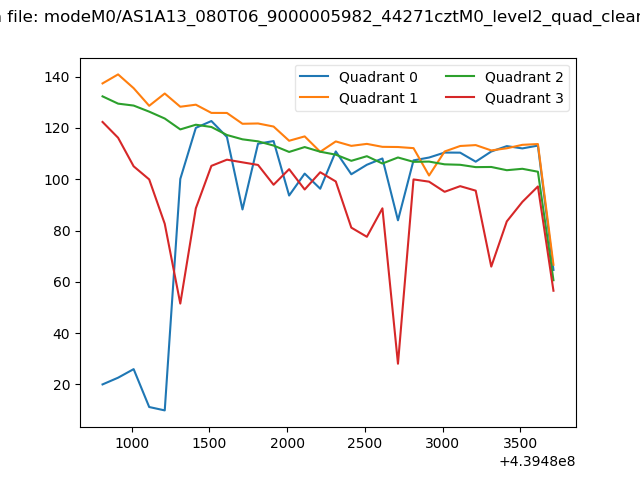 |
|
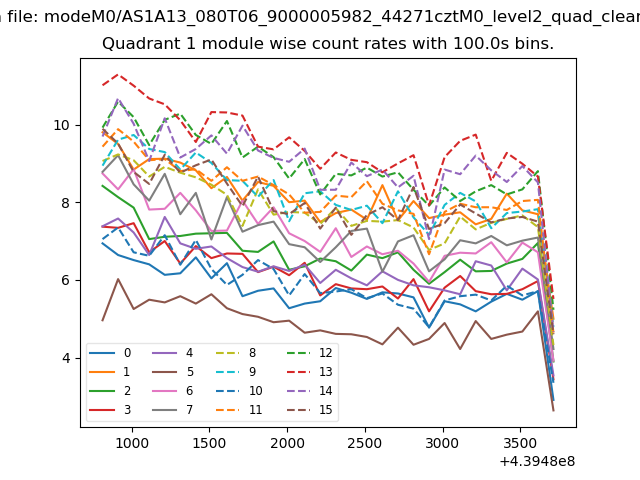
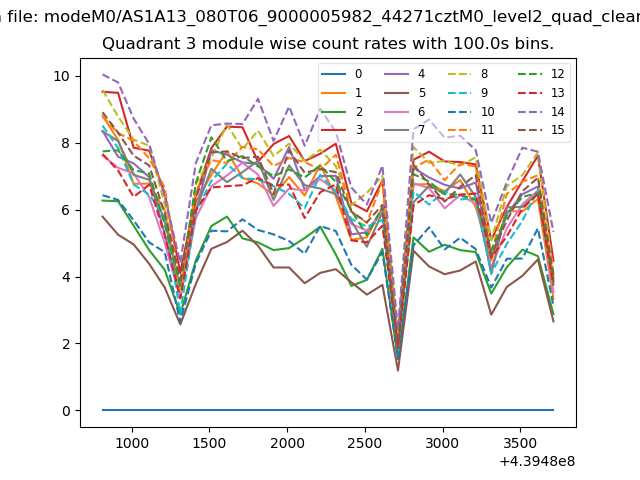
| Module-wise count rates for Quadrant A Data is divided into 100 sec bins |
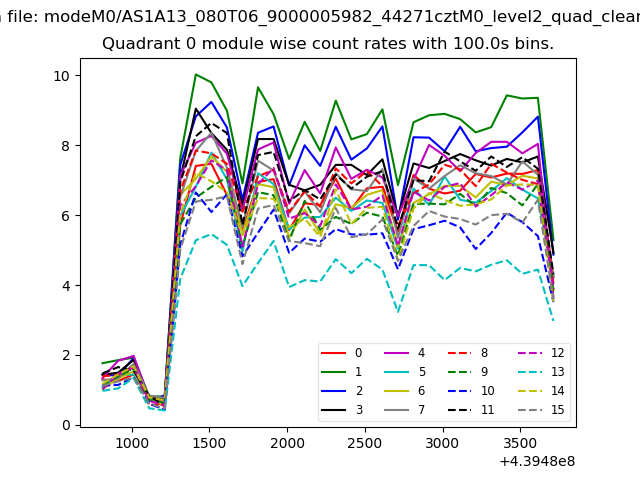 |
 |
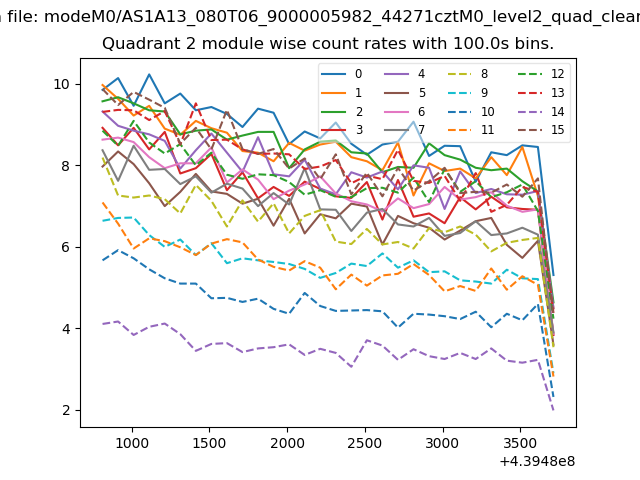
| Module-wise count rates for Quadrant B Data is divided into 100 sec bins |
 |
 |
| Module-wise count rates for Quadrant C Data is divided into 100 sec bins |
 |
 |
| Module-wise count rates for Quadrant D Data is divided into 100 sec bins |
 |
 |
| Parameter | Plot |
|---|---|
| CZT HV Monitor | 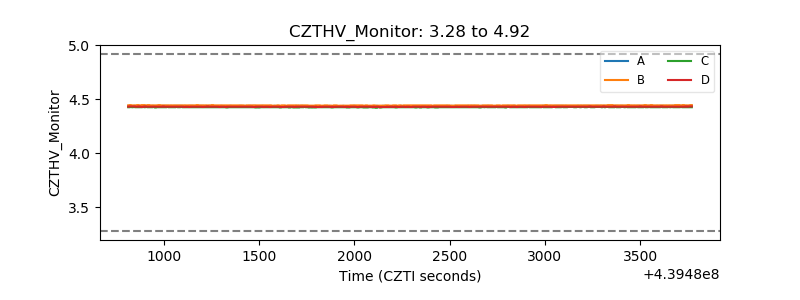 |
| D_VDD | 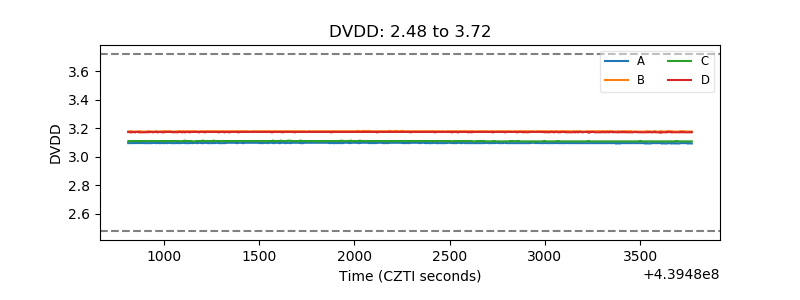 |
| Temperature 1 | 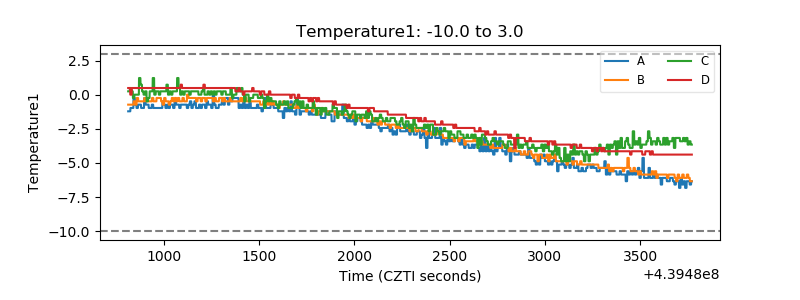 |
| Veto HV Monitor | 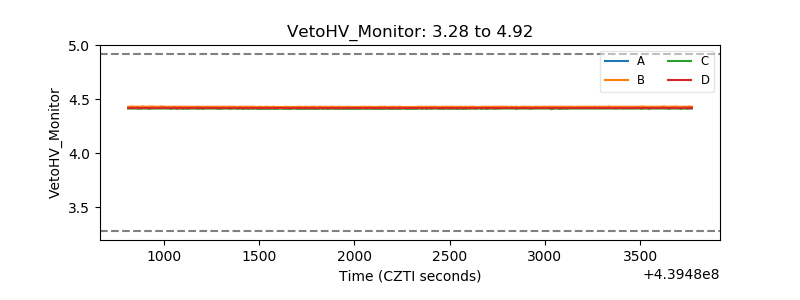 |
| Veto LLD | 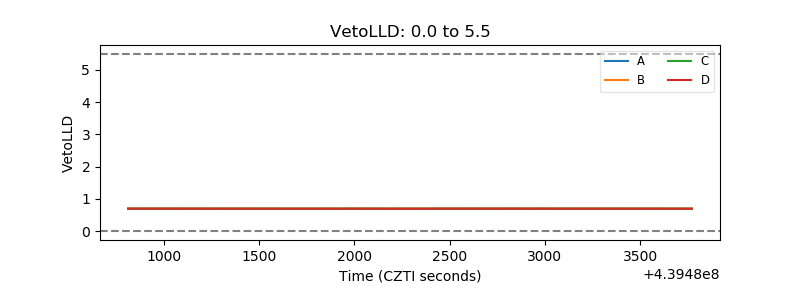 |
| Alpha Counter | 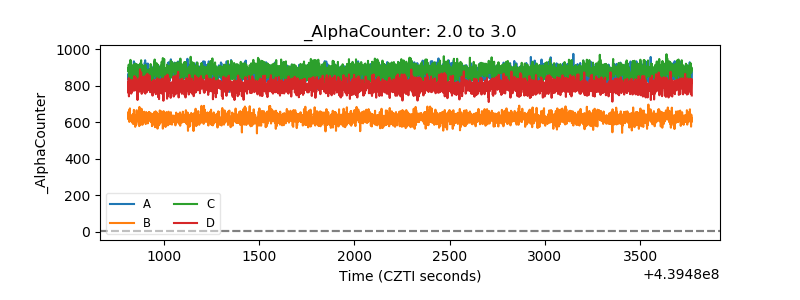 |
| _CPM_Rate | 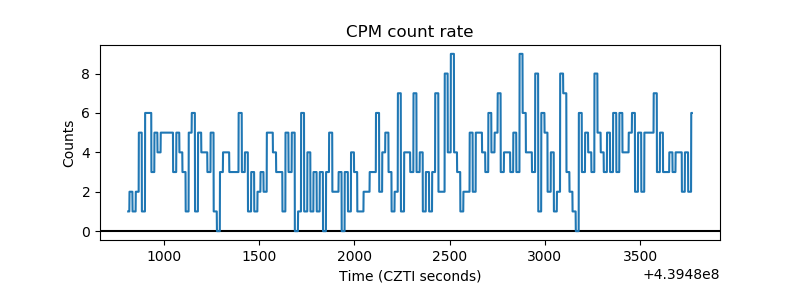 |
| CZT Counter | 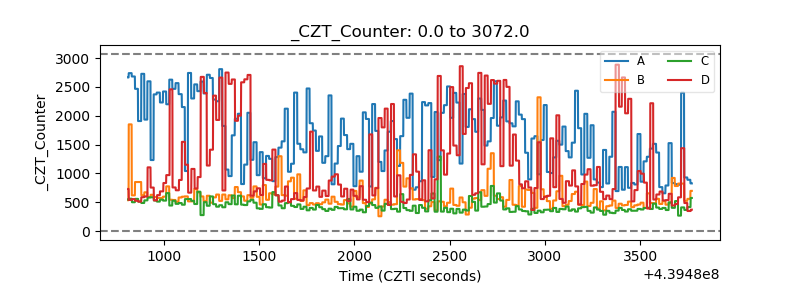 |
| +2.5 Volts monitor | 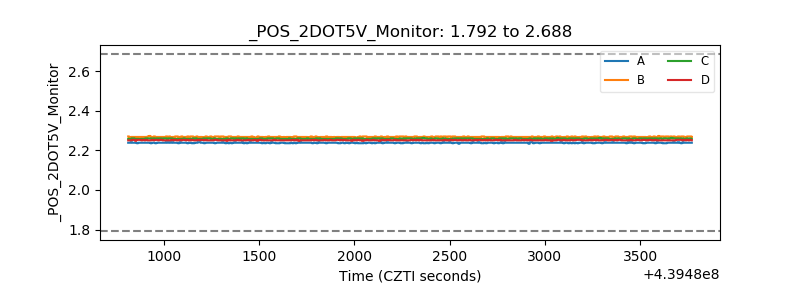 |
| +5 Volts monitor | 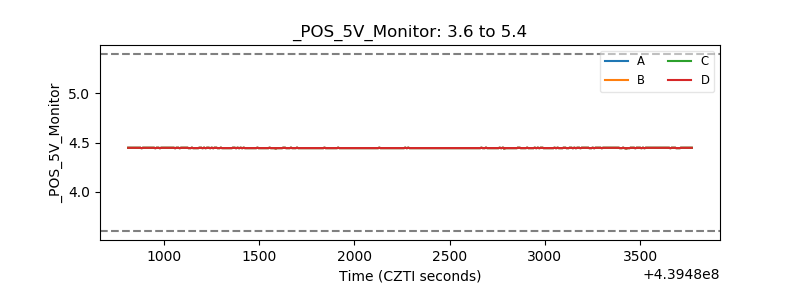 |
| _ROLL_ROT | 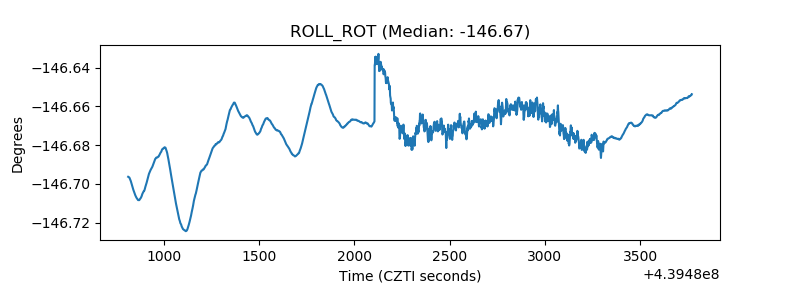 |
| _Roll_DEC | 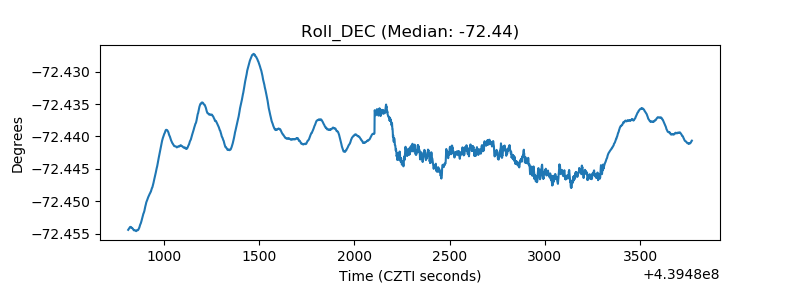 |
| _Roll_RA | 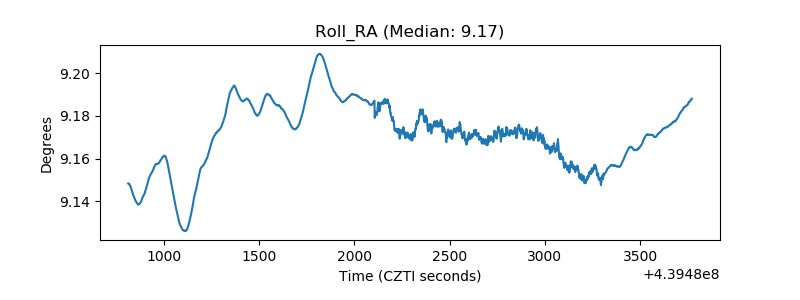 |
| Veto Counter | 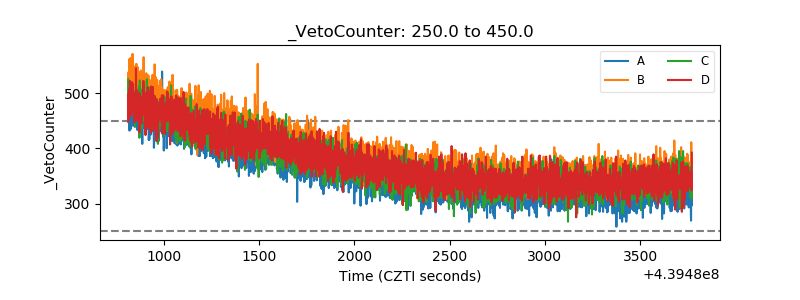 |