| Param | Original file | Final file |
|---|---|---|
| Filename | modeM0/AS1A13_059T01_9000005990_44320cztM0_level2.fits | modeM0/AS1A13_059T01_9000005990_44320cztM0_level2_quad_clean.evt |
| Size (bytes) | 661,893,120 | 136,218,240 |
| Size | 631.2 MB | 129.9 MB |
| Events in quadrant A | 5,984,479 | 944,926 |
| Events in quadrant B | 5,553,465 | 906,575 |
| Events in quadrant C | 4,103,676 | 926,202 |
| Events in quadrant D | 8,189,951 | 746,953 |
| Mode M0 | |||
|---|---|---|---|
| Quadrant | BADHDUFLAG | Total packets | Discarded packets |
| A | 0 | 24468 | 0 |
| B | 0 | 22552 | 0 |
| C | 0 | 18613 | 0 |
| D | 0 | 30456 | 1 |
| Mode SS | |||
|---|---|---|---|
| Quadrant | BADHDUFLAG | Total packets | Discarded packets |
| A | 0 | 172 | 0 |
| B | 0 | 172 | 0 |
| C | 0 | 172 | 0 |
| D | 0 | 172 | 0 |
| Quadrant | Total seconds | Saturated seconds | Saturation percentage |
|---|---|---|---|
| A | 8638 | 92 | 1.065061% |
| B | 8639 | 575 | 6.655863% |
| C | 8639 | 48 | 0.555620% |
| D | 8638 | 1228 | 14.216254% |
Noise dominated data is calculated using 1-second bins in cleaned event files. If a bin has >2000 counts, and if more than 50% of those come from <1% of pixels, then it is considered to be noise-dominated and hence unusable.
| Quadrant | # 1 sec bins | Bins with >0 counts | Bins with >2000 counts | High rate bins dominated by noise | Noise dominated (total time) | Noise dominated (detector-on time) | Marked lightcurve |
|---|---|---|---|---|---|---|---|
| A | 8638 | 8638 | 13 | 13 | 0.15% | 0.15% | 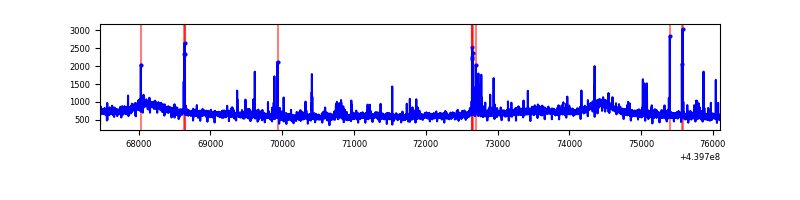 |
| B | 8639 | 8639 | 390 | 390 | 4.51% | 4.51% | 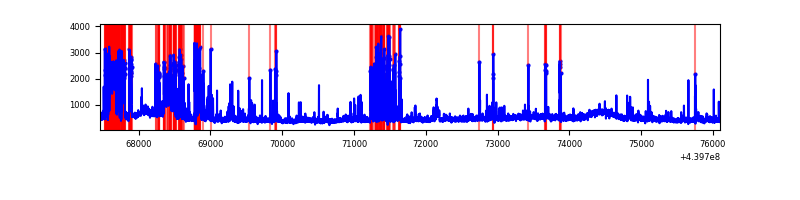 |
| C | 8639 | 8639 | 21 | 21 | 0.24% | 0.24% | 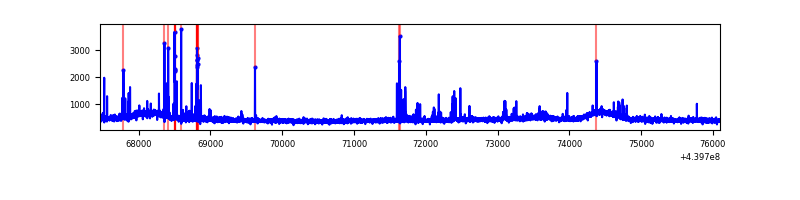 |
| D | 8638 | 8638 | 954 | 954 | 11.04% | 11.04% | 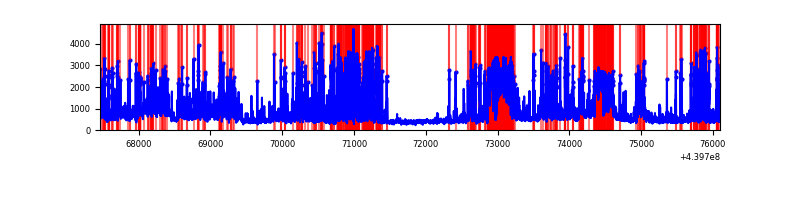 |
Top three noisy pixels from each quadrant. If the there are fewer than three noisy pixels in the level2.evt file, extra rows are filled as -1
| Pixel properties | Quadrant properties | ||||||
|---|---|---|---|---|---|---|---|
| Quadrant | DetID | PixID | Counts | Sigma | Mean | Median | Sigma |
| A | 10 | 83 | 1896897 | 9090.53 | 999 | 975 | 208.6 |
| A | 7 | 3 | 129854 | 617.95 | 999 | 975 | 208.6 |
| A | 0 | 243 | 33332 | 155.14 | 999 | 975 | 208.6 |
| B | 5 | 172 | 1083735 | 5637.41 | 966 | 933 | 192.1 |
| B | 5 | 255 | 449749 | 2336.68 | 966 | 933 | 192.1 |
| B | 4 | 158 | 42283 | 215.28 | 966 | 933 | 192.1 |
| C | 14 | 254 | 164458 | 708.61 | 982 | 988 | 230.7 |
| C | 15 | 208 | 40060 | 169.37 | 982 | 988 | 230.7 |
| C | 3 | 233 | 32280 | 135.64 | 982 | 988 | 230.7 |
| D | 13 | 249 | 1629711 | 7020.92 | 925 | 897 | 232.0 |
| D | 13 | 138 | 807851 | 3478.33 | 925 | 897 | 232.0 |
| D | 1 | 52 | 380552 | 1636.48 | 925 | 897 | 232.0 |
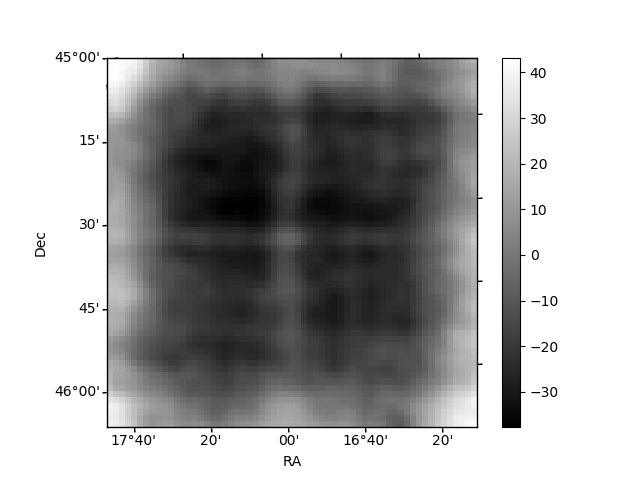
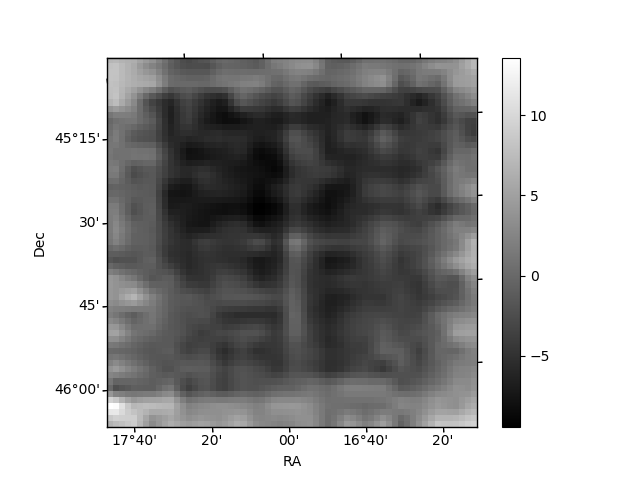
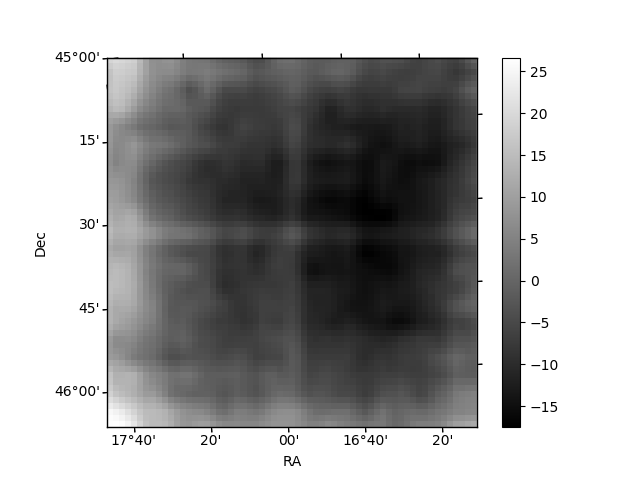
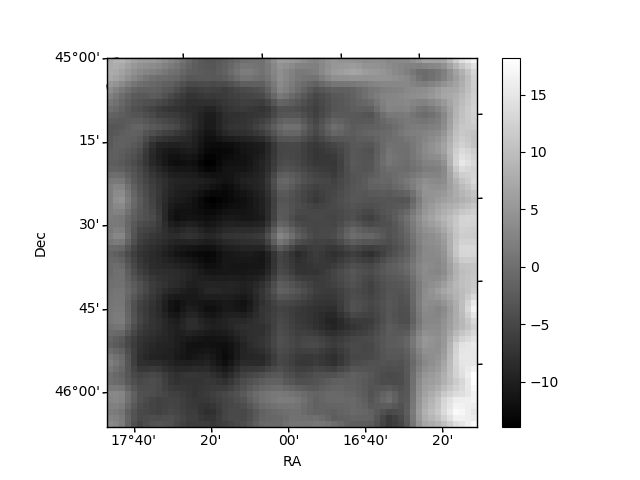
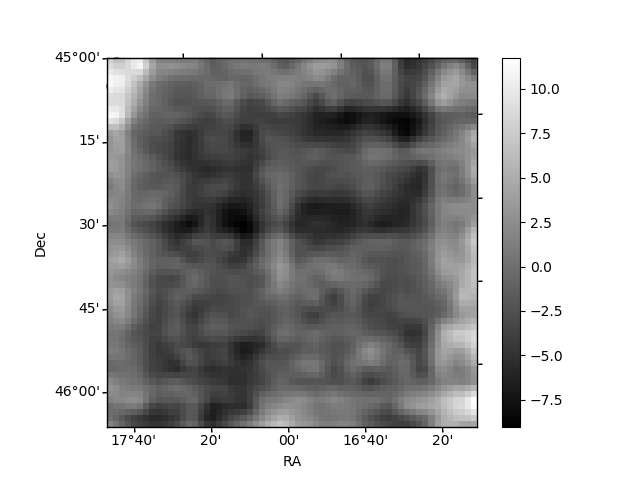
Histogram calculated using DETX and DETY for each event in the final _common_clean file
| Quadrant A | 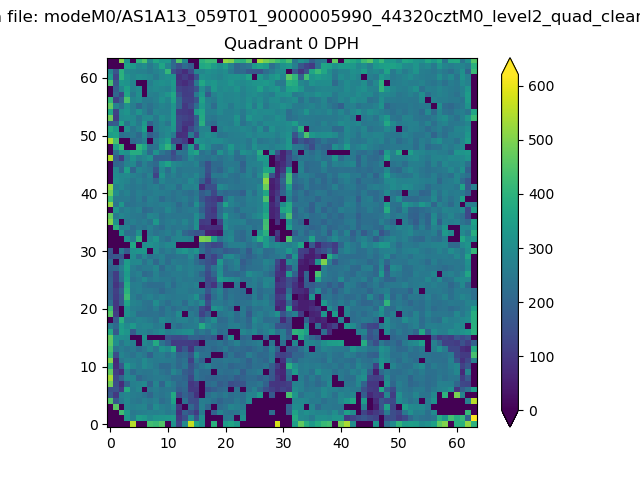 |
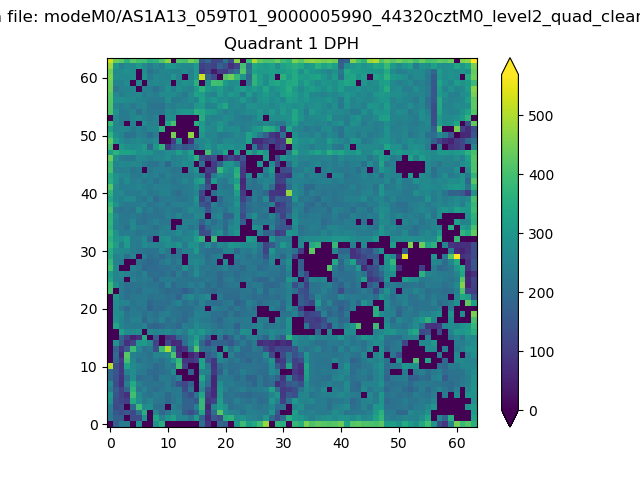 |
Quadrant B |
|---|---|---|---|
| Quadrant D | 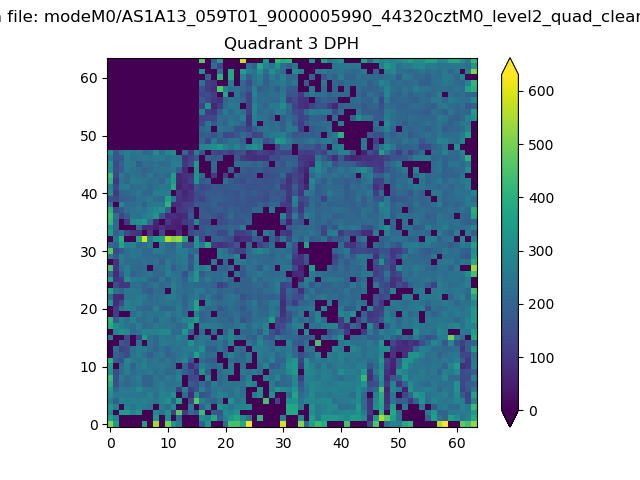 |
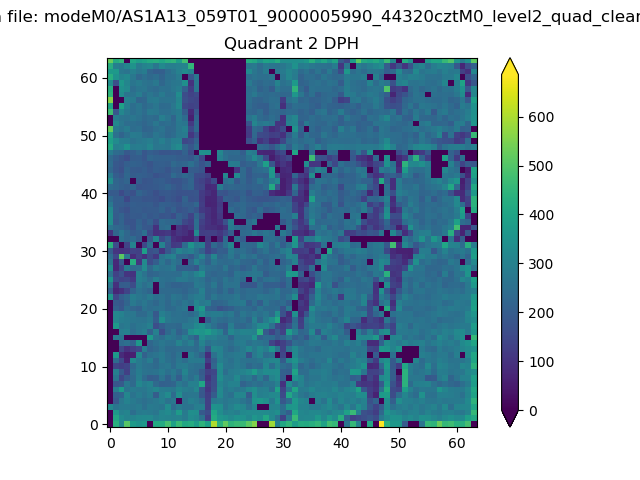 |
Quadrant C |
| Plot type | Count rate plots | Images |
|---|---|---|
| Comparison with Poisson distribution Blue bars denote a histogram of data divided into 1 sec bins. Red curve is a Poisson curve with rate = median count rate of data. |
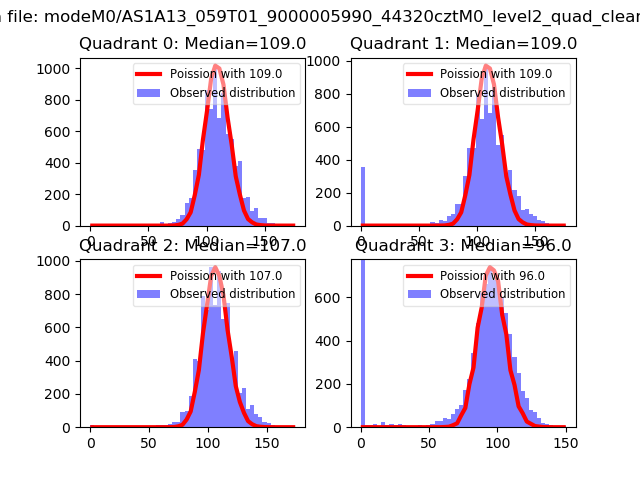 |
 |
| Quadrant-wise count rates Data is divided into 100 sec bins |
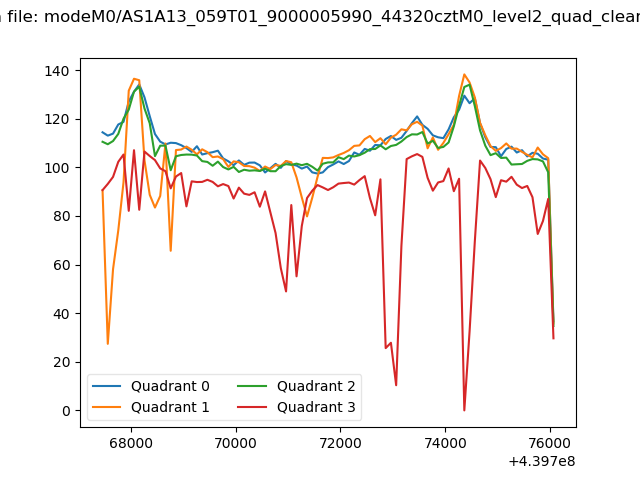 |
|
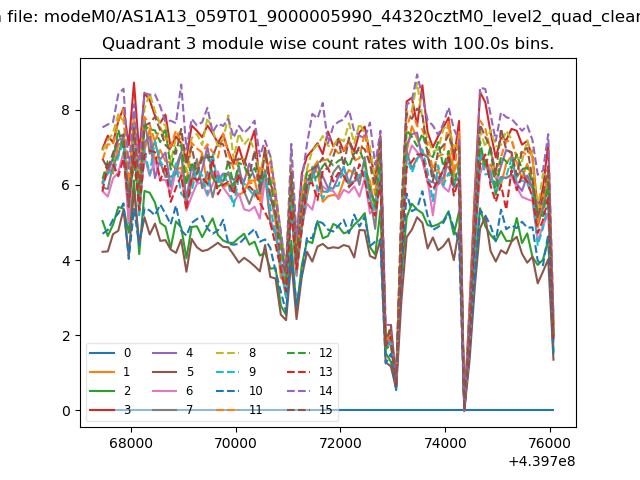
| Module-wise count rates for Quadrant A Data is divided into 100 sec bins |
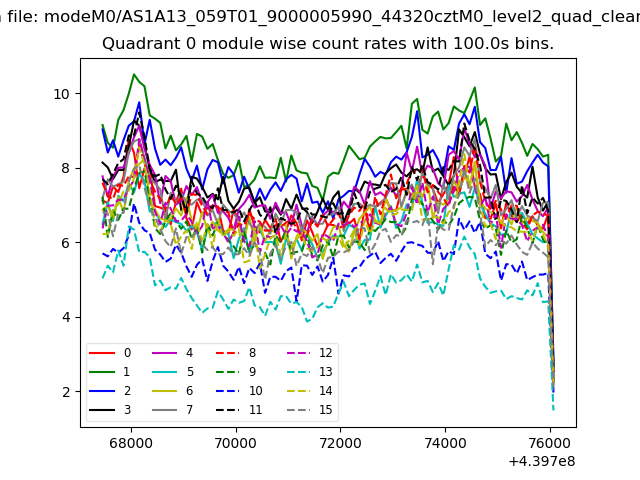 |
 |
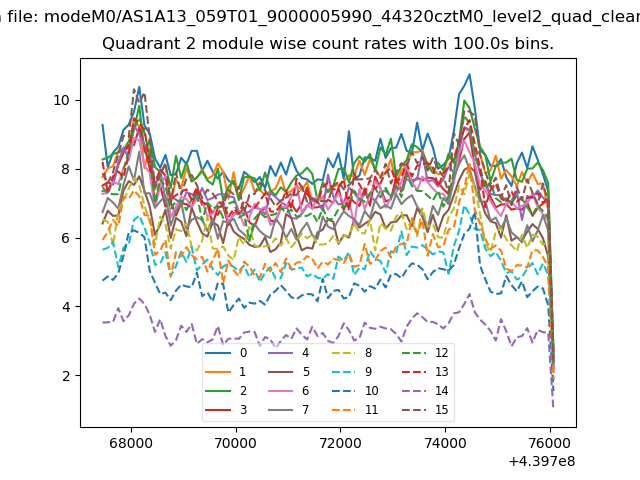
| Module-wise count rates for Quadrant B Data is divided into 100 sec bins |
 |
 |
| Module-wise count rates for Quadrant C Data is divided into 100 sec bins |
 |
 |
| Module-wise count rates for Quadrant D Data is divided into 100 sec bins |
 |
 |
| Parameter | Plot |
|---|---|
| CZT HV Monitor |  |
| D_VDD | 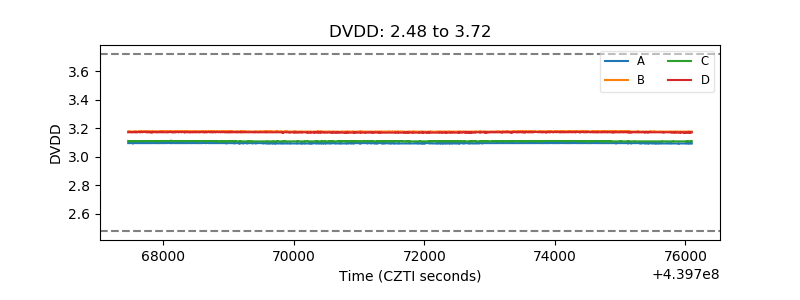 |
| Temperature 1 | 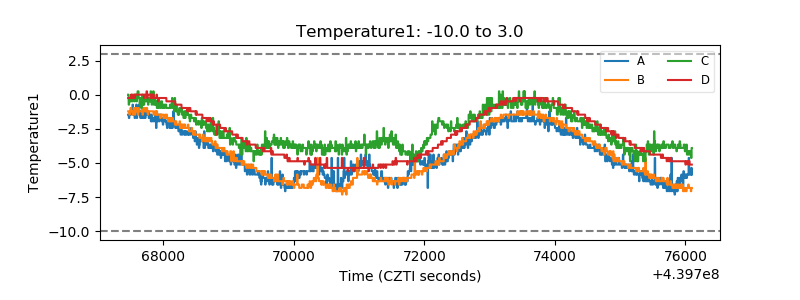 |
| Veto HV Monitor | 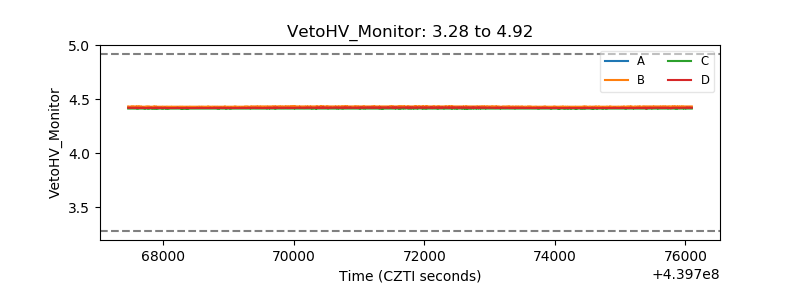 |
| Veto LLD | 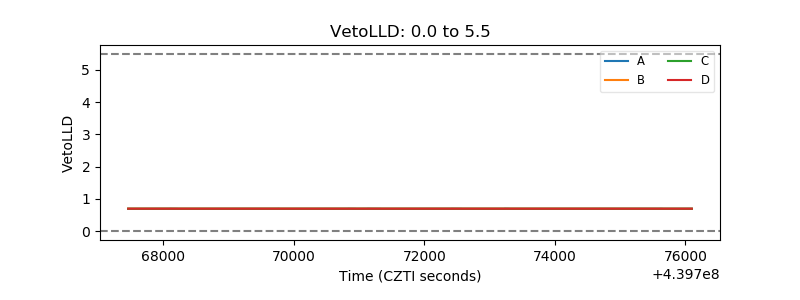 |
| Alpha Counter | 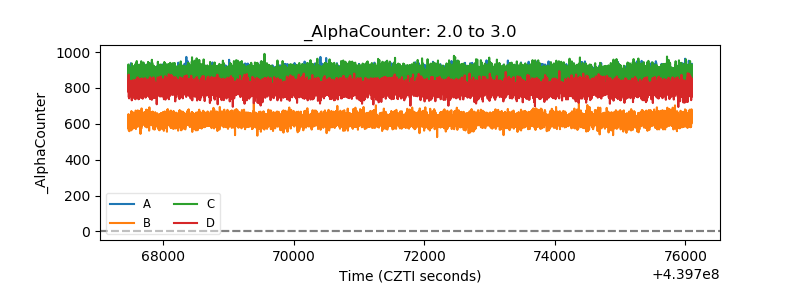 |
| _CPM_Rate | 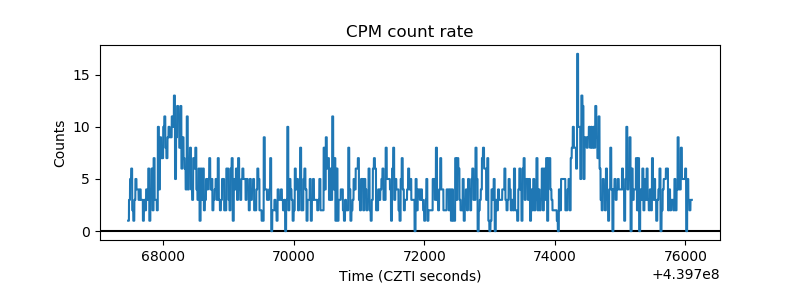 |
| CZT Counter | 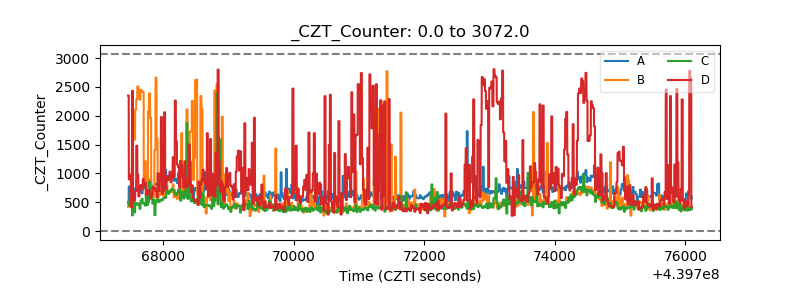 |
| +2.5 Volts monitor | 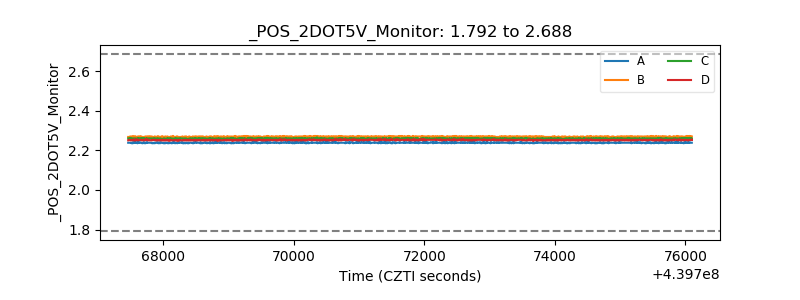 |
| +5 Volts monitor | 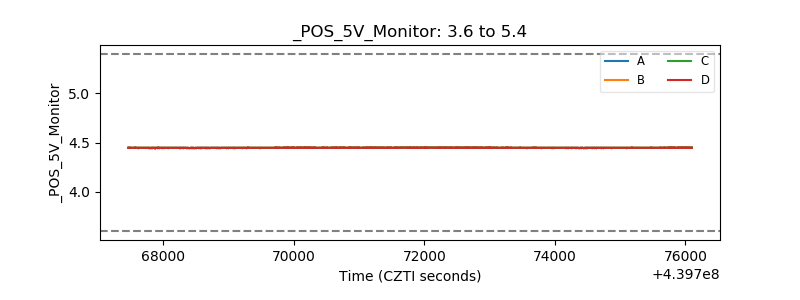 |
| _ROLL_ROT | 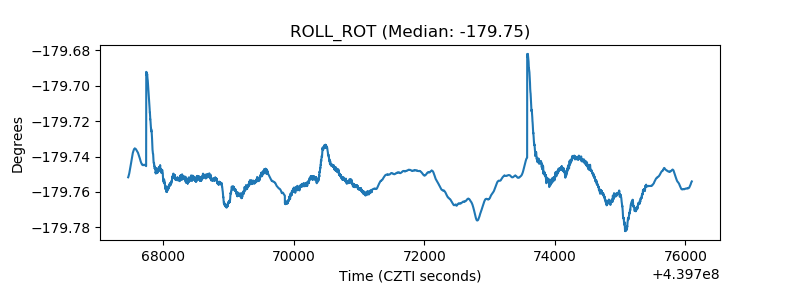 |
| _Roll_DEC | 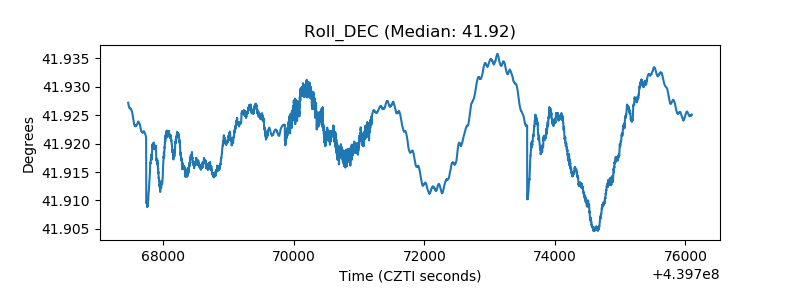 |
| _Roll_RA | 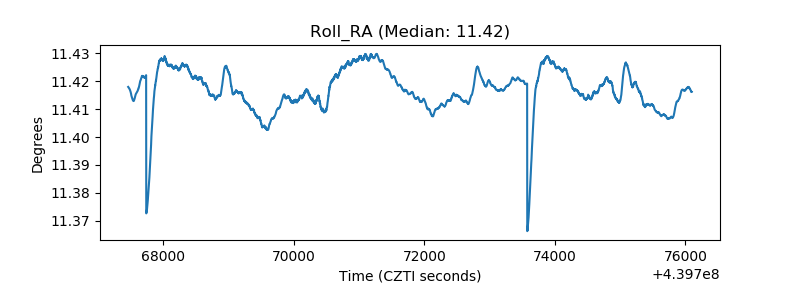 |
| Veto Counter | 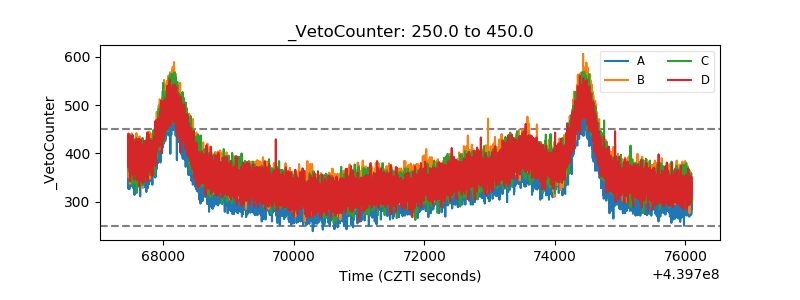 |