| Param | Original file | Final file |
|---|---|---|
| Filename | modeM0/AS1A13_059T01_9000005990_44494cztM0_level2.fits | modeM0/AS1A13_059T01_9000005990_44494cztM0_level2_quad_clean.evt |
| Size (bytes) | 167,149,440 | 30,648,960 |
| Size | 159.4 MB | 29.2 MB |
| Events in quadrant A | 1,601,575 | 205,080 |
| Events in quadrant B | 1,623,032 | 196,600 |
| Events in quadrant C | 1,313,556 | 201,892 |
| Events in quadrant D | 1,498,093 | 184,913 |
| Mode M0 | |||
|---|---|---|---|
| Quadrant | BADHDUFLAG | Total packets | Discarded packets |
| A | 0 | 6256 | 0 |
| B | 0 | 6097 | 0 |
| C | 0 | 5170 | 1 |
| D | 0 | 5750 | 0 |
| Mode SS | |||
|---|---|---|---|
| Quadrant | BADHDUFLAG | Total packets | Discarded packets |
| A | 0 | 38 | 0 |
| B | 0 | 38 | 0 |
| C | 0 | 38 | 0 |
| D | 0 | 38 | 0 |
| Quadrant | Total seconds | Saturated seconds | Saturation percentage |
|---|---|---|---|
| A | 1917 | 131 | 6.833594% |
| B | 1917 | 293 | 15.284298% |
| C | 1916 | 73 | 3.810021% |
| D | 1916 | 120 | 6.263048% |
Noise dominated data is calculated using 1-second bins in cleaned event files. If a bin has >2000 counts, and if more than 50% of those come from <1% of pixels, then it is considered to be noise-dominated and hence unusable.
| Quadrant | # 1 sec bins | Bins with >0 counts | Bins with >2000 counts | High rate bins dominated by noise | Noise dominated (total time) | Noise dominated (detector-on time) | Marked lightcurve |
|---|---|---|---|---|---|---|---|
| A | 1917 | 1917 | 27 | 27 | 1.41% | 1.41% | 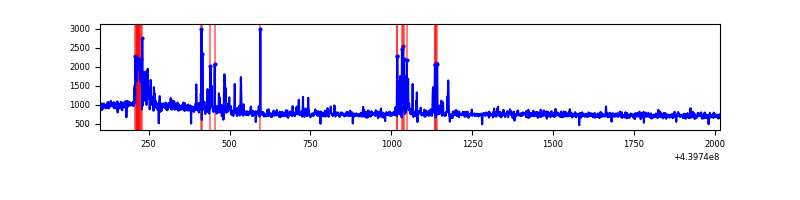 |
| B | 1917 | 1917 | 145 | 145 | 7.56% | 7.56% | 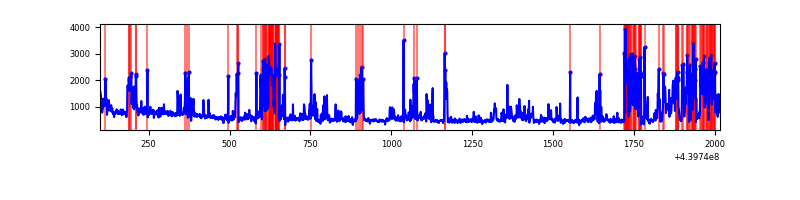 |
| C | 1916 | 1916 | 20 | 20 | 1.04% | 1.04% | 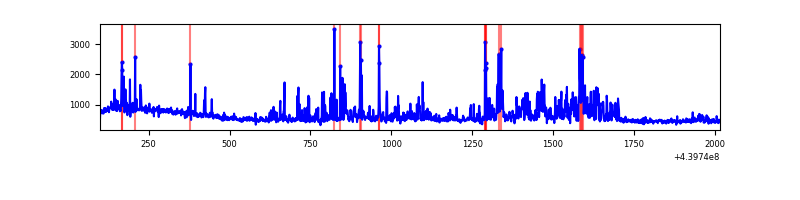 |
| D | 1916 | 1916 | 72 | 72 | 3.76% | 3.76% | 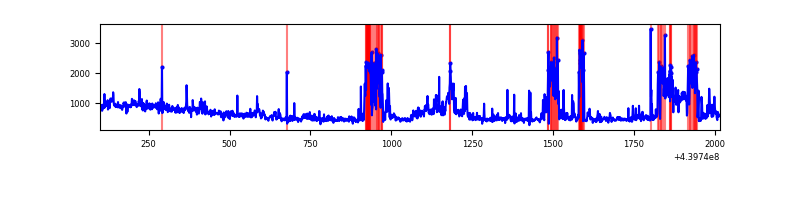 |
Top three noisy pixels from each quadrant. If the there are fewer than three noisy pixels in the level2.evt file, extra rows are filled as -1
| Pixel properties | Quadrant properties | ||||||
|---|---|---|---|---|---|---|---|
| Quadrant | DetID | PixID | Counts | Sigma | Mean | Median | Sigma |
| A | 10 | 83 | 512248 | 9359.99 | 248 | 241 | 54.7 |
| A | 13 | 248 | 128568 | 2345.94 | 248 | 241 | 54.7 |
| A | 10 | 255 | 3600 | 61.41 | 248 | 241 | 54.7 |
| B | 5 | 235 | 511985 | 10154.41 | 237 | 229 | 50.4 |
| B | 5 | 172 | 160378 | 3177.72 | 237 | 229 | 50.4 |
| B | 0 | 155 | 10649 | 206.76 | 237 | 229 | 50.4 |
| C | 3 | 233 | 153219 | 2537.69 | 246 | 246 | 60.3 |
| C | 15 | 158 | 130690 | 2163.95 | 246 | 246 | 60.3 |
| C | 14 | 254 | 40438 | 666.75 | 246 | 246 | 60.3 |
| D | 1 | 52 | 216945 | 3373.35 | 248 | 239 | 64.2 |
| D | 4 | 221 | 149879 | 2329.37 | 248 | 239 | 64.2 |
| D | 2 | 249 | 83673 | 1298.78 | 248 | 239 | 64.2 |
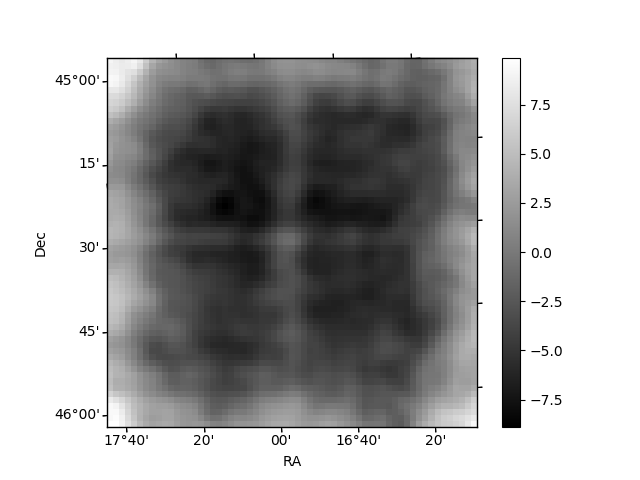
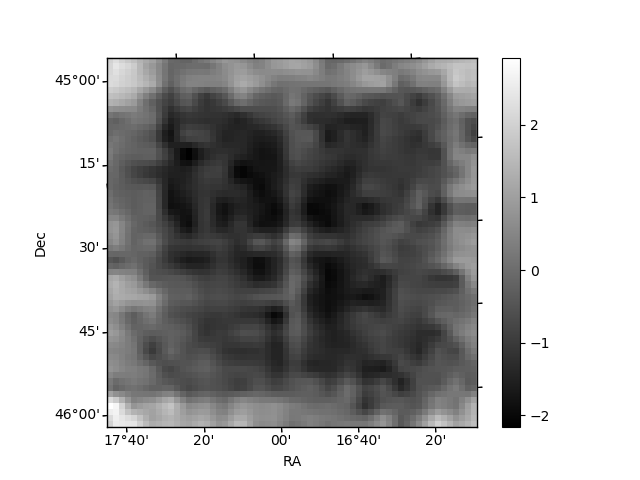
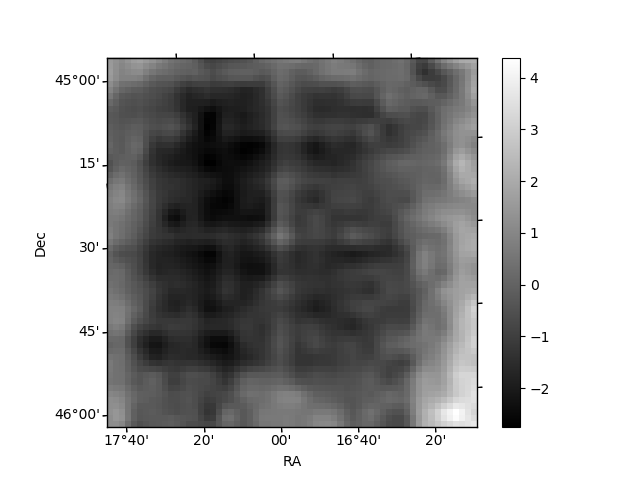
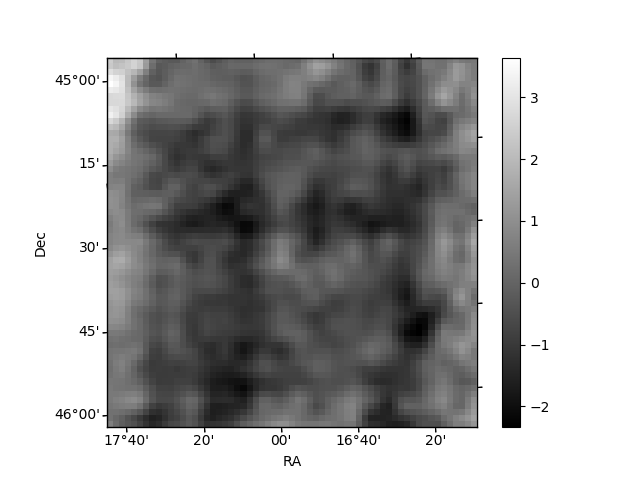
Histogram calculated using DETX and DETY for each event in the final _common_clean file
| Quadrant A | 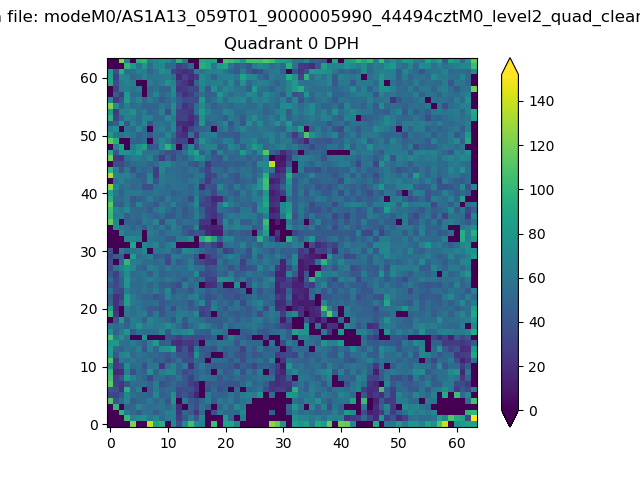 |
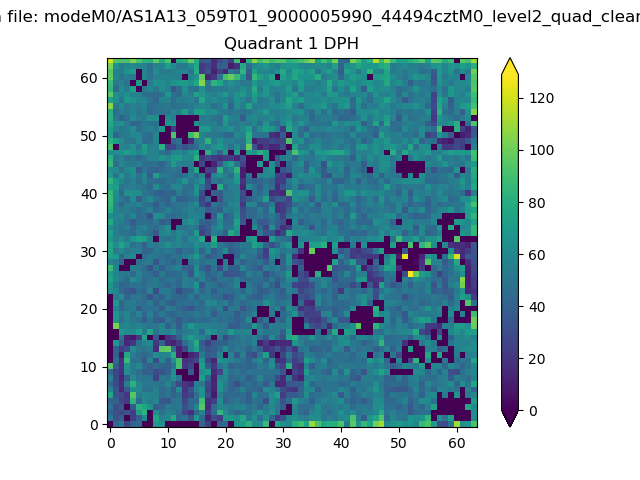 |
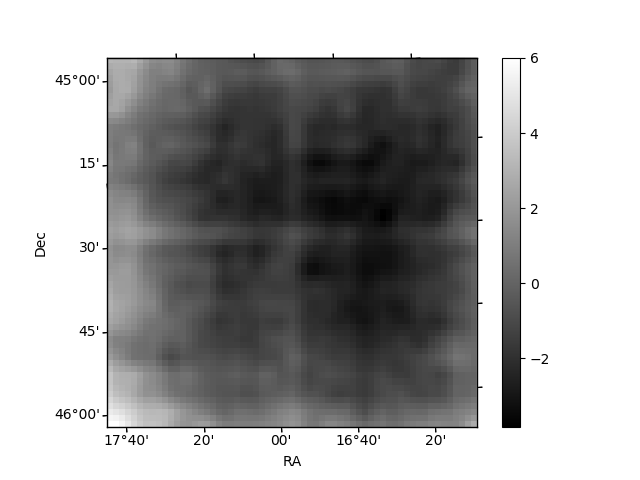
Quadrant B |
|---|---|---|---|
| Quadrant D | 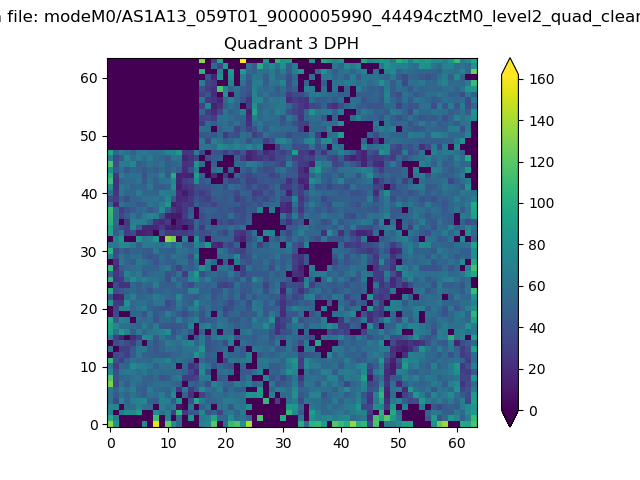 |
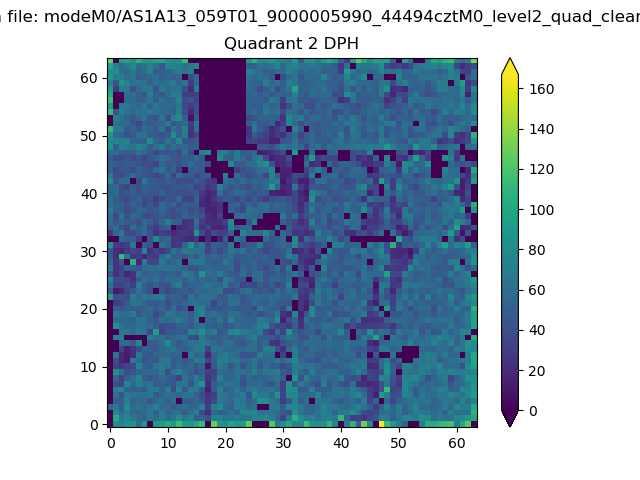 |
Quadrant C |
| Plot type | Count rate plots | Images |
|---|---|---|
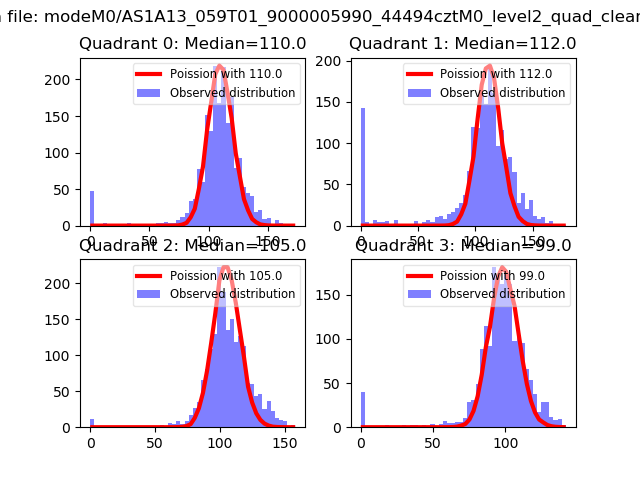
| Comparison with Poisson distribution Blue bars denote a histogram of data divided into 1 sec bins. Red curve is a Poisson curve with rate = median count rate of data. |
 |
 |
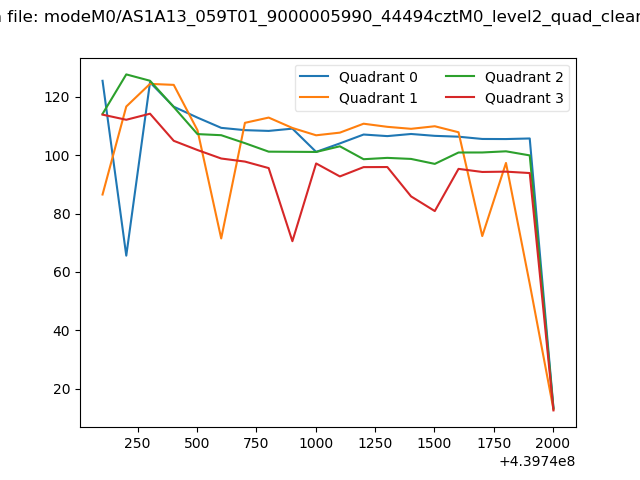
| Quadrant-wise count rates Data is divided into 100 sec bins |
 |
|
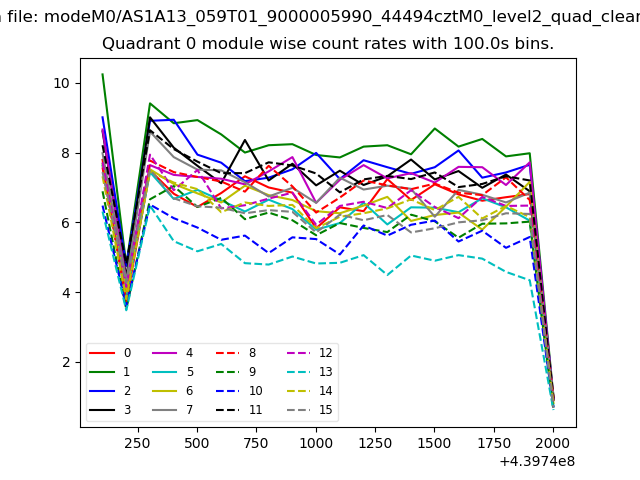
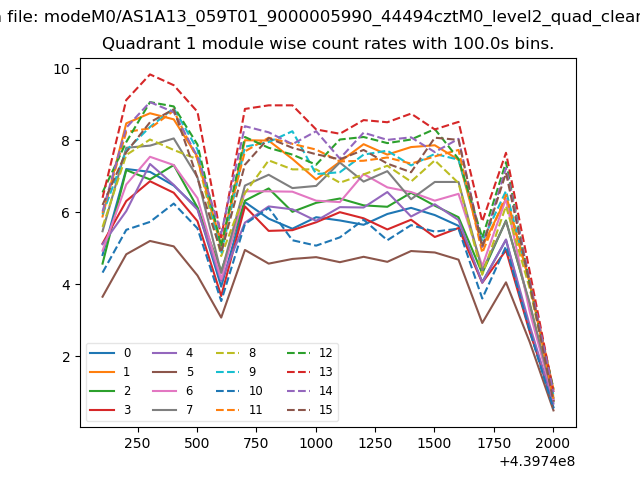
| Module-wise count rates for Quadrant A Data is divided into 100 sec bins |
 |
 |
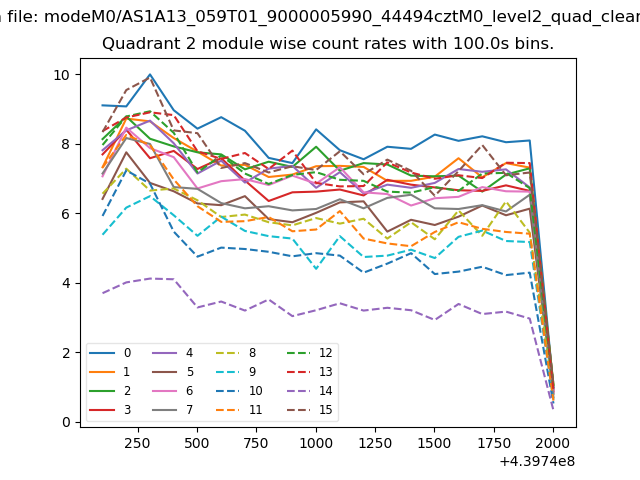
| Module-wise count rates for Quadrant B Data is divided into 100 sec bins |
 |
 |
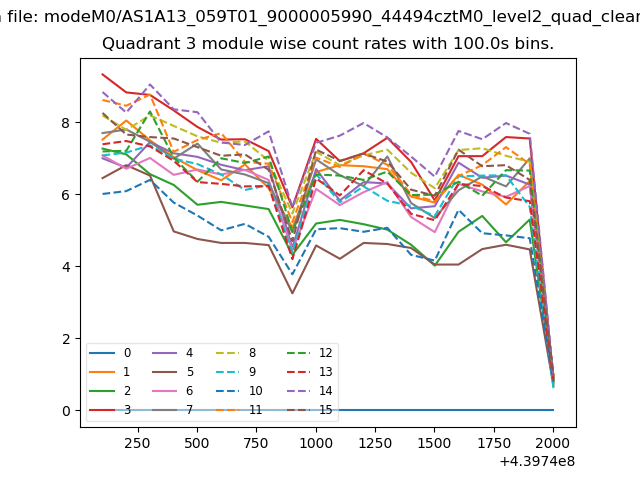
| Module-wise count rates for Quadrant C Data is divided into 100 sec bins |
 |
 |
| Module-wise count rates for Quadrant D Data is divided into 100 sec bins |
 |
 |
| Parameter | Plot |
|---|---|
| CZT HV Monitor | 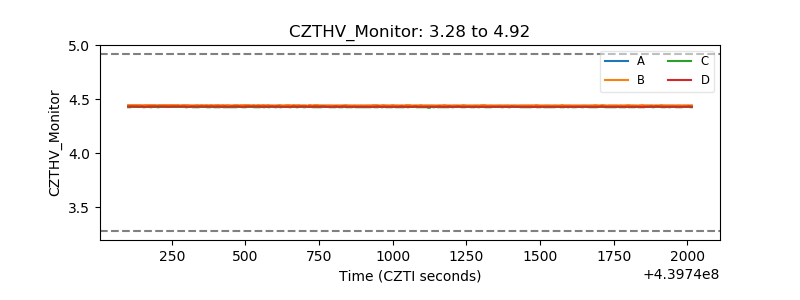 |
| D_VDD | 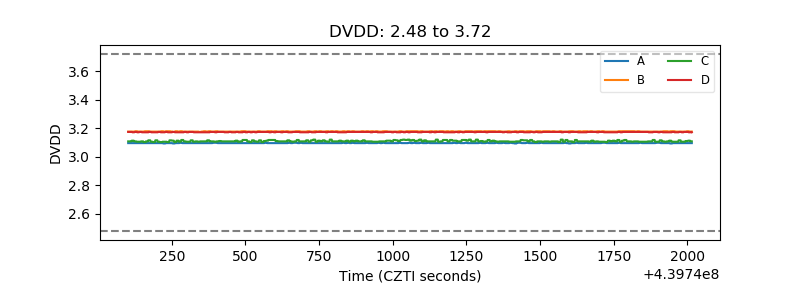 |
| Temperature 1 | 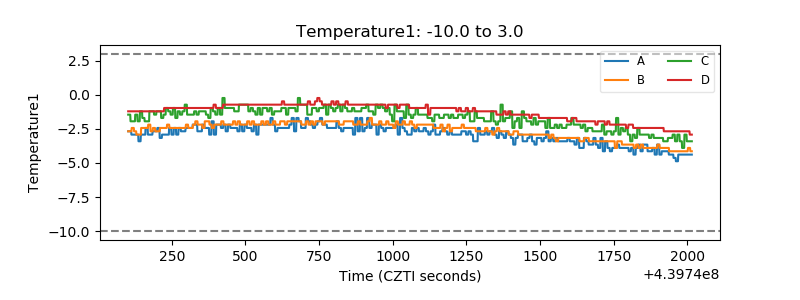 |
| Veto HV Monitor |  |
| Veto LLD | 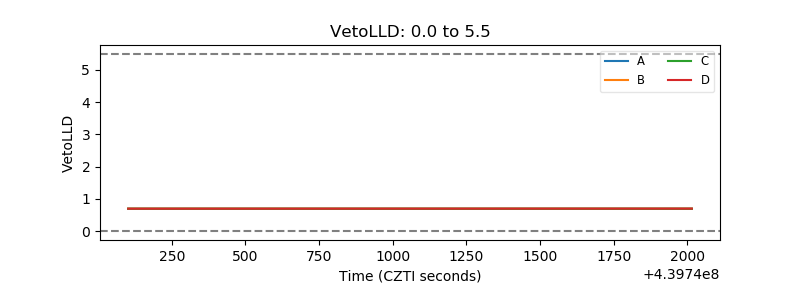 |
| Alpha Counter | 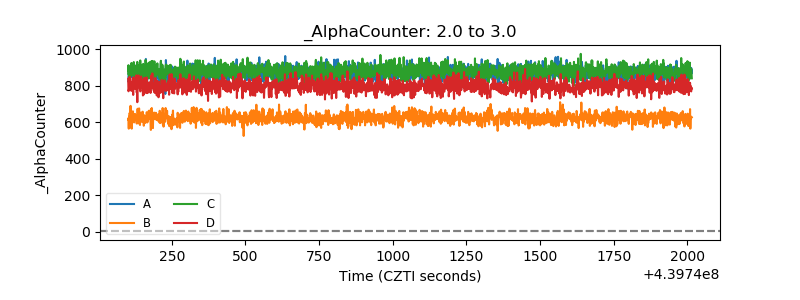 |
| _CPM_Rate | 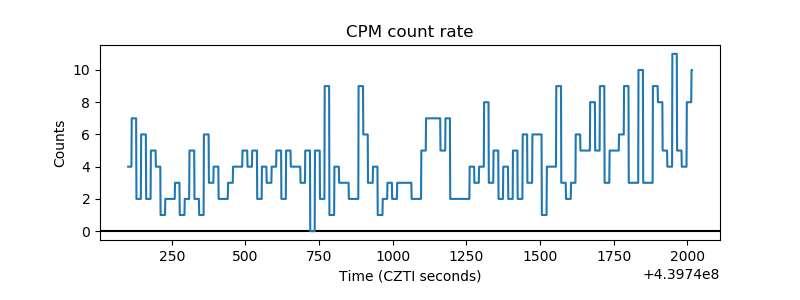 |
| CZT Counter | 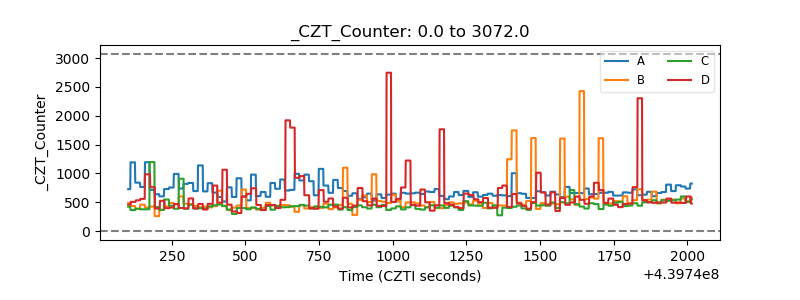 |
| +2.5 Volts monitor | 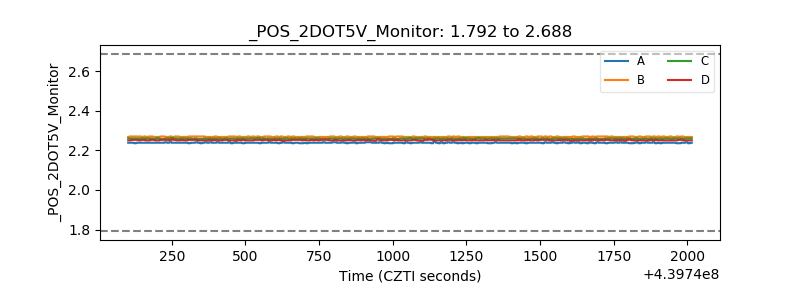 |
| +5 Volts monitor | 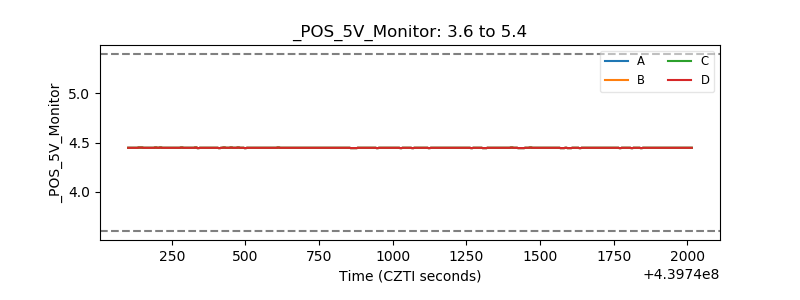 |
| _ROLL_ROT | 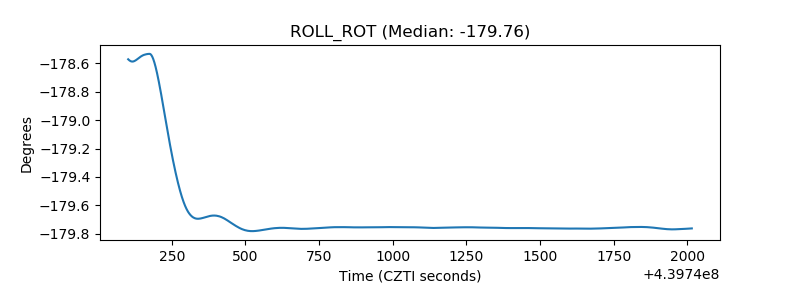 |
| _Roll_DEC | 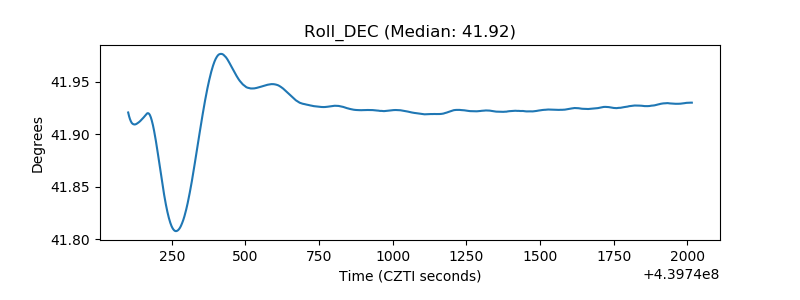 |
| _Roll_RA | 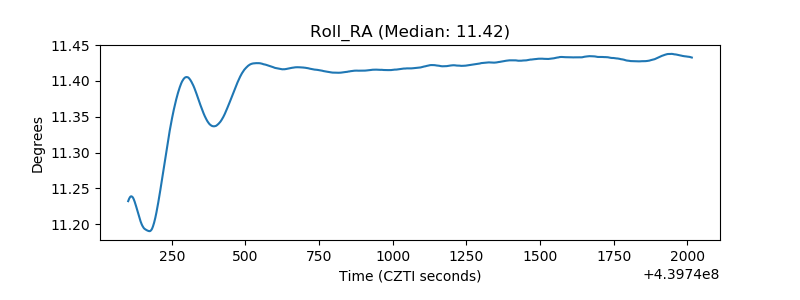 |
| Veto Counter | 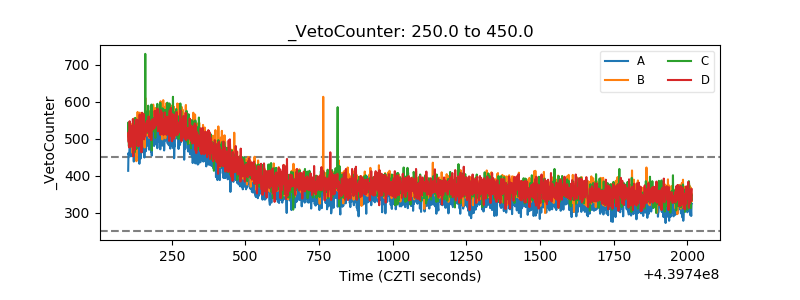 |