| Param | Original file | Final file |
|---|---|---|
| Filename | modeM0/AS1A13_072T03_9000006000_44448cztM0_level2.fits | modeM0/AS1A13_072T03_9000006000_44448cztM0_level2_quad_clean.evt |
| Size (bytes) | 506,963,520 | 115,404,480 |
| Size | 483.5 MB | 110.1 MB |
| Events in quadrant A | 5,241,824 | 770,114 |
| Events in quadrant B | 3,700,469 | 788,204 |
| Events in quadrant C | 3,634,469 | 763,587 |
| Events in quadrant D | 5,617,597 | 659,970 |
| Mode SS | |||
|---|---|---|---|
| Quadrant | BADHDUFLAG | Total packets | Discarded packets |
| A | 0 | 150 | 0 |
| B | 0 | 150 | 0 |
| C | 0 | 150 | 0 |
| D | 0 | 150 | 0 |
| Mode M9 | |||
|---|---|---|---|
| Quadrant | BADHDUFLAG | Total packets | Discarded packets |
| A | 0 | 5 | 0 |
| B | 0 | 6 | 0 |
| C | 0 | 6 | 0 |
| D | 0 | 6 | 0 |
| Mode M0 | |||
|---|---|---|---|
| Quadrant | BADHDUFLAG | Total packets | Discarded packets |
| A | 0 | 22065 | 2 |
| B | 0 | 16021 | 2 |
| C | 0 | 15922 | 2 |
| D | 0 | 21727 | 2 |
| Quadrant | Total seconds | Saturated seconds | Saturation percentage |
|---|---|---|---|
| A | 7357 | 343 | 4.662226% |
| B | 7357 | 343 | 4.662226% |
| C | 7357 | 225 | 3.058312% |
| D | 7357 | 671 | 9.120565% |
Noise dominated data is calculated using 1-second bins in cleaned event files. If a bin has >2000 counts, and if more than 50% of those come from <1% of pixels, then it is considered to be noise-dominated and hence unusable.
| Quadrant | # 1 sec bins | Bins with >0 counts | Bins with >2000 counts | High rate bins dominated by noise | Noise dominated (total time) | Noise dominated (detector-on time) | Marked lightcurve |
|---|---|---|---|---|---|---|---|
| A | 7767 | 7358 | 0 | 0 | 0.00% | 0.00% | 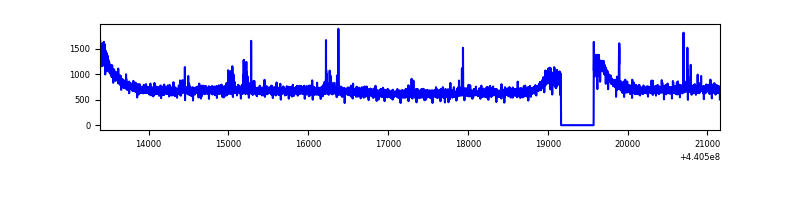 |
| B | 7767 | 7358 | 23 | 23 | 0.30% | 0.31% | 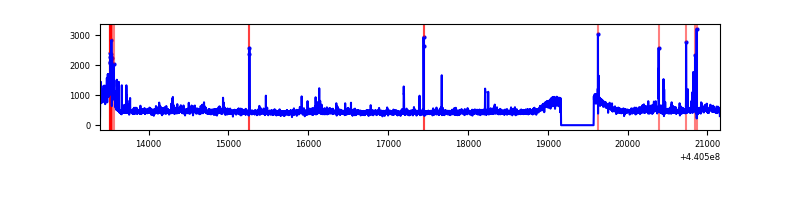 |
| C | 7767 | 7358 | 11 | 11 | 0.14% | 0.15% | 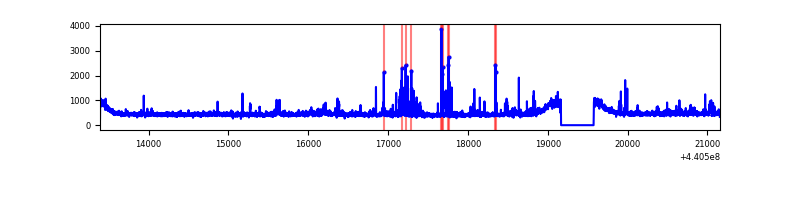 |
| D | 7767 | 7358 | 349 | 349 | 4.49% | 4.74% | 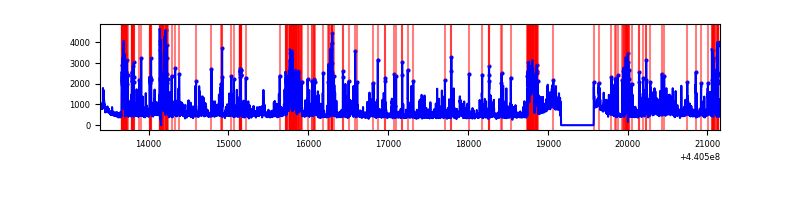 |
Top three noisy pixels from each quadrant. If the there are fewer than three noisy pixels in the level2.evt file, extra rows are filled as -1
| Pixel properties | Quadrant properties | ||||||
|---|---|---|---|---|---|---|---|
| Quadrant | DetID | PixID | Counts | Sigma | Mean | Median | Sigma |
| A | 10 | 83 | 1863241 | 10325.78 | 861 | 840 | 180.4 |
| A | 10 | 248 | 48140 | 262.25 | 861 | 840 | 180.4 |
| A | 3 | 137 | 9836 | 49.88 | 861 | 840 | 180.4 |
| B | 5 | 172 | 179974 | 1059.4 | 852 | 825 | 169.1 |
| B | 0 | 155 | 66119 | 386.12 | 852 | 825 | 169.1 |
| B | 0 | 229 | 44098 | 255.9 | 852 | 825 | 169.1 |
| C | 2 | 14 | 104850 | 516.4 | 853 | 858 | 201.4 |
| C | 3 | 233 | 86231 | 423.94 | 853 | 858 | 201.4 |
| C | 14 | 254 | 73356 | 360.01 | 853 | 858 | 201.4 |
| D | 2 | 249 | 816726 | 3928.71 | 830 | 806 | 207.7 |
| D | 1 | 52 | 532768 | 2561.43 | 830 | 806 | 207.7 |
| D | 13 | 249 | 341679 | 1641.33 | 830 | 806 | 207.7 |
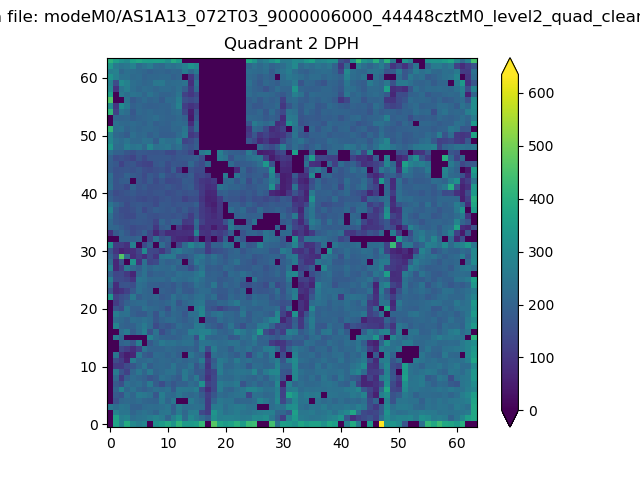
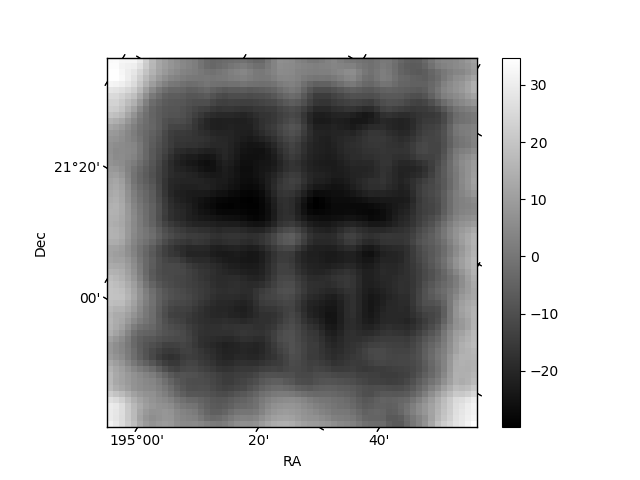
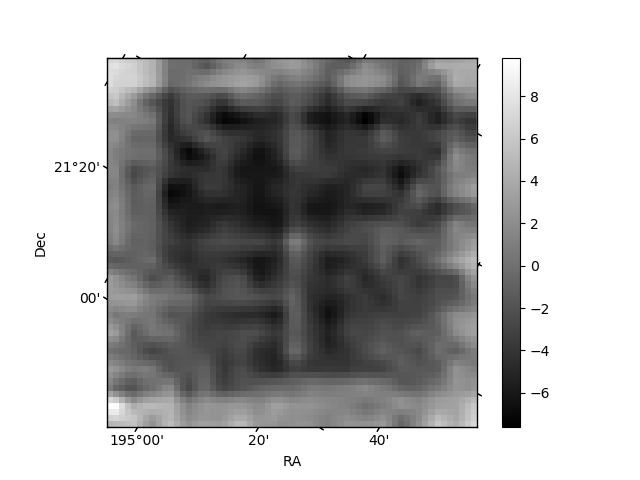
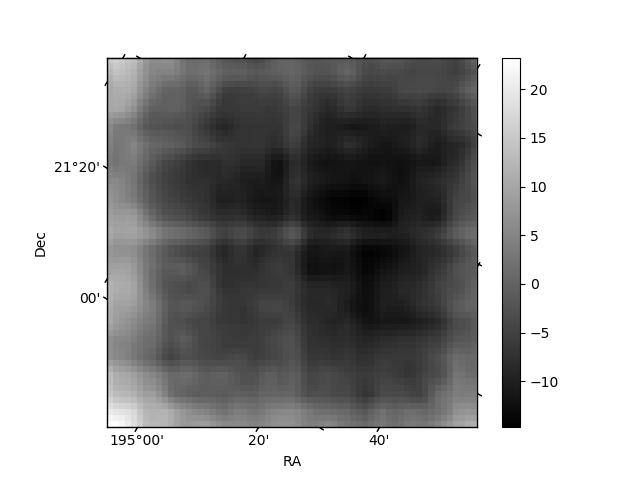
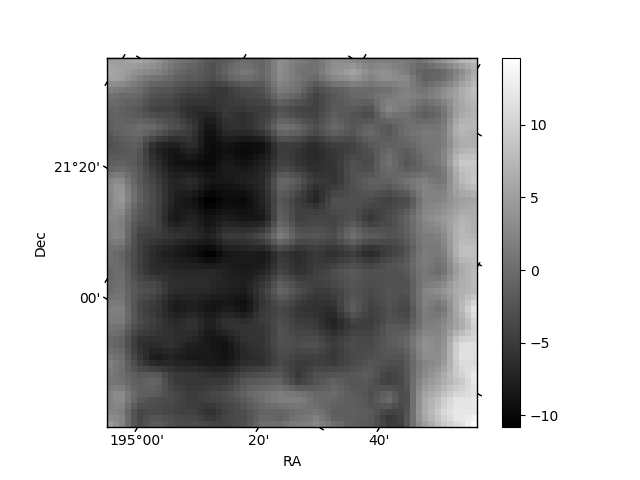
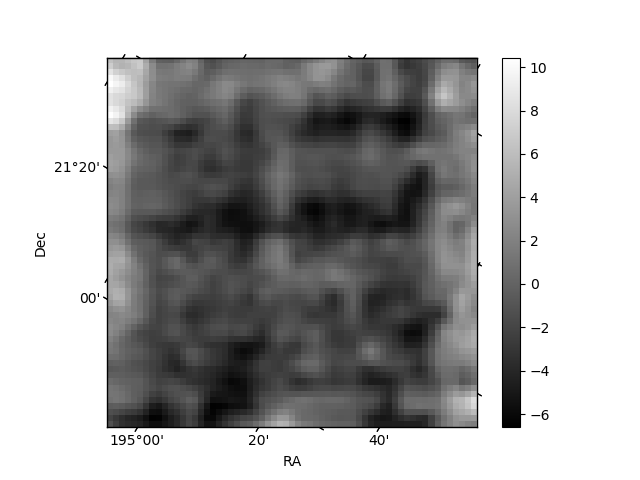
Histogram calculated using DETX and DETY for each event in the final _common_clean file
| Quadrant A | 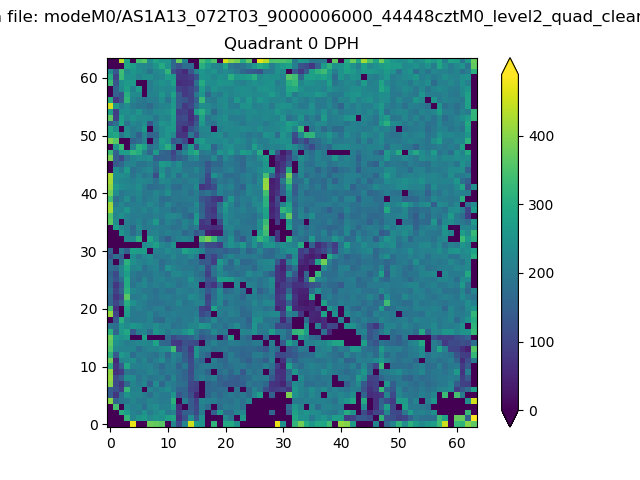 |
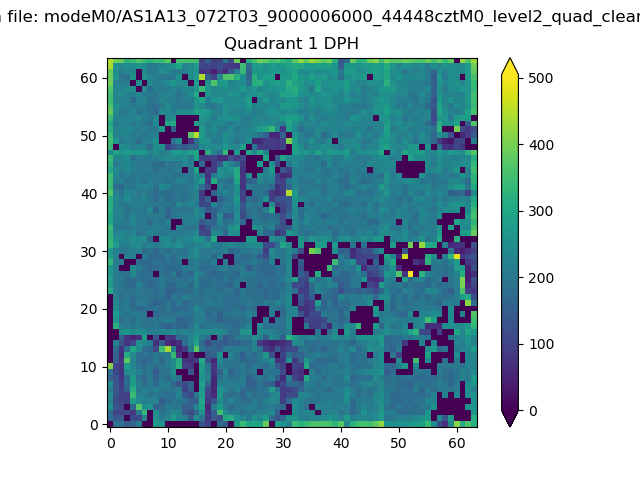 |
Quadrant B |
|---|---|---|---|
| Quadrant D | 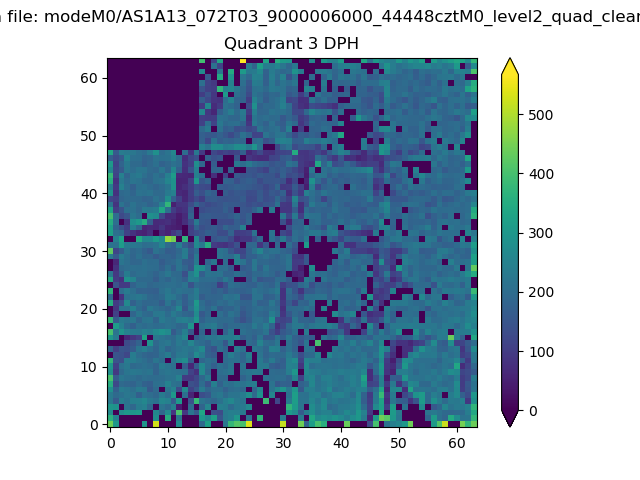 |
 |
Quadrant C |
| Plot type | Count rate plots | Images |
|---|---|---|
| Comparison with Poisson distribution Blue bars denote a histogram of data divided into 1 sec bins. Red curve is a Poisson curve with rate = median count rate of data. |
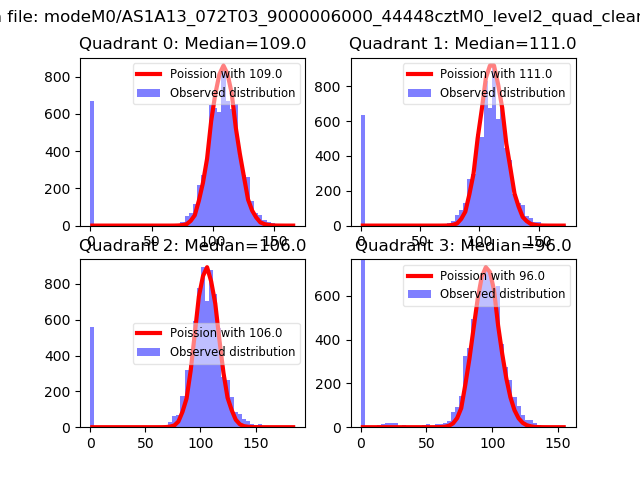 |
 |
| Quadrant-wise count rates Data is divided into 100 sec bins |
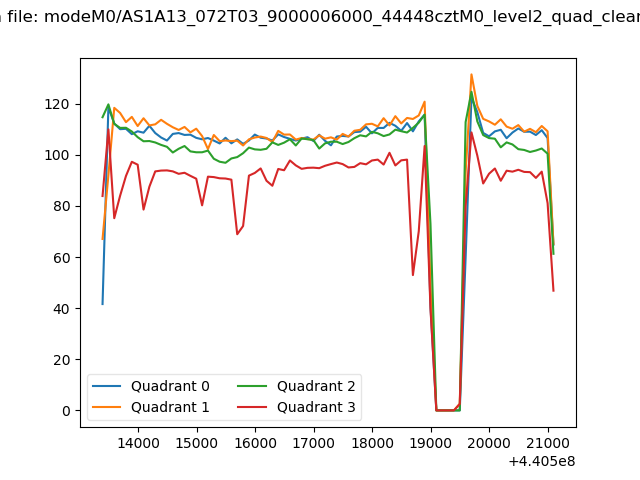 |
|
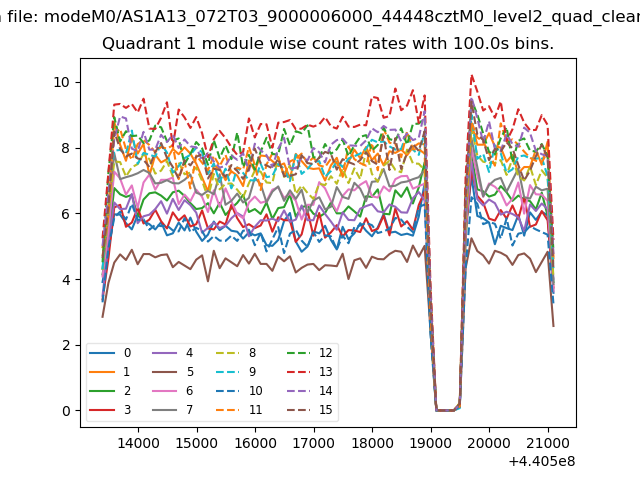
| Module-wise count rates for Quadrant A Data is divided into 100 sec bins |
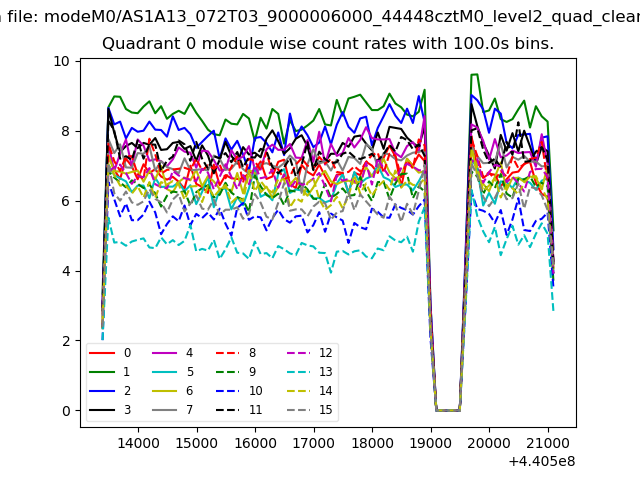 |
 |
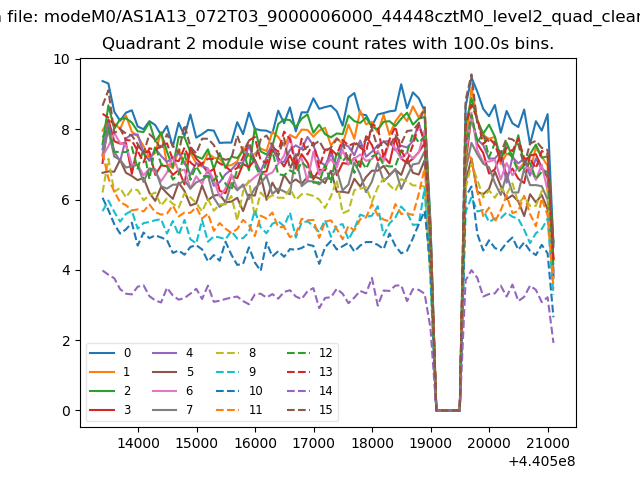
| Module-wise count rates for Quadrant B Data is divided into 100 sec bins |
 |
 |
| Module-wise count rates for Quadrant C Data is divided into 100 sec bins |
 |
 |
| Module-wise count rates for Quadrant D Data is divided into 100 sec bins |
 |
 |
| Parameter | Plot |
|---|---|
| CZT HV Monitor | 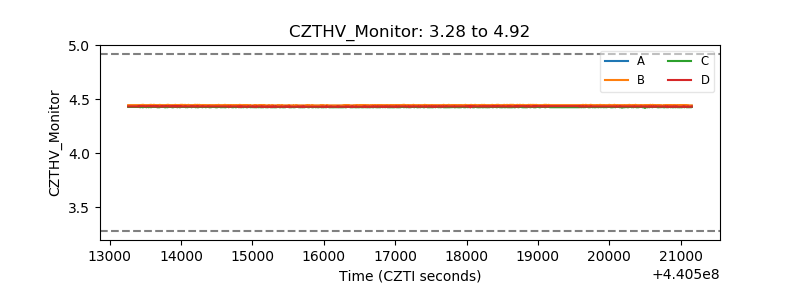 |
| D_VDD | 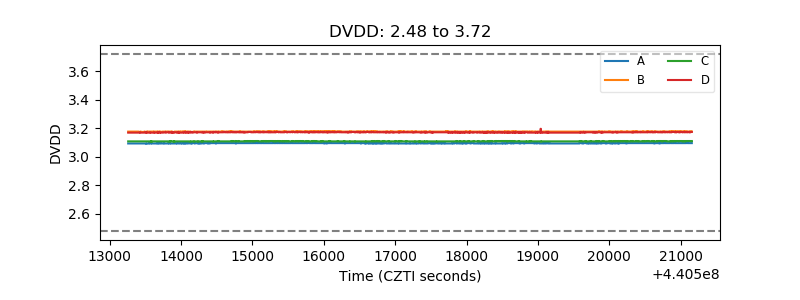 |
| Temperature 1 | 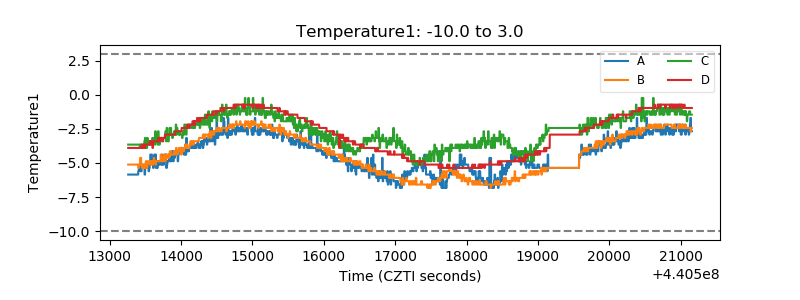 |
| Veto HV Monitor | 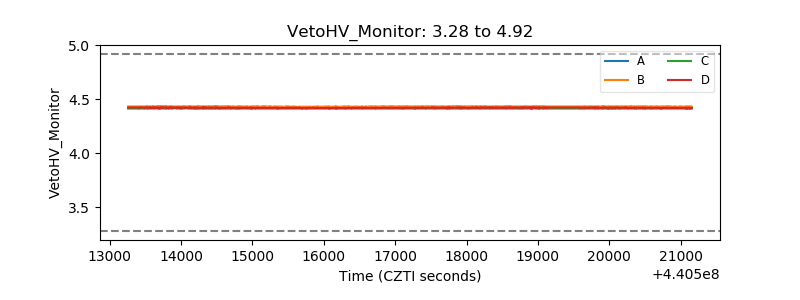 |
| Veto LLD |  |
| Alpha Counter | 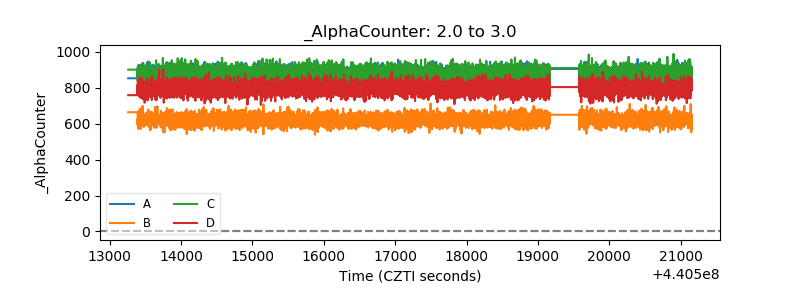 |
| _CPM_Rate | 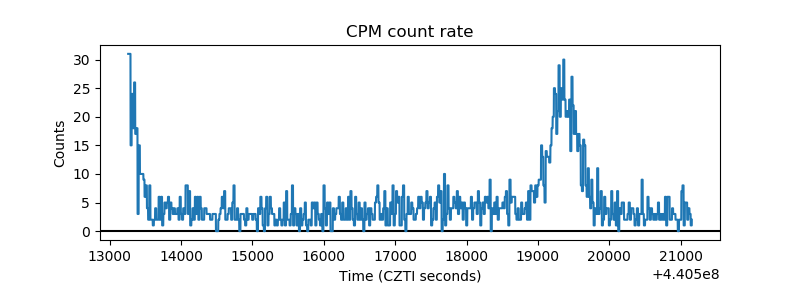 |
| CZT Counter | 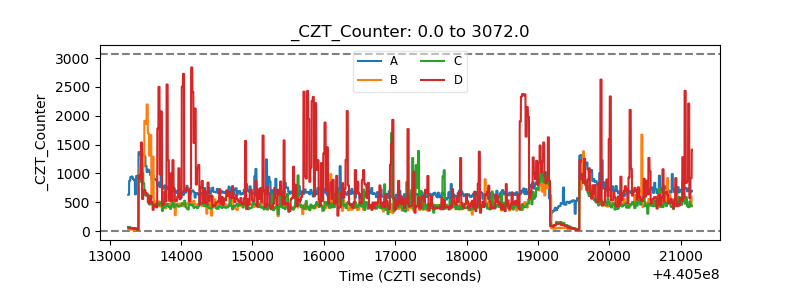 |
| +2.5 Volts monitor |  |
| +5 Volts monitor |  |
| _ROLL_ROT | 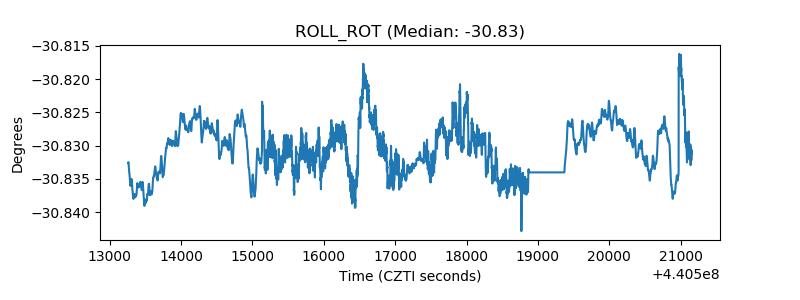 |
| _Roll_DEC | 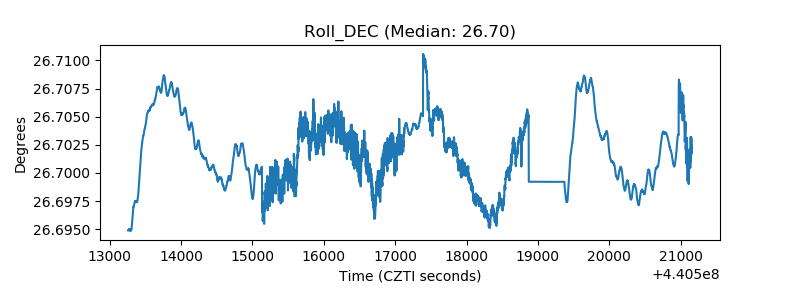 |
| _Roll_RA | 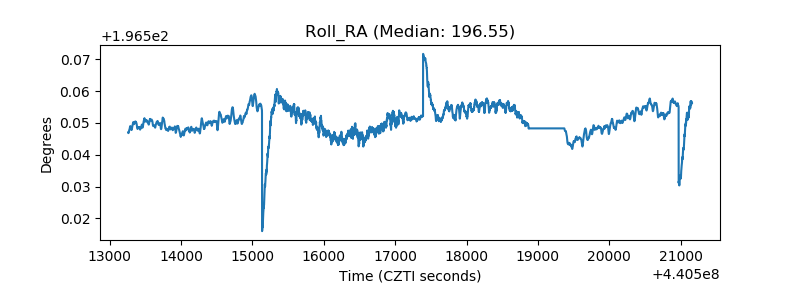 |
| Veto Counter |  |