| Param | Original file | Final file |
|---|---|---|
| Filename | modeM0/AS1A13_077T01_9000006014_44711cztM0_level2.fits | modeM0/AS1A13_077T01_9000006014_44711cztM0_level2_quad_clean.evt |
| Size (bytes) | 712,800,000 | 111,922,560 |
| Size | 679.8 MB | 106.7 MB |
| Events in quadrant A | 9,019,429 | 592,456 |
| Events in quadrant B | 4,077,656 | 835,284 |
| Events in quadrant C | 3,464,644 | 798,148 |
| Events in quadrant D | 9,229,122 | 629,809 |
| Mode M0 | |||
|---|---|---|---|
| Quadrant | BADHDUFLAG | Total packets | Discarded packets |
| A | 0 | 33084 | 0 |
| B | 0 | 17186 | 0 |
| C | 0 | 15944 | 0 |
| D | 0 | 32758 | 0 |
| Mode SS | |||
|---|---|---|---|
| Quadrant | BADHDUFLAG | Total packets | Discarded packets |
| A | 0 | 152 | 0 |
| B | 0 | 152 | 0 |
| C | 0 | 152 | 0 |
| D | 0 | 152 | 0 |
| Quadrant | Total seconds | Saturated seconds | Saturation percentage |
|---|---|---|---|
| A | 7663 | 2310 | 30.144852% |
| B | 7664 | 105 | 1.370042% |
| C | 7664 | 23 | 0.300104% |
| D | 7664 | 1383 | 18.045407% |
Noise dominated data is calculated using 1-second bins in cleaned event files. If a bin has >2000 counts, and if more than 50% of those come from <1% of pixels, then it is considered to be noise-dominated and hence unusable.
| Quadrant | # 1 sec bins | Bins with >0 counts | Bins with >2000 counts | High rate bins dominated by noise | Noise dominated (total time) | Noise dominated (detector-on time) | Marked lightcurve |
|---|---|---|---|---|---|---|---|
| A | 7663 | 7663 | 1506 | 1506 | 19.65% | 19.65% | 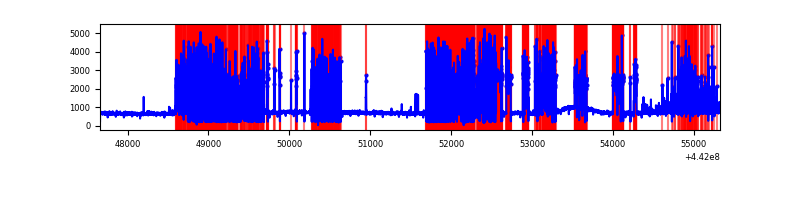 |
| B | 7664 | 7664 | 34 | 34 | 0.44% | 0.44% | 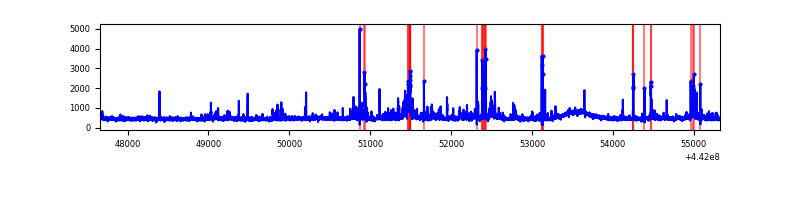 |
| C | 7664 | 7664 | 11 | 11 | 0.14% | 0.14% | 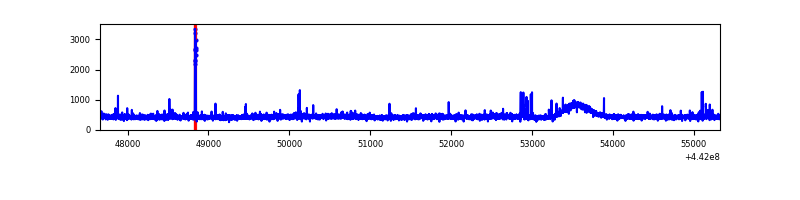 |
| D | 7664 | 7664 | 1214 | 1214 | 15.84% | 15.84% | 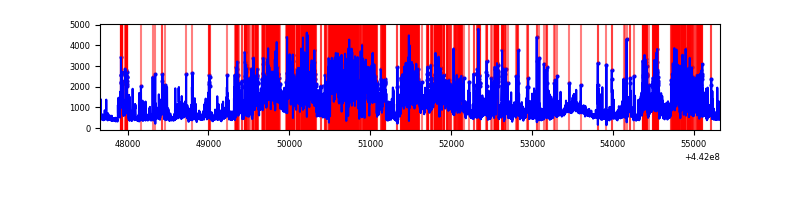 |
Top three noisy pixels from each quadrant. If the there are fewer than three noisy pixels in the level2.evt file, extra rows are filled as -1
| Pixel properties | Quadrant properties | ||||||
|---|---|---|---|---|---|---|---|
| Quadrant | DetID | PixID | Counts | Sigma | Mean | Median | Sigma |
| A | 15 | 223 | 4696387 | 32370.97 | 691 | 677 | 145.1 |
| A | 10 | 83 | 1602946 | 11045.62 | 691 | 677 | 145.1 |
| A | 10 | 248 | 25882 | 173.76 | 691 | 677 | 145.1 |
| B | 4 | 170 | 291467 | 1696.08 | 864 | 838 | 171.4 |
| B | 0 | 189 | 88660 | 512.52 | 864 | 838 | 171.4 |
| B | 5 | 172 | 43905 | 251.33 | 864 | 838 | 171.4 |
| C | 14 | 254 | 49117 | 238.88 | 853 | 858 | 202.0 |
| C | 1 | 3 | 37409 | 180.93 | 853 | 858 | 202.0 |
| C | 3 | 233 | 19693 | 93.23 | 853 | 858 | 202.0 |
| D | 11 | 241 | 2528842 | 12449.56 | 808 | 784 | 203.1 |
| D | 13 | 249 | 836758 | 4116.8 | 808 | 784 | 203.1 |
| D | 11 | 192 | 594977 | 2926.13 | 808 | 784 | 203.1 |
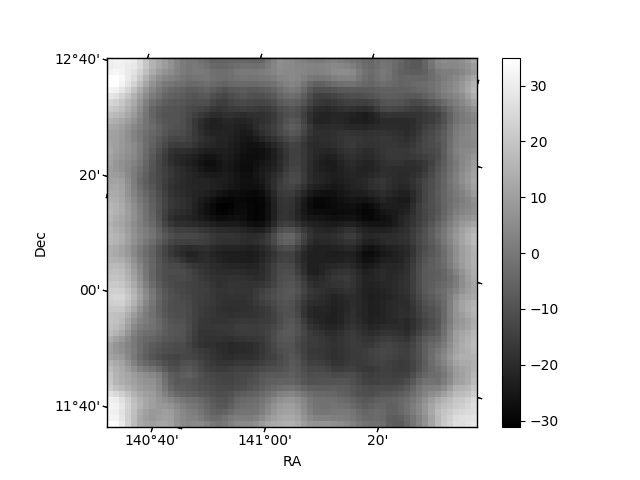
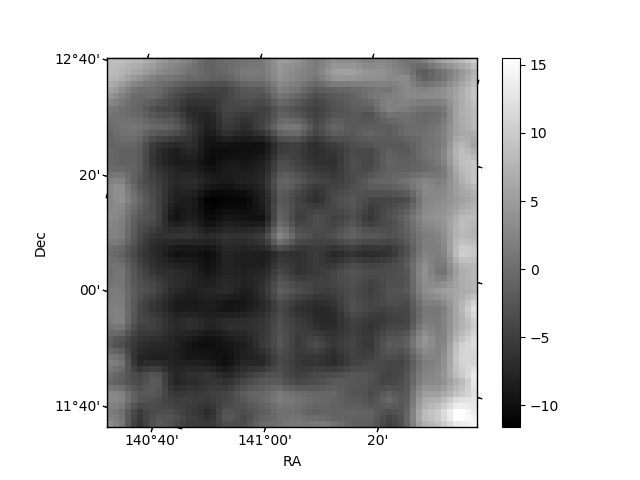
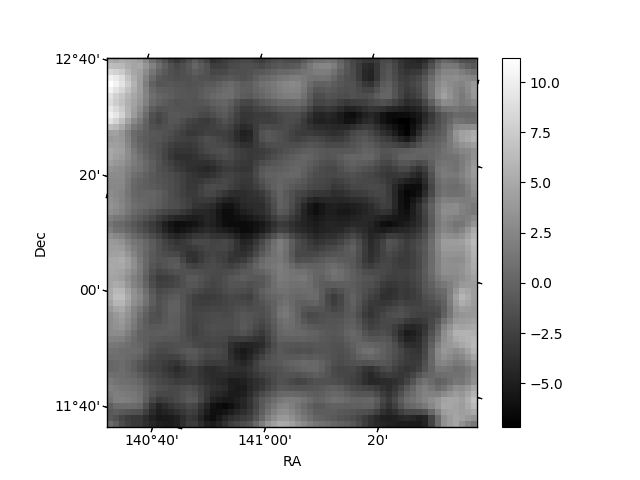
Histogram calculated using DETX and DETY for each event in the final _common_clean file
| Quadrant A | 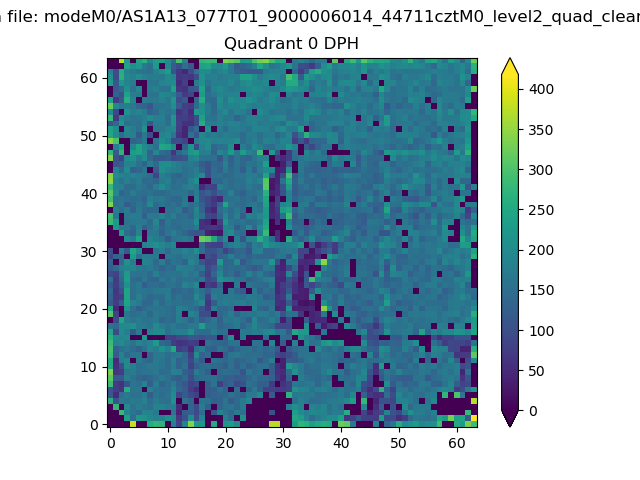 |
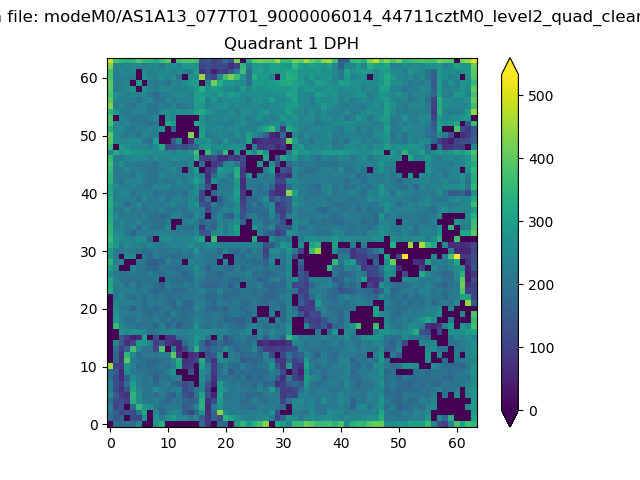 |
Quadrant B |
|---|---|---|---|
| Quadrant D | 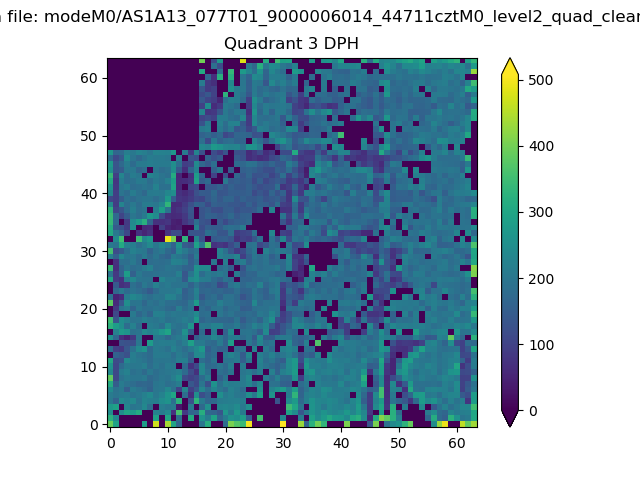 |
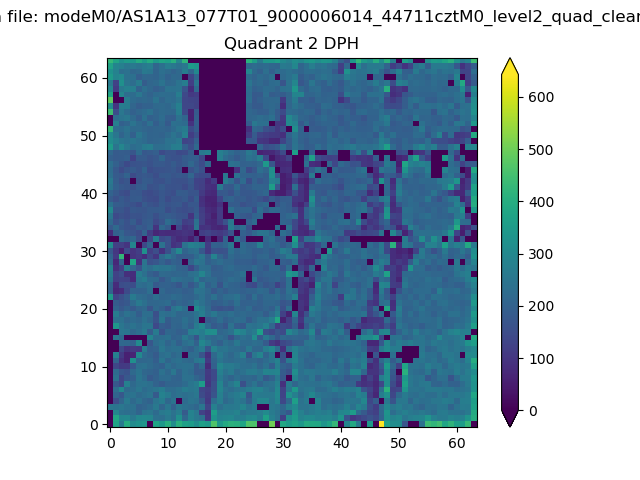 |
Quadrant C |
| Plot type | Count rate plots | Images |
|---|---|---|
| Comparison with Poisson distribution Blue bars denote a histogram of data divided into 1 sec bins. Red curve is a Poisson curve with rate = median count rate of data. |
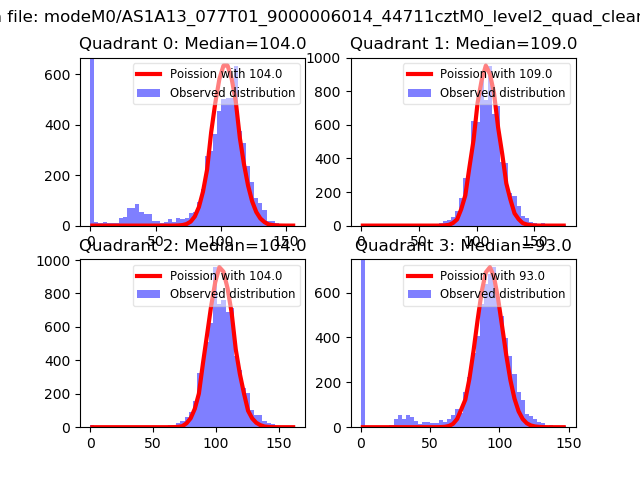 |
 |
| Quadrant-wise count rates Data is divided into 100 sec bins |
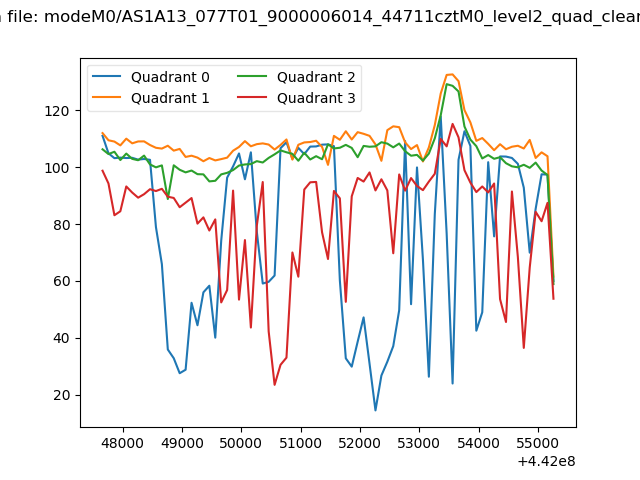 |
|
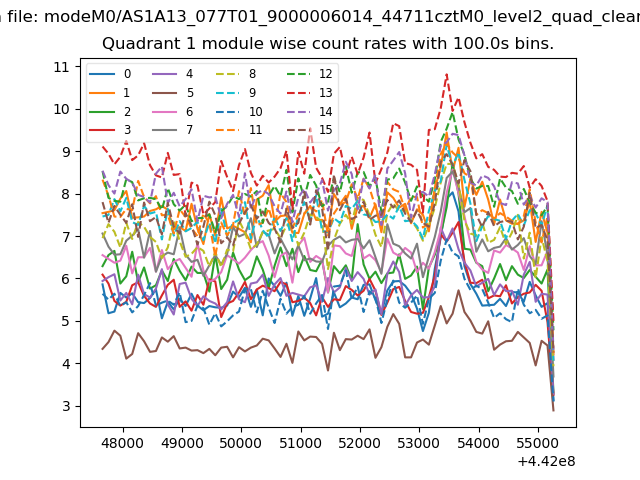
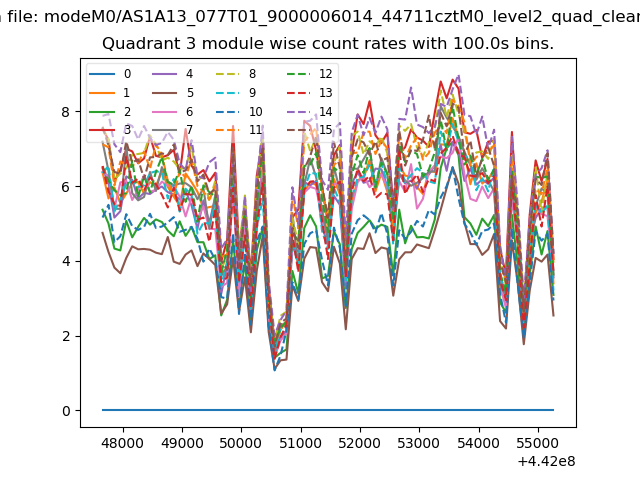
| Module-wise count rates for Quadrant A Data is divided into 100 sec bins |
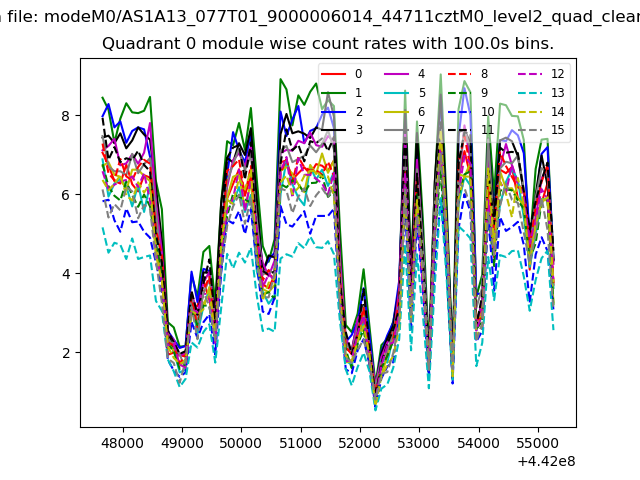 |
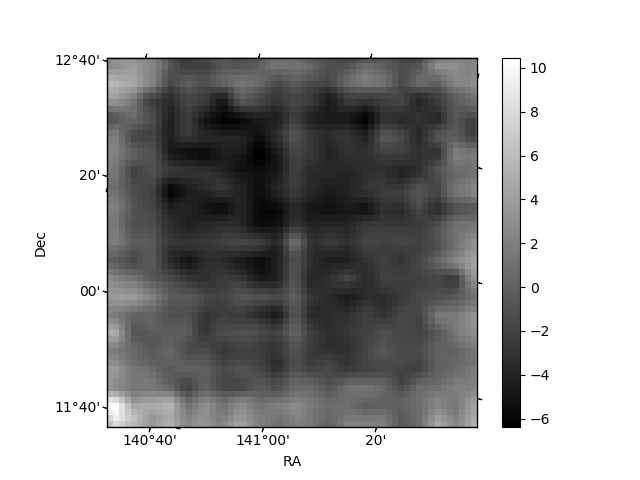 |
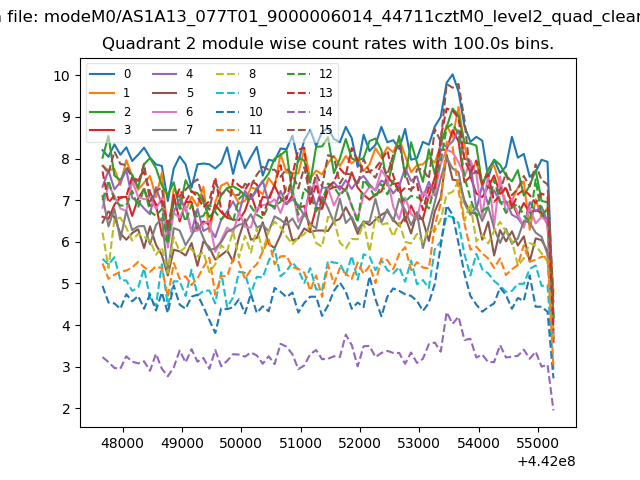
| Module-wise count rates for Quadrant B Data is divided into 100 sec bins |
 |
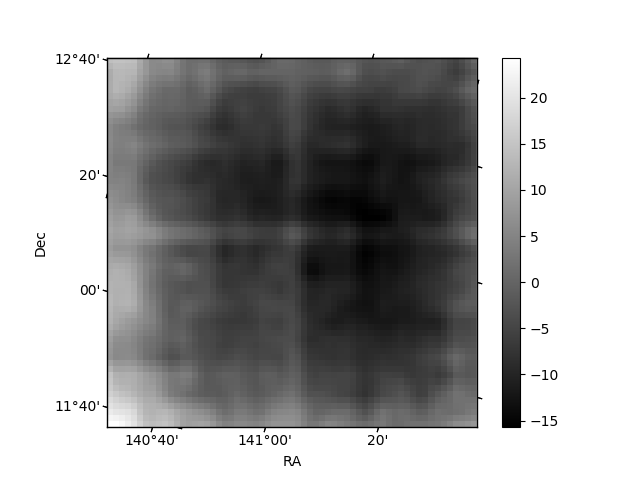 |
| Module-wise count rates for Quadrant C Data is divided into 100 sec bins |
 |
 |
| Module-wise count rates for Quadrant D Data is divided into 100 sec bins |
 |
 |
| Parameter | Plot |
|---|---|
| CZT HV Monitor | 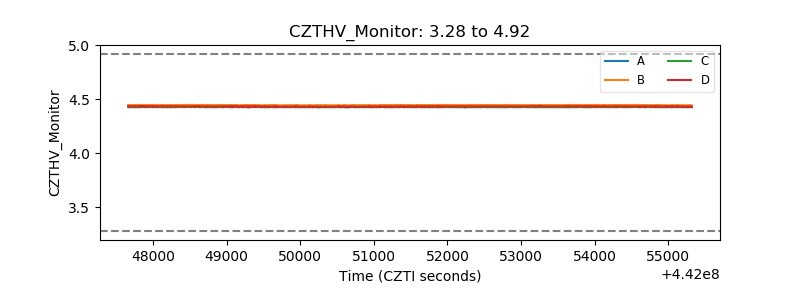 |
| D_VDD | 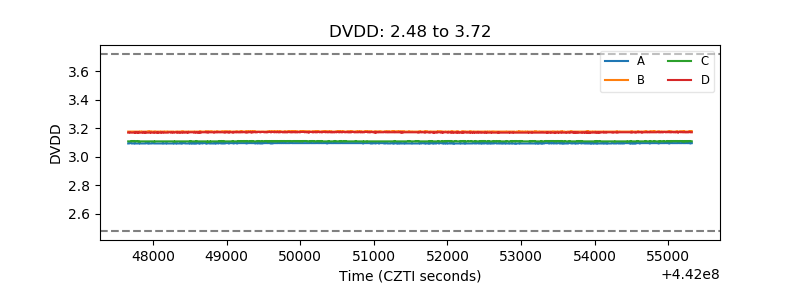 |
| Temperature 1 | 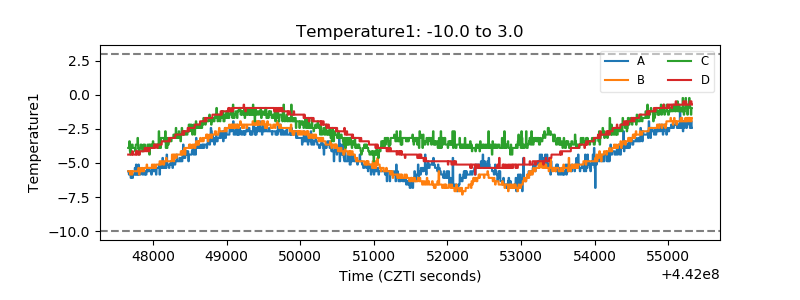 |
| Veto HV Monitor | 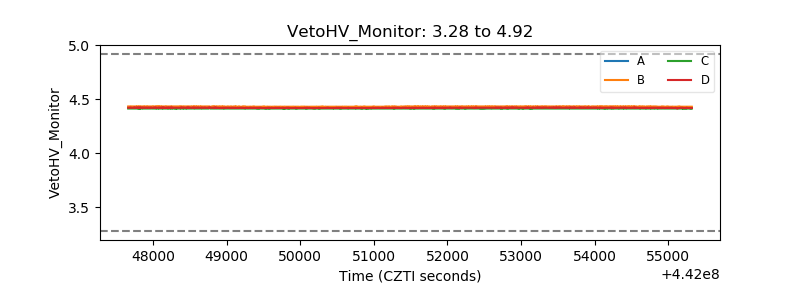 |
| Veto LLD | 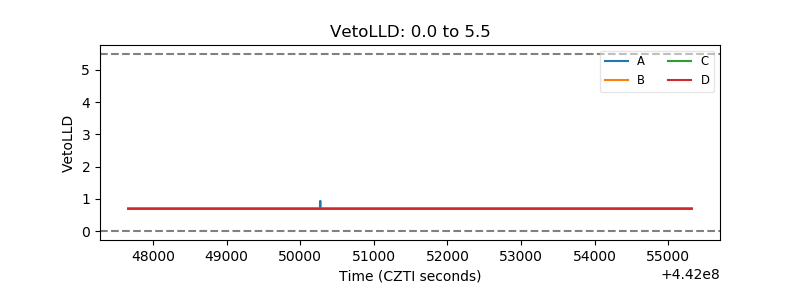 |
| Alpha Counter | 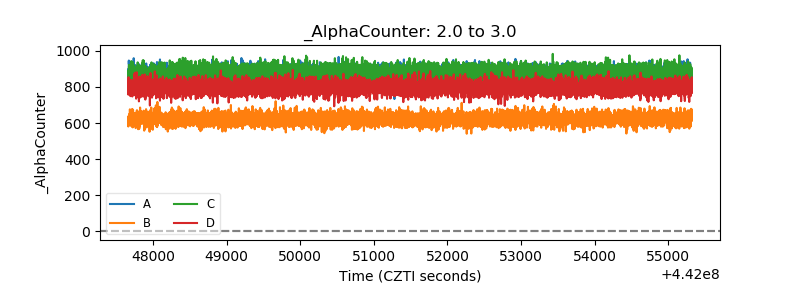 |
| _CPM_Rate | 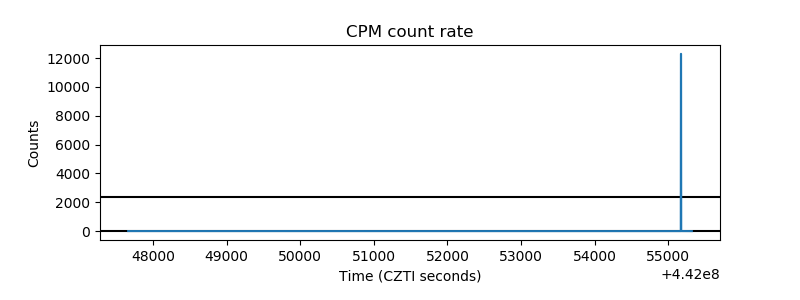 |
| CZT Counter | 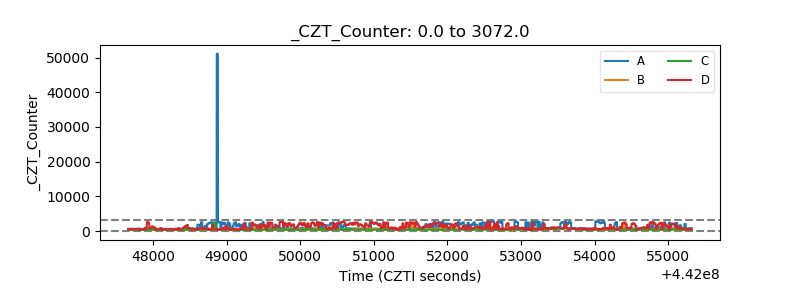 |
| +2.5 Volts monitor | 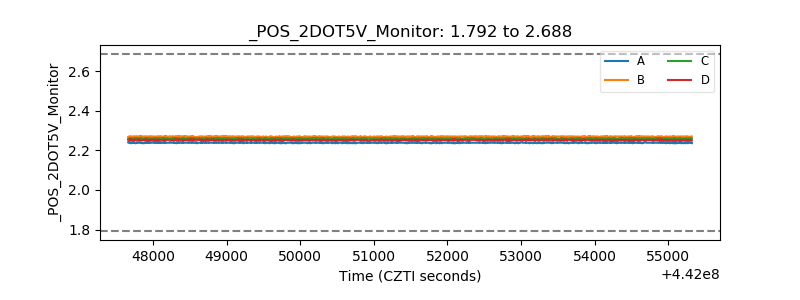 |
| +5 Volts monitor | 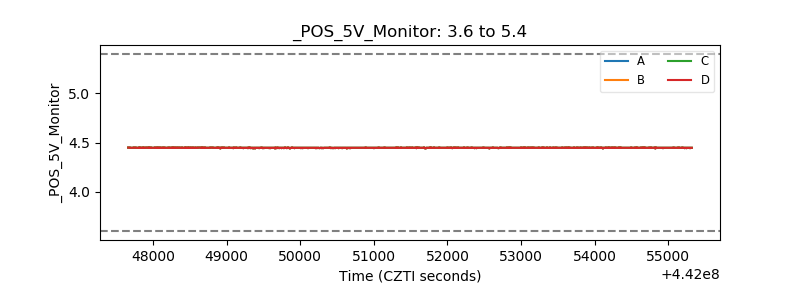 |
| _ROLL_ROT | 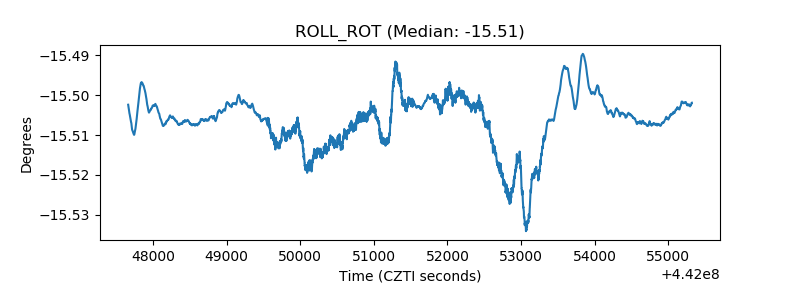 |
| _Roll_DEC | 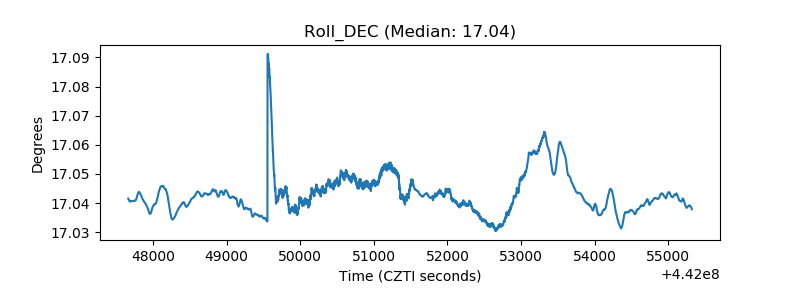 |
| _Roll_RA | 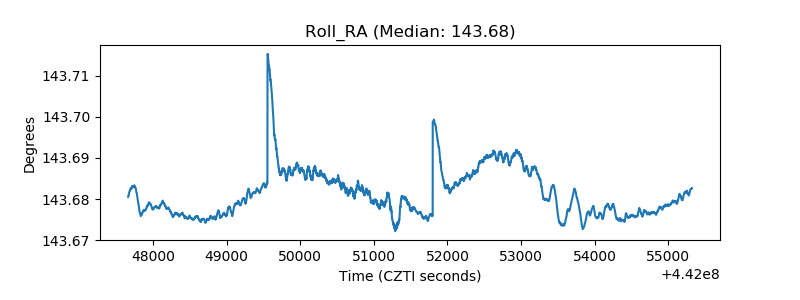 |
| Veto Counter | 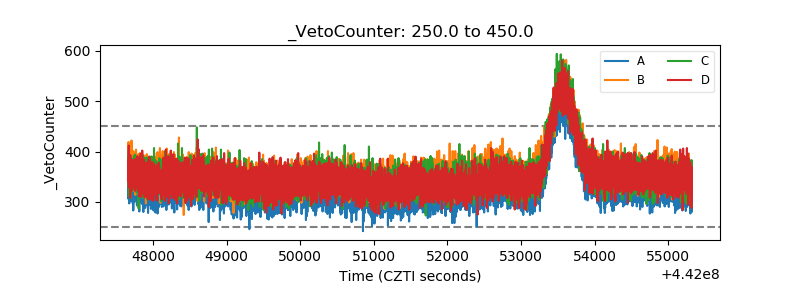 |