| Param | Original file | Final file |
|---|---|---|
| Filename | modeM0/AS1A13_077T01_9000006014_44718cztM0_level2.fits | modeM0/AS1A13_077T01_9000006014_44718cztM0_level2_quad_clean.evt |
| Size (bytes) | 211,872,960 | 32,486,400 |
| Size | 202.1 MB | 31.0 MB |
| Events in quadrant A | 1,664,563 | 238,072 |
| Events in quadrant B | 1,429,849 | 234,606 |
| Events in quadrant C | 919,207 | 230,181 |
| Events in quadrant D | 3,663,163 | 128,195 |
| Mode M0 | |||
|---|---|---|---|
| Quadrant | BADHDUFLAG | Total packets | Discarded packets |
| A | 0 | 6629 | 0 |
| B | 0 | 5699 | 0 |
| C | 0 | 4248 | 0 |
| D | 0 | 12343 | 0 |
| Mode SS | |||
|---|---|---|---|
| Quadrant | BADHDUFLAG | Total packets | Discarded packets |
| A | 0 | 42 | 0 |
| B | 0 | 42 | 0 |
| C | 0 | 42 | 0 |
| D | 0 | 42 | 0 |
| Quadrant | Total seconds | Saturated seconds | Saturation percentage |
|---|---|---|---|
| A | 2108 | 23 | 1.091082% |
| B | 2109 | 90 | 4.267425% |
| C | 2109 | 0 | 0.000000% |
| D | 2109 | 893 | 42.342342% |
Noise dominated data is calculated using 1-second bins in cleaned event files. If a bin has >2000 counts, and if more than 50% of those come from <1% of pixels, then it is considered to be noise-dominated and hence unusable.
| Quadrant | # 1 sec bins | Bins with >0 counts | Bins with >2000 counts | High rate bins dominated by noise | Noise dominated (total time) | Noise dominated (detector-on time) | Marked lightcurve |
|---|---|---|---|---|---|---|---|
| A | 2108 | 2108 | 11 | 11 | 0.52% | 0.52% | 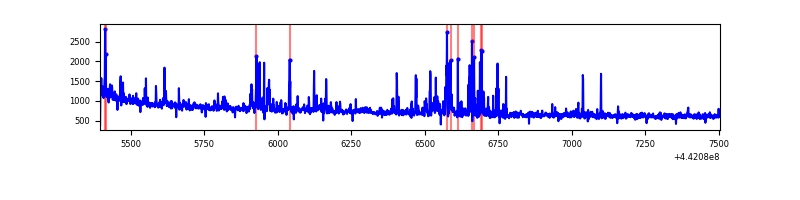 |
| B | 2109 | 2109 | 48 | 48 | 2.28% | 2.28% | 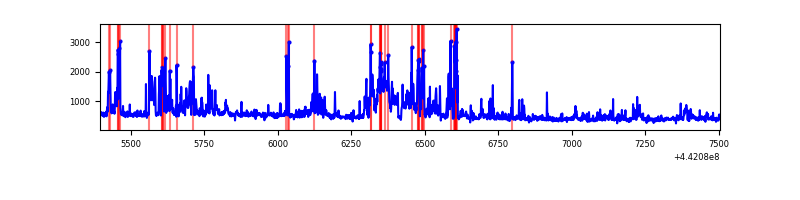 |
| C | 2109 | 2109 | 0 | 0 | 0.00% | 0.00% | 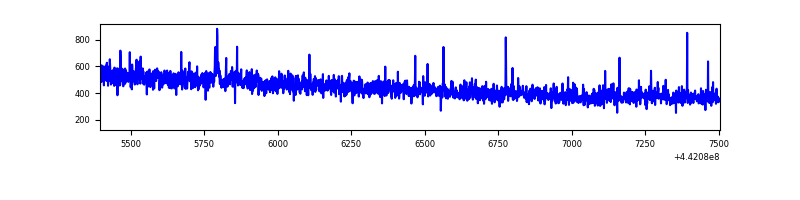 |
| D | 2109 | 2109 | 870 | 870 | 41.25% | 41.25% | 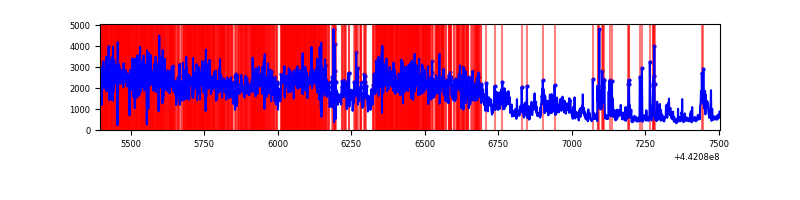 |
Top three noisy pixels from each quadrant. If the there are fewer than three noisy pixels in the level2.evt file, extra rows are filled as -1
| Pixel properties | Quadrant properties | ||||||
|---|---|---|---|---|---|---|---|
| Quadrant | DetID | PixID | Counts | Sigma | Mean | Median | Sigma |
| A | 10 | 83 | 610552 | 12181.69 | 233 | 229 | 50.1 |
| A | 15 | 223 | 142538 | 2840.41 | 233 | 229 | 50.1 |
| A | 0 | 243 | 3170 | 58.7 | 233 | 229 | 50.1 |
| B | 4 | 171 | 331315 | 6928.4 | 234 | 227 | 47.8 |
| B | 0 | 189 | 76998 | 1606.52 | 234 | 227 | 47.8 |
| B | 0 | 186 | 31926 | 663.34 | 234 | 227 | 47.8 |
| C | 0 | 207 | 5040 | 85.13 | 232 | 233 | 56.5 |
| C | 3 | 233 | 3865 | 64.32 | 232 | 233 | 56.5 |
| C | 12 | 2 | 2947 | 48.06 | 232 | 233 | 56.5 |
| D | 11 | 241 | 2181424 | 44865.15 | 185 | 180 | 48.6 |
| D | 1 | 52 | 288746 | 5935.4 | 185 | 180 | 48.6 |
| D | 5 | 222 | 135135 | 2775.84 | 185 | 180 | 48.6 |
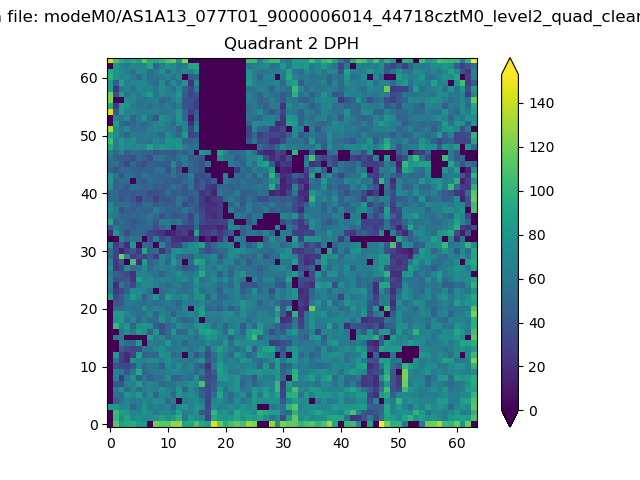
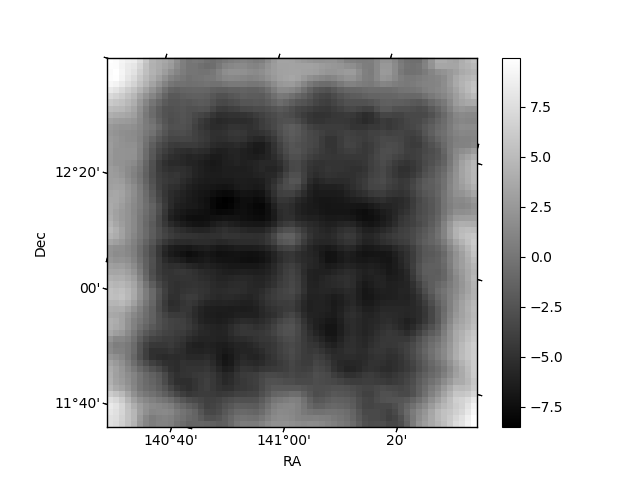
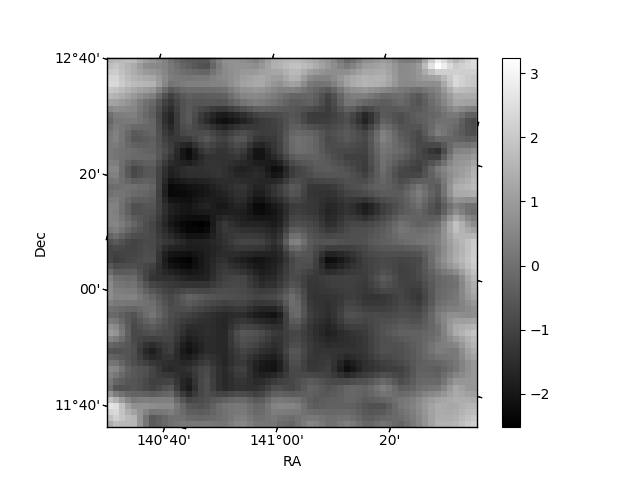
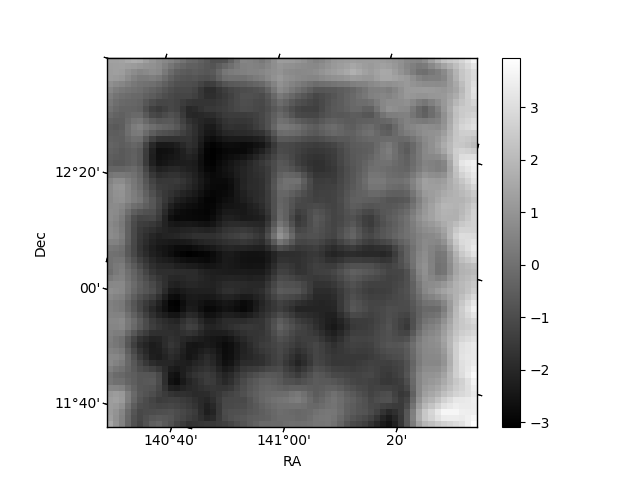
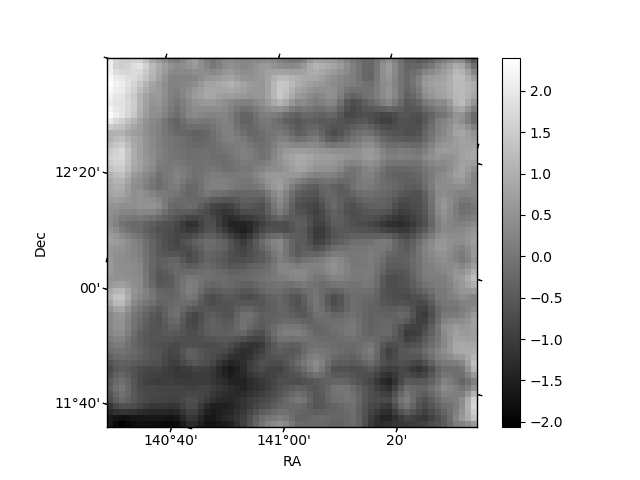
Histogram calculated using DETX and DETY for each event in the final _common_clean file
| Quadrant A | 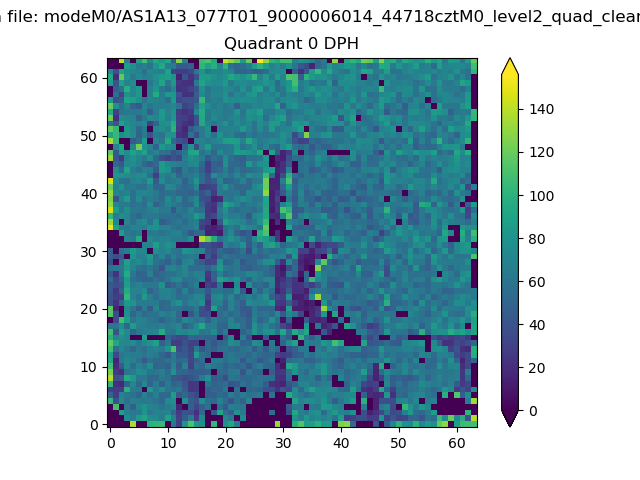 |
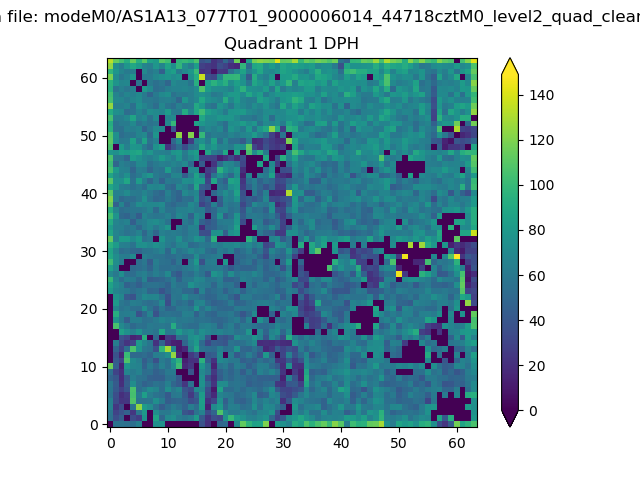 |
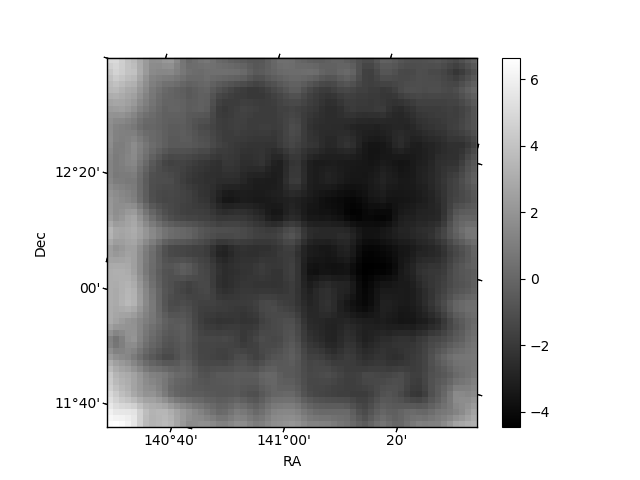
Quadrant B |
|---|---|---|---|
| Quadrant D | 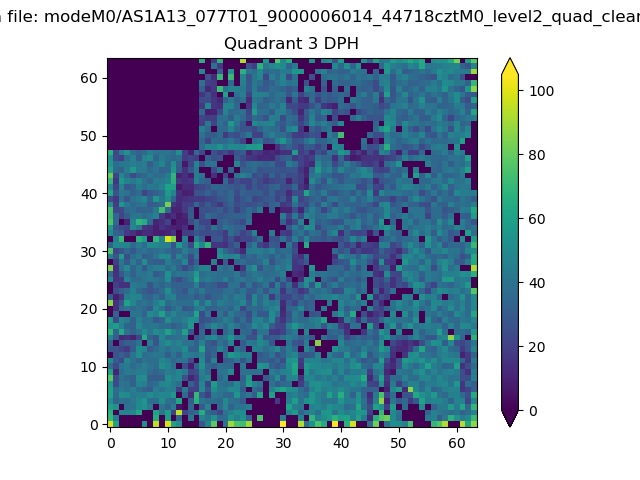 |
 |
Quadrant C |
| Plot type | Count rate plots | Images |
|---|---|---|
| Comparison with Poisson distribution Blue bars denote a histogram of data divided into 1 sec bins. Red curve is a Poisson curve with rate = median count rate of data. |
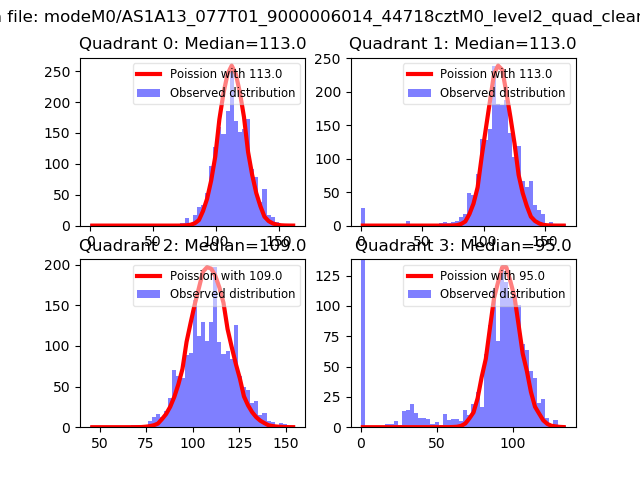 |
 |
| Quadrant-wise count rates Data is divided into 100 sec bins |
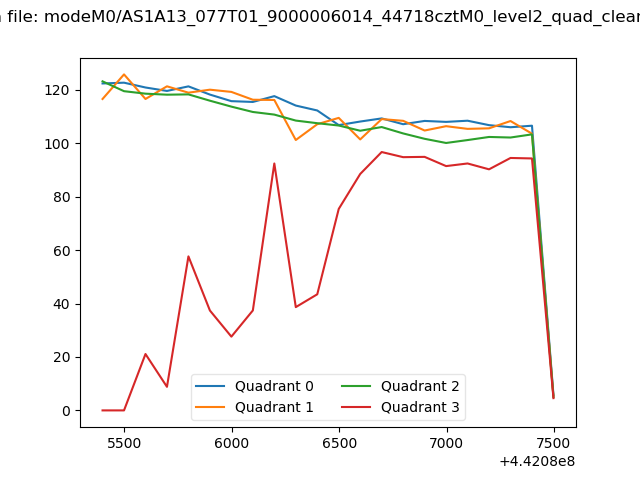 |
|
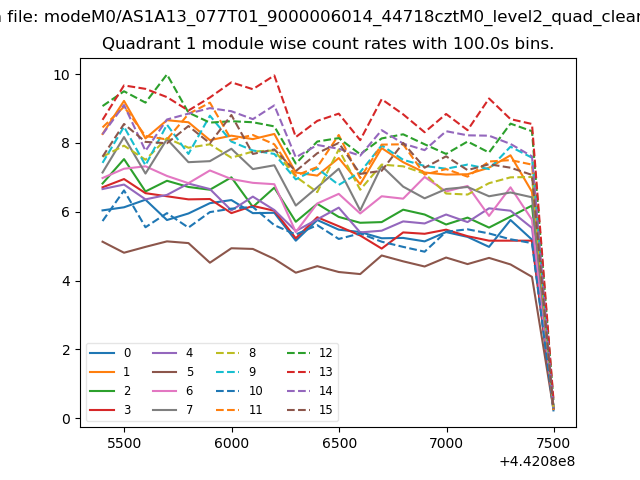
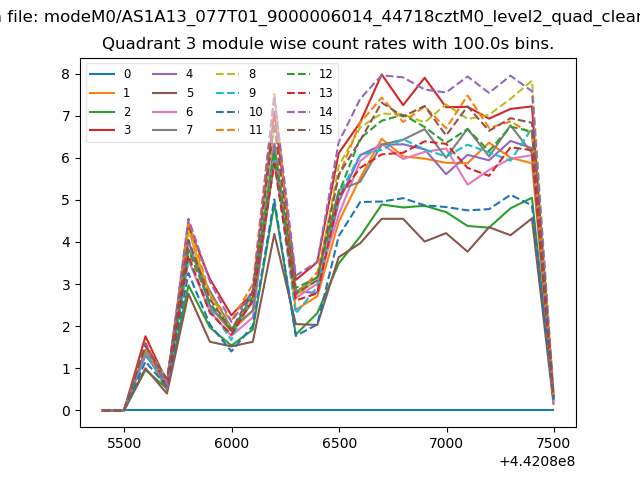
| Module-wise count rates for Quadrant A Data is divided into 100 sec bins |
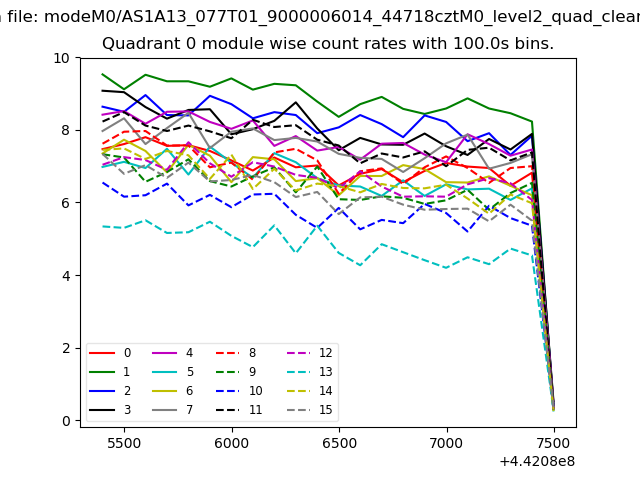 |
 |
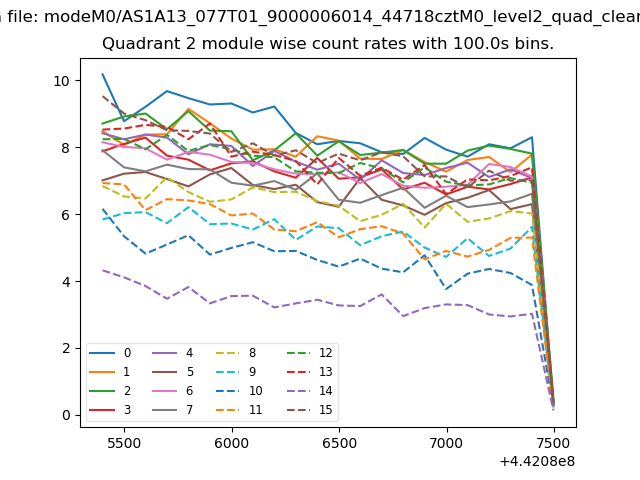
| Module-wise count rates for Quadrant B Data is divided into 100 sec bins |
 |
 |
| Module-wise count rates for Quadrant C Data is divided into 100 sec bins |
 |
 |
| Module-wise count rates for Quadrant D Data is divided into 100 sec bins |
 |
 |
| Parameter | Plot |
|---|---|
| CZT HV Monitor | 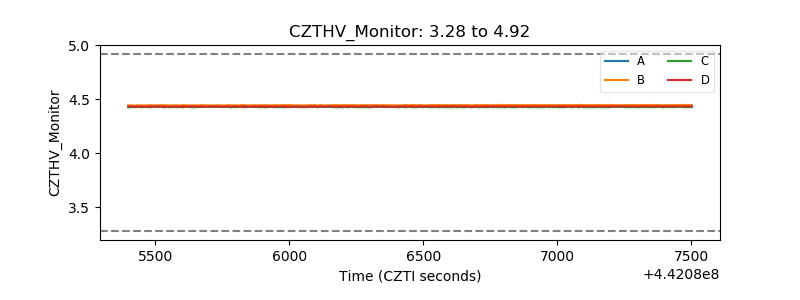 |
| D_VDD | 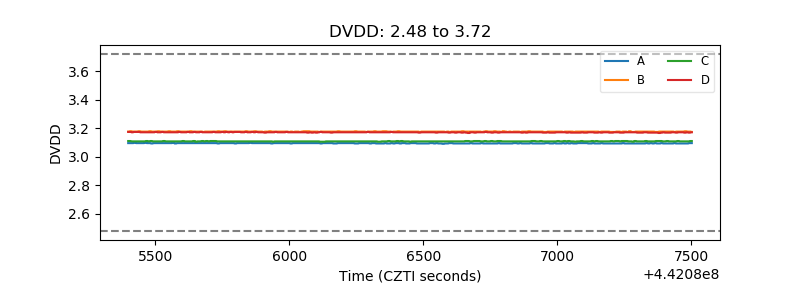 |
| Temperature 1 | 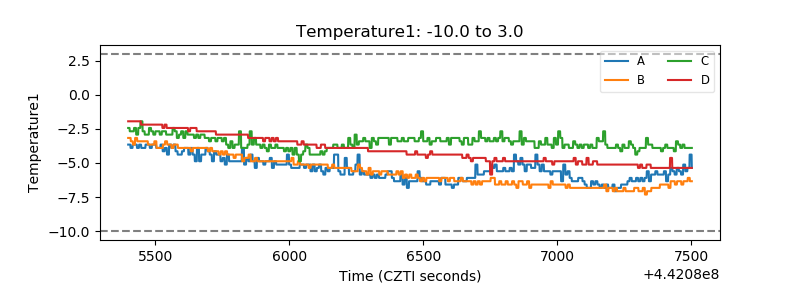 |
| Veto HV Monitor | 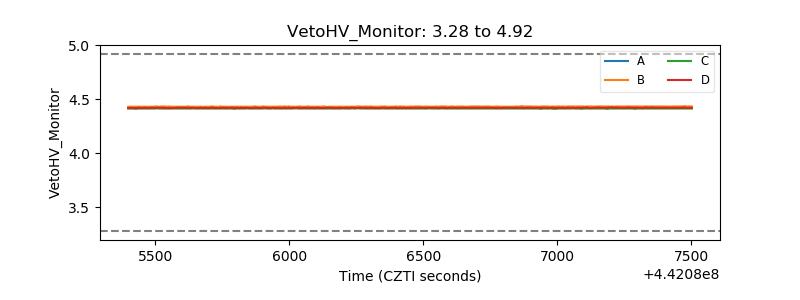 |
| Veto LLD | 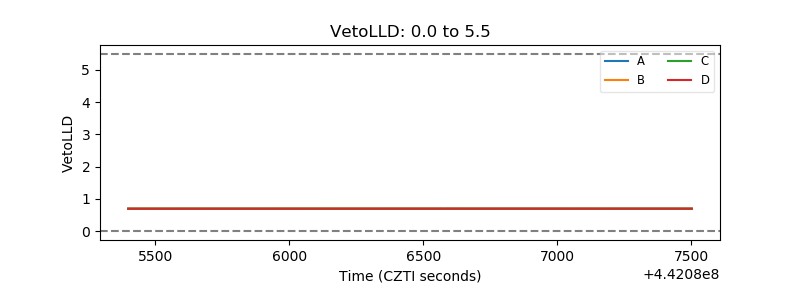 |
| Alpha Counter | 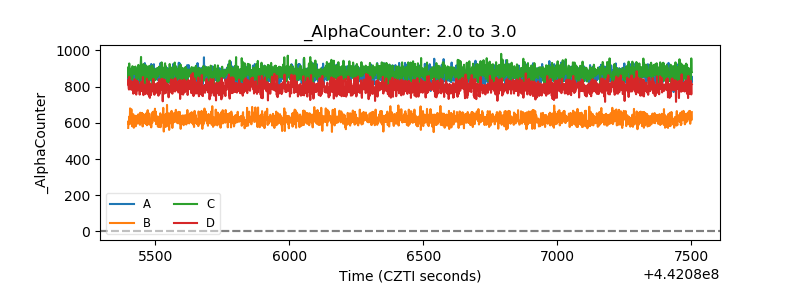 |
| _CPM_Rate | 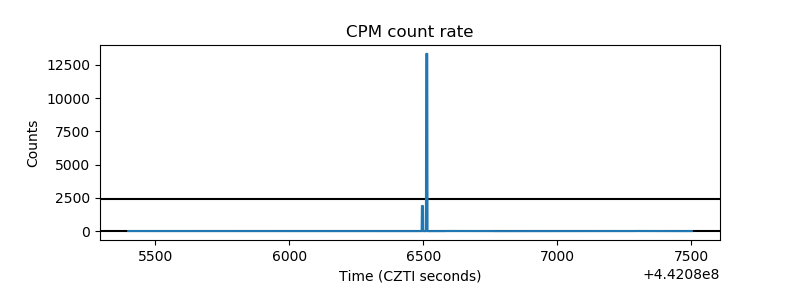 |
| CZT Counter |  |
| +2.5 Volts monitor | 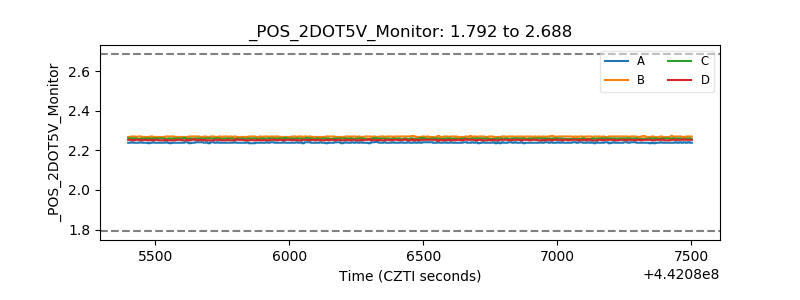 |
| +5 Volts monitor | 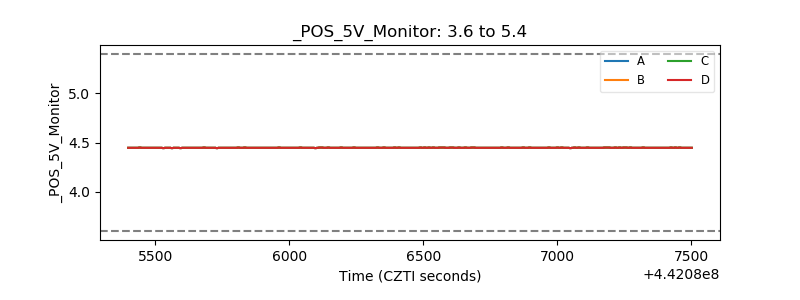 |
| _ROLL_ROT | 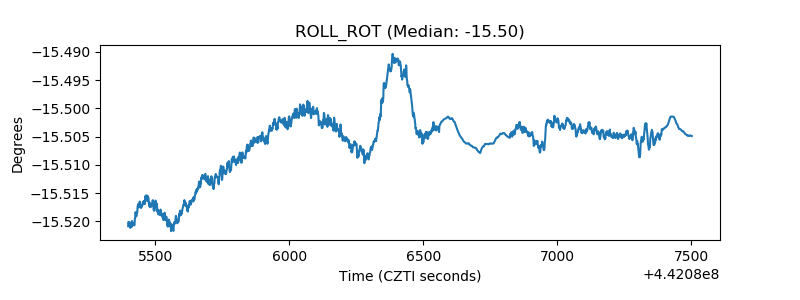 |
| _Roll_DEC | 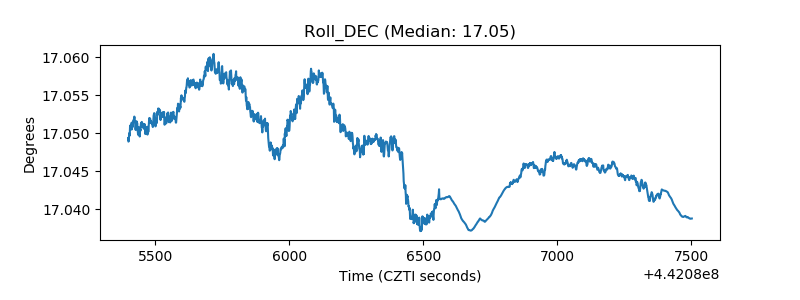 |
| _Roll_RA | 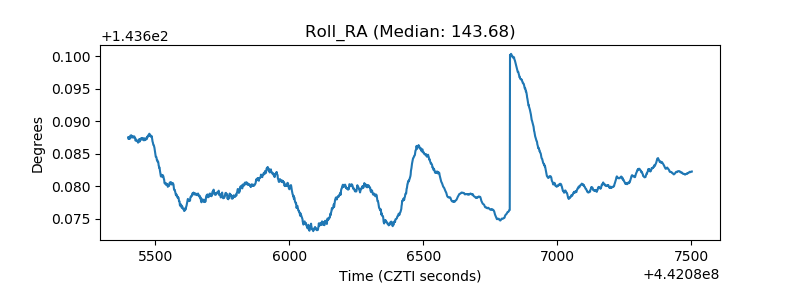 |
| Veto Counter | 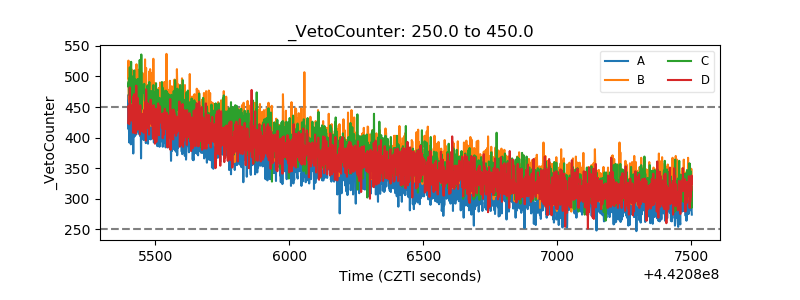 |